What is a Step line chart
The step line chart is a type of line chart, but unlike the original line chart, it has a ladder-like kind of visualization. Here, data points are linked with horizontal and vertical lines creating steps that represent the price for a specific time interval.
CONTENTS:
What is a step line chart
Step line charts may be a good choice when you need to display sudden price changes, which, for example, occur in the prices of stocks after earnings reports or policy changes.
Horizontal lines highlight periods of stability, and this type of chart helps to easier spot sudden changes.

Step line charts vs line charts
Even though these two chart types may look alike while displaying similar data, they both have unique applications and benefits.
Step line
- Help easier spot prices at which the price experienced a significant change
- Better for determining event-driven changes (e.g., stock splits, earnings reports, etc.)
- Suit better to display financial data
Standard lines
- Doesn't show the exact point at which a change occurs
- Easier to read for general trend
- Better suited for pattern recognition
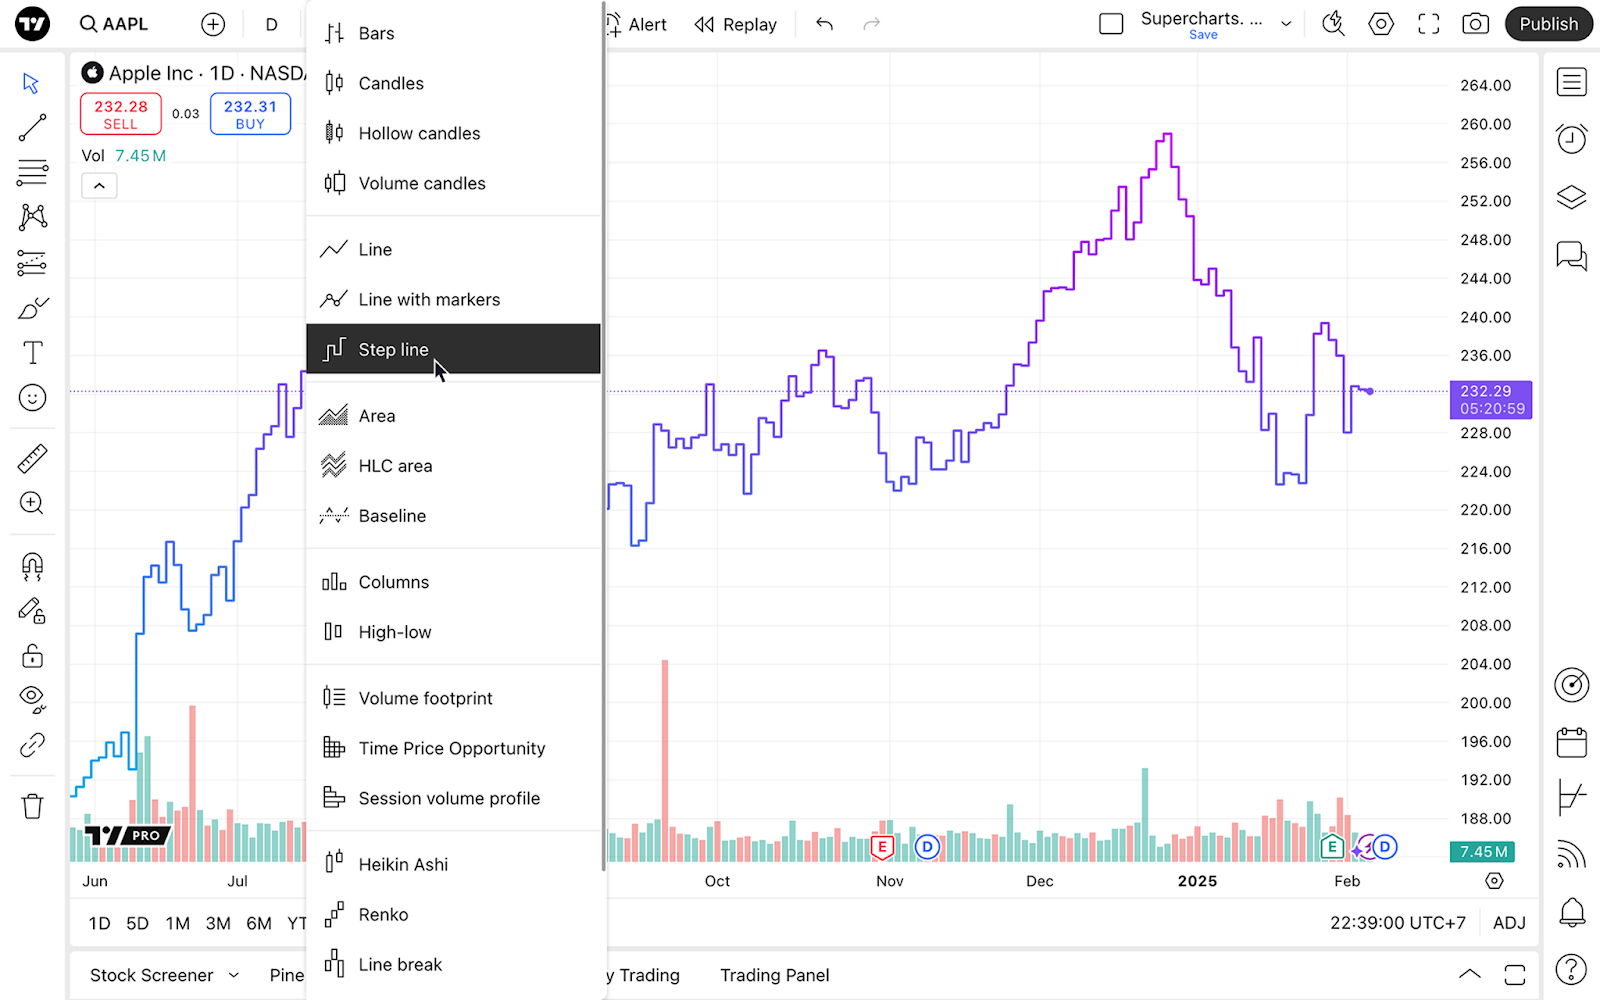
Enabling the chart type
Once you are on the Supercharts, open the chart type menu on the upper toolbar, and select "Step line."
Settings
To make the most of the line chart, you can customize it according to your preferences and needs.
To do so, find the gear-like "Settings" button on the upper toolbar, and go to the "Symbol" tab.
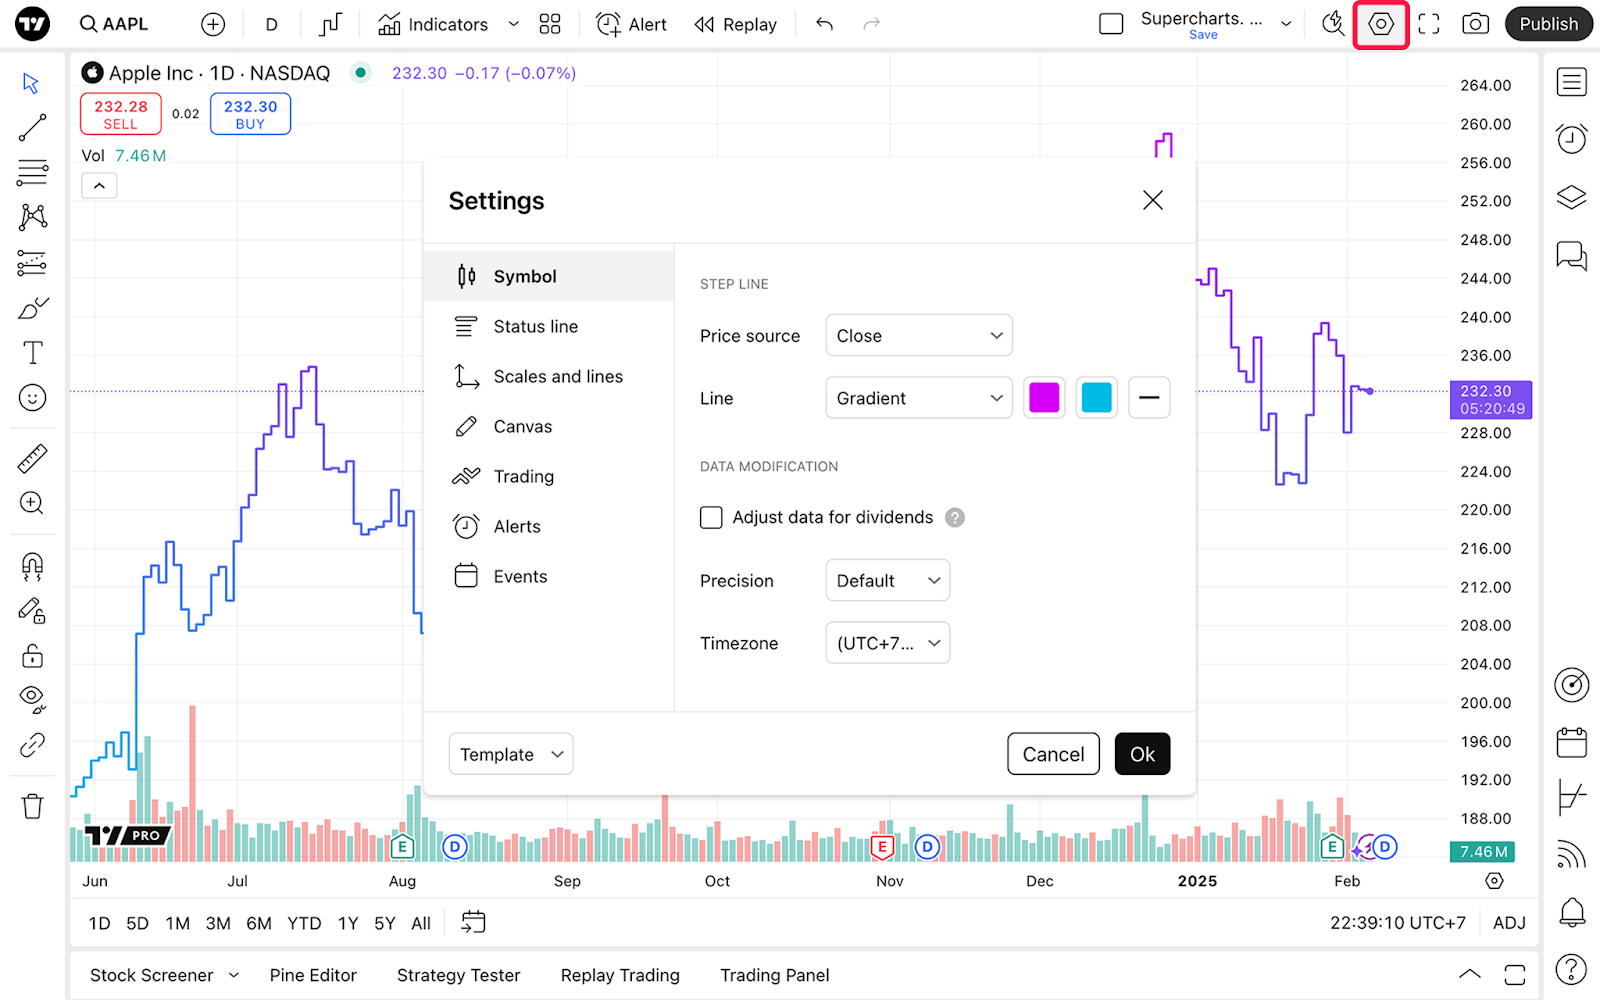
The "Step line" section lists settings specific to this chart type:
- Price source: Choose the price you want the chart to show. By default, it is set to close price meaning the step line chart will be formed with the closing prices of an asset. According to your trading style, choose the desired price:
- Open: The chart will show the opening prices
- High: Shows only the highest prices
- Low: Shows only the lowest prices
- Close: Shows only the closing prices
- (H + L)/2: Shows the average of the highest and lowest prices
- (H + L + C)/3: Shows the average of the highest, lowest, and closing prices
- (O + H + L + C)/4: Shows the average of the opening, highest, lowest, and closing prices
- Line: With this setting on, the color of the line, its thickness, and opacity can be changed according to your preferences. Here, you can also choose between a gradient and a solid line.
Step line charts in a nutshell
If you chart financial data, step line charts may help you understand values changes more correctly than other chart types.
However, they are not limited to financials — explore their other applications while developing your unique trading strategy.
For that, study TradingView indicators, drawing tools, and try practicing our Paper Trading — all to see if your analysis works. You may then want to adjust it and implement other trading tools — and we encourage you doing so.
Also read: