1000000MOG: Is This the Last Chance to Buy Before a Breakout?The Moment of Decision: 1000000MOGUSDT at a Pivotal Crossroad
The crypto market is never short on surprises, and 1000000MOGUSDT is now in the spotlight. After tumbling 81.6% from its all-time high of $4.0531, the asset is showing signs of an imminent shift. Currently trading at $0.7458, it hovers near key resistance at $0.7693—a critical level that could define its next big move.
Technically, RSI (14) sits at 42.18, hinting at a potential reversal from oversold conditions. Meanwhile, MFI (60) has risen to 58.03, signaling increasing buying pressure. But is it enough for a breakout?
Recent VSA Buy Patterns suggest institutional accumulation, while yesterday's sell-off exhausted downward momentum. The battle between bulls and bears is heating up, and the next few sessions could set the tone for the coming weeks.
Could this be the final dip before an explosive move? Or will bears push it deeper into uncertainty? The answer lies in the price action around $0.7693—a breakout could bring a swift rally toward $0.8465 and beyond. Are you ready for what comes next?
1000000MOGUSDT Roadmap: The Pattern Trail to a Breakout
The market never moves in a straight line—it’s a battle of bulls and bears, and 1000000MOGUSDT is no exception. Let’s break down the key patterns that have shaped the recent price action, focusing only on those that played out as expected.
Feb 21, 17:00 UTC – Sell Volumes Max (Main Direction: Sell)
The heavy sell-off at $0.7875, closing at $0.7571, set the stage for a bearish move. The next pattern confirmed this sentiment, as buyers failed to regain control, pushing the price further down.
Feb 22, 18:00 UTC – VSA Sell Pattern 4 (Main Direction: Sell)
The textbook bearish setup worked like a charm. The price opened at $0.7996, attempted a push higher to $0.8191, but ultimately closed lower at $0.7870. This confirmed sellers’ dominance, setting the tone for further downside.
Feb 23, 15:00 UTC – Increased Sell Volumes (Main Direction: Sell)
Sell pressure kept building, with the price opening at $0.7823 and dropping to $0.7539. This was another clean confirmation that sellers were running the show.
Feb 24, 04:00 UTC – Sell Volumes Max (Main Direction: Sell)
Another bearish wave sent the price down to $0.7429, hitting a low of $0.7350. At this point, the market was looking oversold, but without a strong reversal pattern, buyers had no reason to step in.
Feb 24, 05:00 UTC – Sell Volumes Take Over (Main Direction: Buy)
Finally, a shift. The market bounced from $0.7383 to $0.7663, marking the first real attempt by buyers to flip the script. This pattern suggested a potential trend reversal—but was it enough?
The verdict? The last confirmed buy signal indicates that 1000000MOGUSDT may have hit a local bottom. With resistance looming at $0.7693, a breakout above this level could trigger a trend reversal, bringing bulls back into the game.
Technical & Price Action Analysis
When it comes to 1000000MOGUSDT, the game is all about key levels. Respect them, and you ride the wave. Ignore them, and you're swimming against the current. Here's what matters right now:
Resistance Levels:
$0.7693 – First major barrier; a breakout here could confirm bullish strength.
$0.8465 – If buyers take control, this is the next checkpoint.
$1.0149 – A key psychological level, marking a major shift in momentum.
$1.4334 – If we get here, expect serious volatility.
$1.9514 – The final boss before reclaiming lost highs.
Powerful Resistance Levels:
$0.5326 – If the market tanks, this level flips to a strong resistance on any rebound attempt.
Support Levels:
Watch for potential bounces, but if these levels don’t hold, they turn into resistance real quick.
Powerful Support Levels:
$2.1798 – A level too far now, but if we ever reclaim it, the game changes entirely.
Bottom line: if $0.7693 gives way, $0.8465 is on the radar. But if we break down, $0.5326 could become a serious problem for any recovery. Stay sharp, follow the levels, and trade with conviction.
Trading Strategies Using Rays: Optimistic & Pessimistic Scenarios
Concept of Rays: The market is a living system, and price moves dynamically within it. My proprietary method uses Fibonacci-based rays, which create adaptive levels that predict interactions between price and key zones. These rays don’t provide a static price target but act as guides—once price interacts with a ray, we wait for dynamic confirmations (patterns, volumes, and price action) before making a trade. Each movement extends from one ray to another, forming a structured, mathematically predictable path.
Optimistic Scenario: Bullish Movement from Support
If price confirms support at a key level and interacts positively with a VSA ray, we look for a continuation upward:
Entry: Buy on a strong bounce from $0.7458 with confirmation from VSA patterns.
First Target: $0.7693 (first major resistance & ray intersection).
Second Target: $0.8465 (continuation if the first breakout holds).
Third Target: $1.0149 (strong psychological level, potential liquidity grab).
Dynamic Factors Supporting the Trade:
Moving Averages (MA50: 0.783, MA100: 0.7757, MA200: 0.7807) act as additional resistance points—watch for price interaction at these levels before continuation.
RSI (42.18) is still in a neutral zone but could flip bullish if price holds above MA100.
MFI (58.03) suggests growing demand, adding strength to a breakout.
Pessimistic Scenario: Bearish Breakdown Below Support
If price fails to hold key levels, sellers regain control, and we shift to a shorting mindset:
Entry: Short after rejection from $0.7693, confirming downward momentum.
First Target: $0.7458 (previous support turned resistance).
Second Target: $0.5326 (historical powerful resistance that could flip to strong support).
Third Target: $0.4999 (absolute low, potential liquidity hunt).
Dynamic Factors Confirming the Short Trade:
Failure to break MA100 and MA200 signals continued bearish trend.
RSI below 40 would confirm oversold conditions, increasing downside pressure.
If volume spikes on a breakdown, it suggests institutional distribution rather than weak hands selling.
Key Trading Playbook
Buy on confirmed interaction with a bullish ray at $0.7458, ride to $0.7693.
Sell if price rejects $0.7693 with weak volume—target $0.7458 or $0.5326.
Breakout trade: If $0.8465 is taken out with momentum, next stop is $1.0149.
Short if price collapses under $0.7458, aiming for $0.5326.
Bottom line: Every move starts with a ray and follows a ray. Let the price confirm the interaction, then ride the wave.
Call to Action: Let’s Talk Trading!
Alright, traders, now it’s your move! 🚀 If you have questions, insights, or just want to discuss the setup, drop a comment below—I read everything and respond when I can. Let’s break this market down together!
🔥 Hit that Boost and save this post to check back later—watch how price respects the levels and rays in real time. Trading is all about understanding key reaction zones, and if my analysis helps you see them clearer, that’s already a win.
My ray-based strategy automatically plots all key levels based on price action and Fibonacci principles. It’s available only in Private, but if you’re interested in using it, send me a direct message, and we’ll talk.
Need analysis on another asset? No problem. Some things I post publicly, others—if you prefer—stay private. Just let me know what you’re looking for, and we’ll figure it out.
My rays work on any asset, and price moves according to them—it’s just how the market flows. If you have a specific ticker you want mapped out, Boost this post and drop it in the comments—I’ll get to it as time allows.
And don’t forget to follow me here on TradingView—this is where I post my setups, updates, and market insights. Let’s trade smart. See you in the comments! 📈🔥
1000000MOGUSDT.P trade ideas

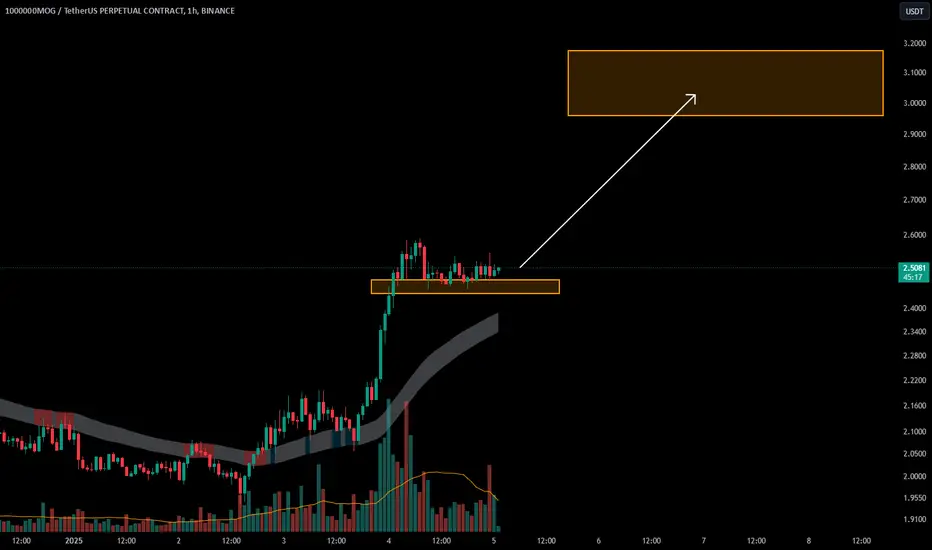
1000000MOG/USDTKey Level Zone : 2.440-2.4750
HMT v3.1 detected. The setup looks promising, supported by a previous upward/downward trend with increasing volume and momentum, presenting an excellent reward-to-risk opportunity.
HMT (High Momentum Trending):
HMT is based on trend, momentum, volume, and market structure across multiple timeframes. It highlights setups with strong potential for upward movement and higher rewards.
Whenever I spot a signal for my own trading, I’ll share it. Please note that conducting a comprehensive analysis on a single timeframe chart can be quite challenging and sometimes confusing. I appreciate your understanding of the effort involved.
Important Note :
Role of Key Levels:
- These zones are critical for analyzing price trends. If the key level zone holds, the price may continue trending in the expected direction. However, momentum may increase or decrease based on subsequent patterns.
- Breakouts: If the key level zone breaks, it signals a stop-out. For reversal traders, this presents an opportunity to consider switching direction, as the price often retests these zones, which may act as strong support-turned-resistance (or vice versa).
My Trading Rules
Risk Management
- Maximum risk per trade: 2.5%.
- Leverage: 5x.
Exit Strategy
Profit-Taking:
- Sell at least 70% on the 3rd wave up (LTF Wave 5).
- Typically, sell 50% during a high-volume spike.
- Adjust stop-loss to breakeven once the trade achieves a 1.5:1 reward-to-risk ratio.
- If the market shows signs of losing momentum or divergence, ill will exit at breakeven.
The market is highly dynamic and constantly changing. HMT signals and target profit (TP) levels are based on the current price and movement, but market conditions can shift instantly, so it is crucial to remain adaptable and follow the market's movement.
If you find this signal/analysis meaningful, kindly like and share it.
Thank you for your support~
Sharing this with love!
HMT v2.0:
- Major update to the Momentum indicator
- Reduced false signals from inaccurate momentum detection
- New screener with improved accuracy and fewer signals
HMT v3.0:
- Added liquidity factor to enhance trend continuation
- Improved potential for momentum-based plays
- Increased winning probability by reducing entries during peaks
HMT v3.1:
- Enhanced entry confirmation for improved reward-to-risk ratios
MOG/USDT 50% PROFIT POTENTIAL TRADE SETUP!!Hey everyone!
If you're enjoying this analysis, a thumbs up and follow would be greatly appreciated!
MOG/USDT looks good here. Holding the support very well and forming an ascending channel. You can long some here and add more in the dip.
Entry range:- $1.54-$1.62
Targets:- $1.86/$2.04/$2.24/$2.44
SL:- $1.46
Lev:- 5x
What are your thoughts on MOG's current price action? Do you see a bullish pattern? Share your analysis in the comments below!
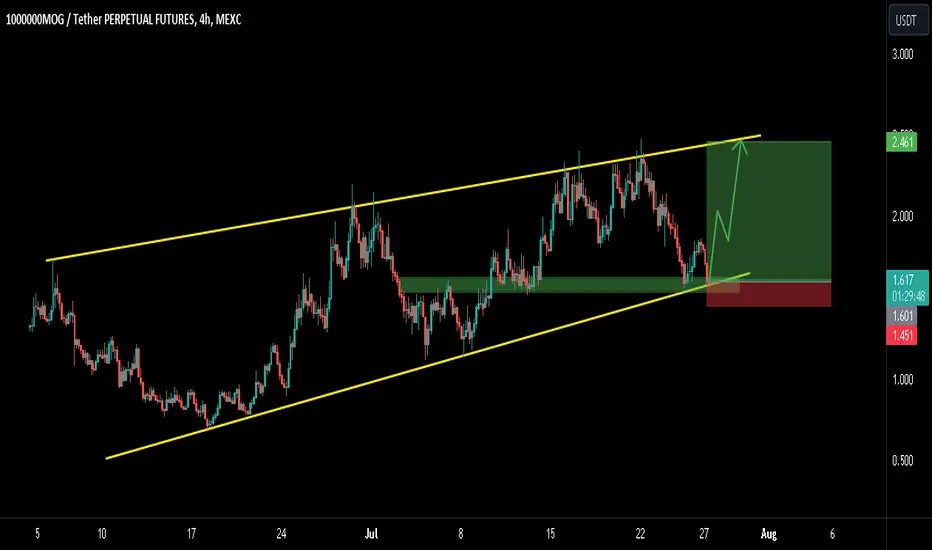
1000000MOG Trade Setup#MOG is currently at the support ranging between $1.508 to $1.573. The price must hold this support and rebound. However, a further breakdown could get worse for MOG.
Entry range: $1.508 to CMP.
SL: $1.39.
Targets: $1.805, $1.953, $2.152, 2.453.
Leverage: 3x to 5x
Not Financial Advice.
Trade safely.
#Crypto
