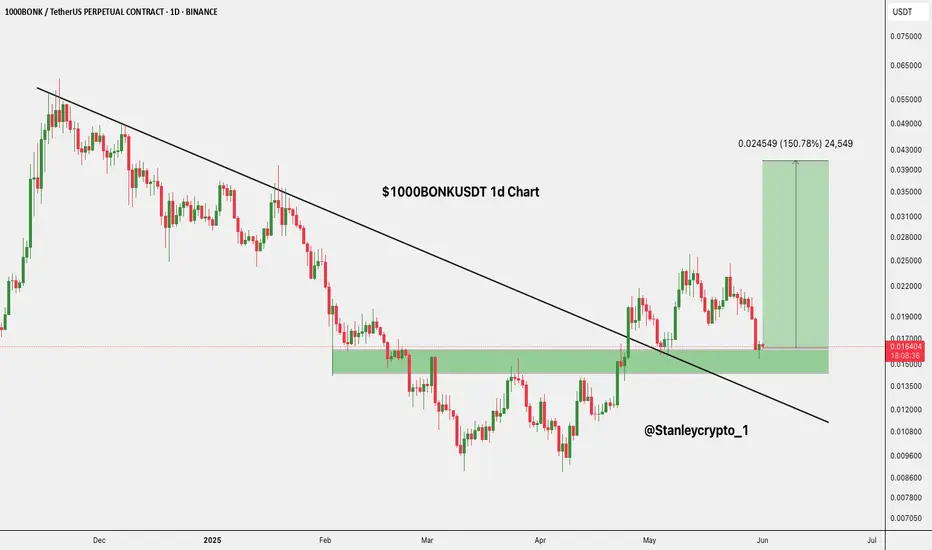
$BONK Breakout ConfirmedSEED_DONKEYDAN_MARKET_CAP:BONK Breakout Confirmed
The $1000BONKUSDT 1D chart shows a breakout from a long-term downtrend followed by a successful retest of the key support zone around $0.016390.
This area, previously resistant, is now acting as strong support.
If it holds, BONK could rally up
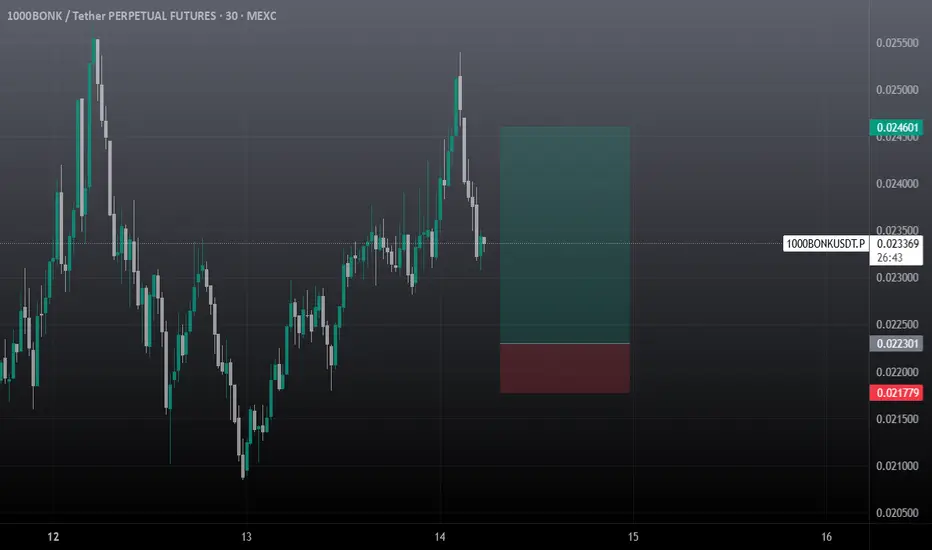
1000Bonk Day Trading SetupIf you see price starts consolidation at the poi, or see any 5m big green candle then enter with proper SL, will update trade should be closed or not.
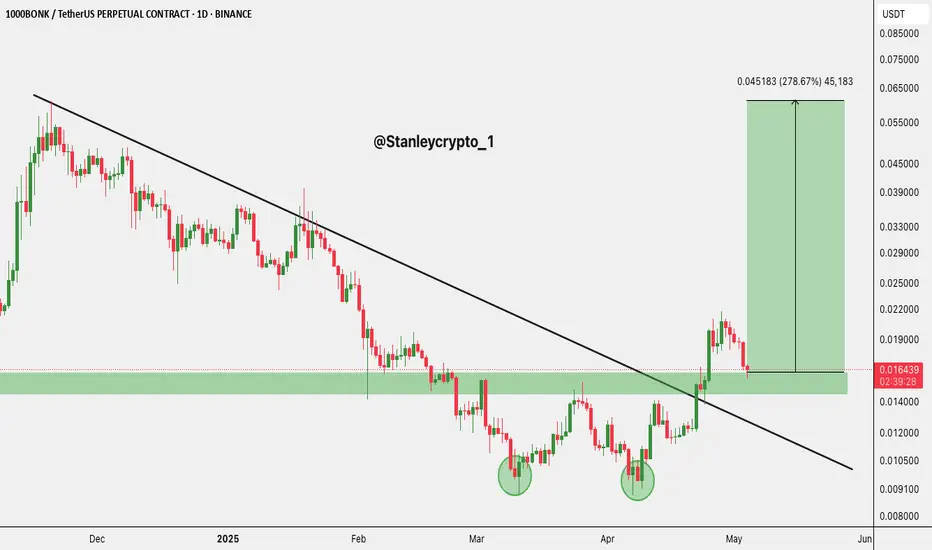
$BONK just broke out SEED_DONKEYDAN_MARKET_CAP:BONK just broke out of a long downtrend after a double bottom
- Retesting support at $0.016 holding strong.
- Target: $0.061 (+278%)
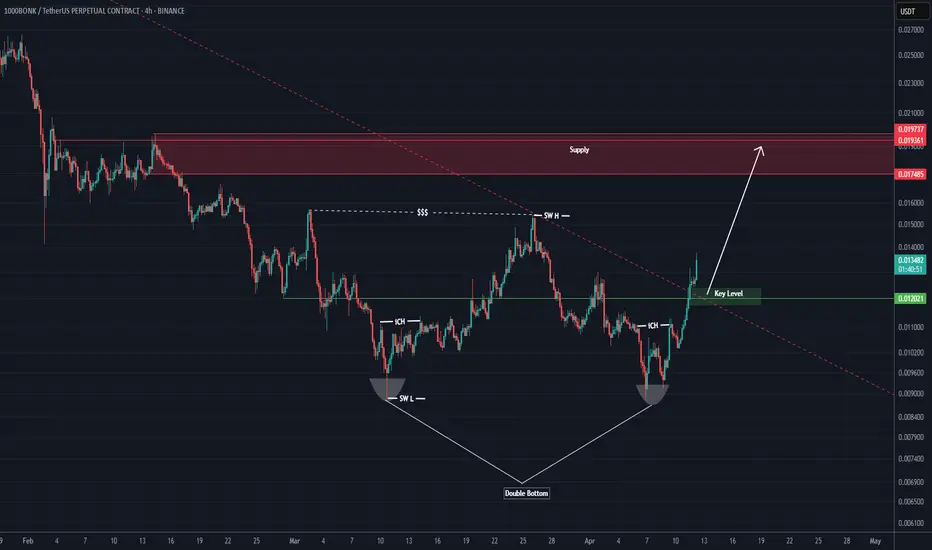
BONKE Set to Surge: Big Pump Incoming! (12H)At the top of the chart, there is a liquidity pool that is expected to be swept soon.
There are two bullish iCHs visible on the chart, along with a double bottom pattern. The descending trendline has also been broken.
If the Key Level support holds, the price could move toward the red box area.
A
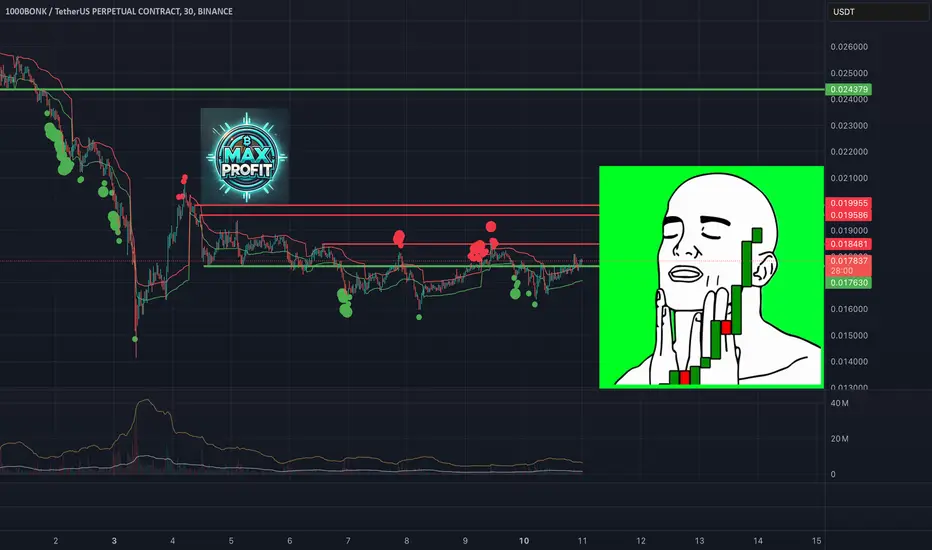
1000BONKUSDT: Ready for a Breakout?
🔥 **1000BONKUSDT.P** has been consolidating under resistance for a long time, accumulating liquidity. The price has tested **0.017630 USDT** multiple times, and whales are clearly building positions. The question is: will we see a breakout, or will there be another dip before the pump?
---
🔑
Bonk will go bonkers nextRemember to be careful. BTC should have broken the resistance by now. as time goes on we are slowly going from bullish to bearish.
Good luck

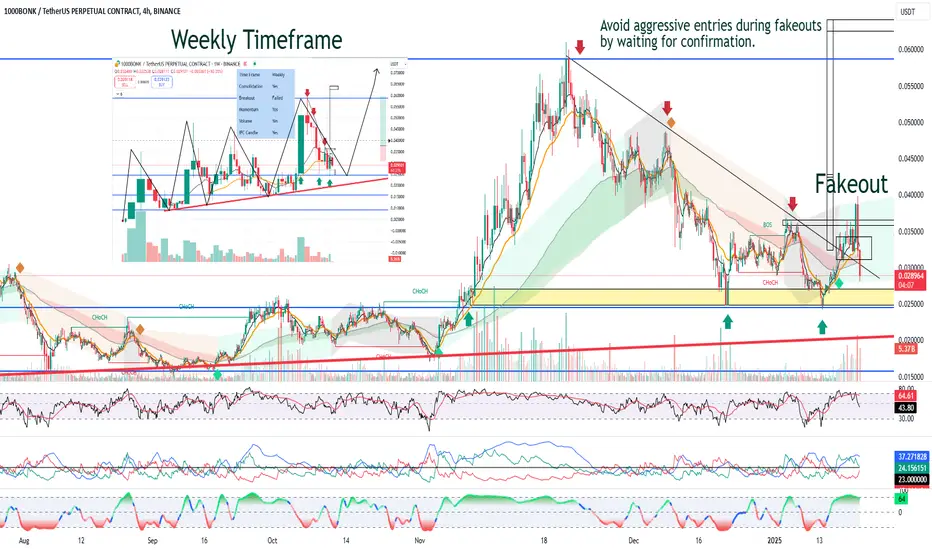
Identifying Fakeouts and Enhancing Risk Management in TradingEducational Purpose:
This tutorial aims to educate traders on identifying fakeouts, understanding their characteristics, and improving risk management strategies to avoid common pitfalls.
Key Educational Points:
1. What is a Fakeout?
A fakeout occurs when the price temporarily breaks a key support
BONK/USDT - 4-Hour Volume Footprint Chart AnalysisVolume Footprint Insights:
Delta Analysis:
Dominant positive deltas (+269M, +70M) signal aggressive buying during recent moves.
Volume spikes in consolidation (4.37B total) suggest the market is preparing for a significant move.
Liquidity Zones:
Demand Cluster: 0.032–0.033 USDT.
Minor Resistance: 0.

BONK/USDT - 4-Hour Volume Footprint Chart Analysis1. Price Action:
Trend Shift: Clear breakout from a descending trendline; higher lows are forming.
Consolidation Zone: Price is currently consolidating between 0.032–0.036 USDT, which is critical for the next move.
Support & Resistance:
Strong support at 0.026 USDT.
Resistance at 0.036 USDT, with t

Comprehensive BONK/USDT AnalysisKey Observations
Price Action:
Breakout from a downtrend; consolidating at 0.032–0.036 USDT.
Support: 0.026 USDT. Resistance: 0.036 USDT, then 0.045–0.050 USDT.
Volume Footprint:
Positive deltas (+269M, +70M) indicate strong buying pressure.
Volume spike near 4.37B signals market readiness for

See all ideas
Summarizing what the indicators are suggesting.
Oscillators
Neutral
SellBuy
Strong sellStrong buy
Strong sellSellNeutralBuyStrong buy
Oscillators
Neutral
SellBuy
Strong sellStrong buy
Strong sellSellNeutralBuyStrong buy
Summary
Neutral
SellBuy
Strong sellStrong buy
Strong sellSellNeutralBuyStrong buy
Summary
Neutral
SellBuy
Strong sellStrong buy
Strong sellSellNeutralBuyStrong buy
Summary
Neutral
SellBuy
Strong sellStrong buy
Strong sellSellNeutralBuyStrong buy
Moving Averages
Neutral
SellBuy
Strong sellStrong buy
Strong sellSellNeutralBuyStrong buy
Moving Averages
Neutral
SellBuy
Strong sellStrong buy
Strong sellSellNeutralBuyStrong buy
Displays a symbol's price movements over previous years to identify recurring trends.