Will the rise restart? ---- BONKBONK was born in Solana. In the initial stage, it was used to airdrop to NFT holders in the ecosystem. Different from the current situation where meme is the speculation token, BONK holders have more crypto spirit. For BONK, the main pump is relying on the launch of the Solana phone. In order to encourage mobile phone sales, Solana airdropped Bonk to mobile phone users. The increase in topicality led to the increase in Bonk, which then led to an increase in mobile phone sales, and finally increased topicality. This is a classic meme marketing method.
There is another reason why we are talking about BONK today. But remember, this is just our surmise! ! ! It's no secret that DWF Labs is getting into the meme world. Neither Milady nor Floki has achieved 100% circulation, but they already have a good community. So among memes that have a good community and don't have full circulation, we find BONK. And in the following on DWF's X, we also found BONK. So, you get that. But this is all just our analysis and surmise, DYOR.
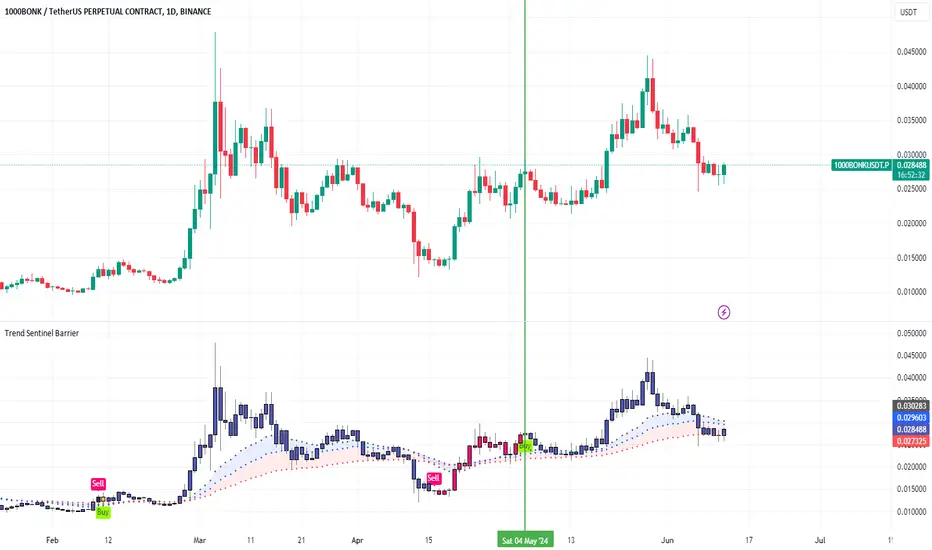
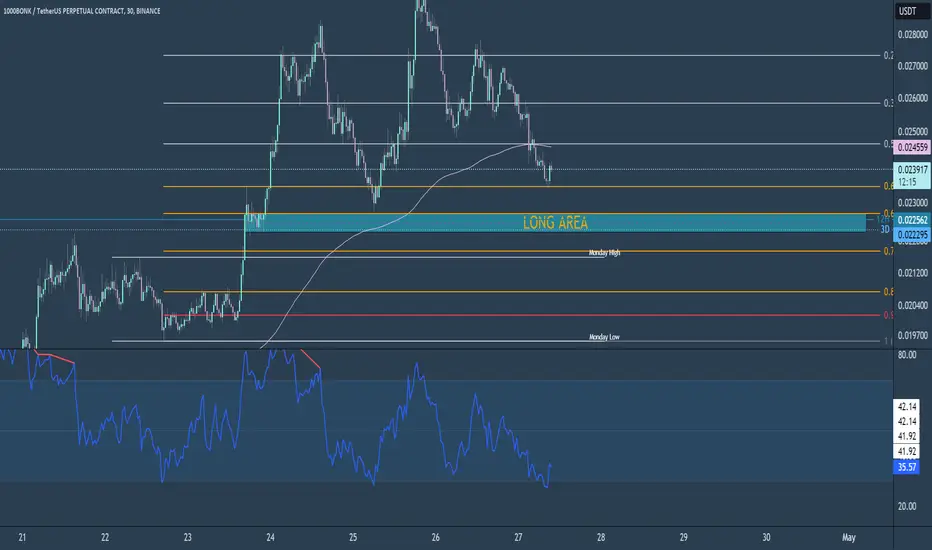
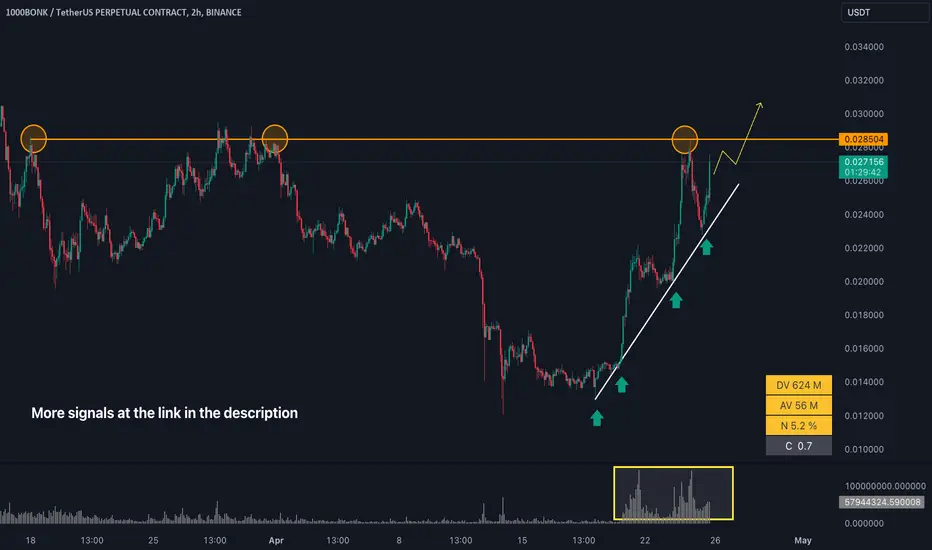
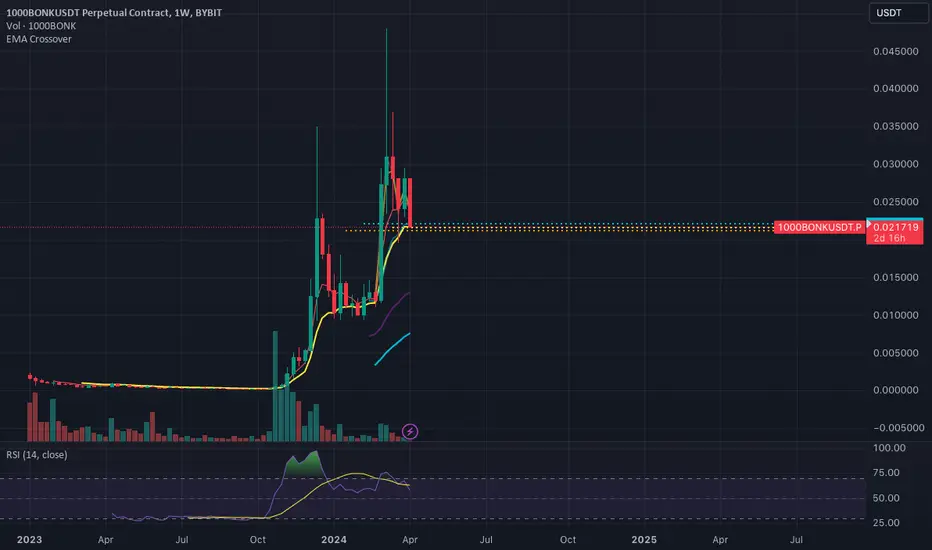
Returning to the technical level, the trend of BONK on Binance is to rise for a short time and correct for a long time. But the highs and lows are rising. We can see that on the TSB indicator, BONK is under a BUY signal. But the column has fallen back to the low rail of the wavy area. As we mentioned in the introduction to the indicator, under bullish signals, wavy areas provide support. So BONK may rebound at this position.
Introduction to indicators:
Trend Sentinel Barrier (TSB) is a trend indicator, using AI algorithm to calculate the cumulative trading volume of bulls and bears, identify trend direction and opportunities, and calculate short-term average cost in combination with changes of turnover ratio in multi-period trends, so as to grasp the profit from the trend more effectively without being cheated.
KDMM (KD Momentum Matrix) is not only a momentum indicator, but also a short-term indicator. It divides the movement of the candle into long and short term trends, as well as bullish and bearish momentum. It identifies the points where the bullish and bearish momentum increases and weakens, and effectively capture profits.
Disclaimer: Nothing in the script constitutes investment advice. The script objectively expounded the market situation and should not be construed as an offer to sell or an invitation to buy any cryptocurrencies.
Any decisions made based on the information contained in the script are your sole responsibility. Any investments made or to be made shall be with your independent analyses based on your financial situation and objectives.
1000BONKUSDT.P trade ideas
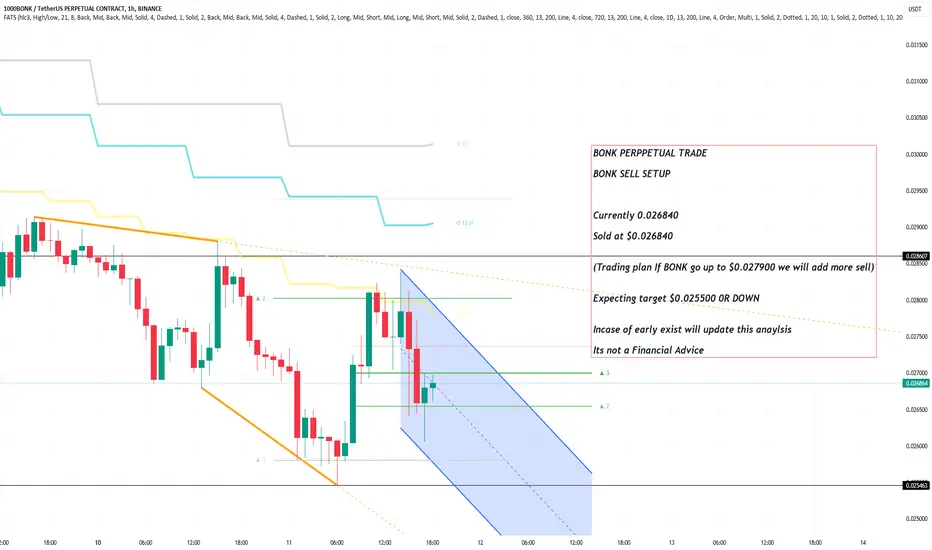
BONK SELL SETUP , Sold at $0.026840BONK PERPPETUAL TRADE
BONK SELL SETUP
Currently 0.026840
Sold at $0.026840
(Trading plan If BONK go up to $0.027900 we will add more sell)
Expecting target $0.025500 0R DOWN
Incase of early exist will update this anaylsis
Its not a Financial Advice
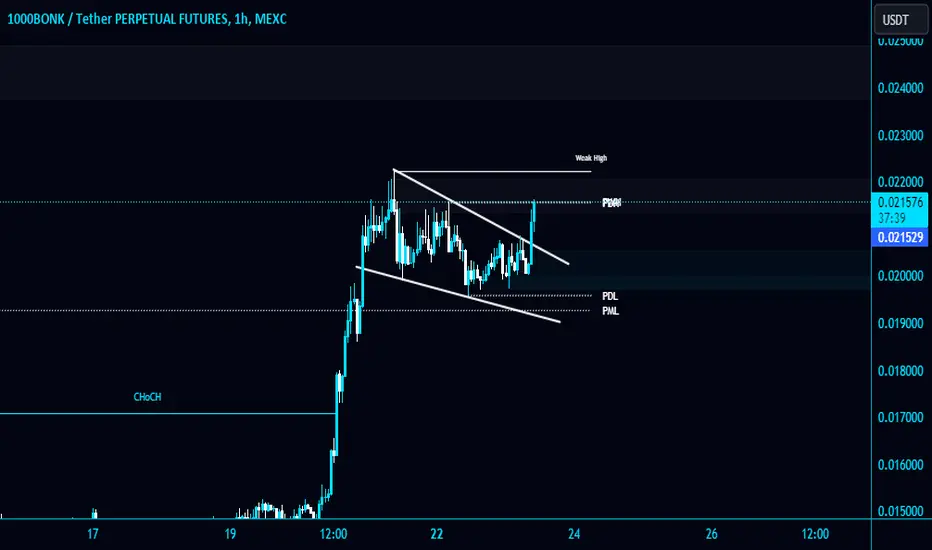
#1000BONK breaks the Diagonal Trendline in 1-Hour TF!#1000BONK breaks the Diagonal Trendline in 1-Hour TF!
SEED_DONKEYDAN_MARKET_CAP:BONK is retesting it. #BONKUSDT local resistance level is $0.029145, and the support level is $0.02725.
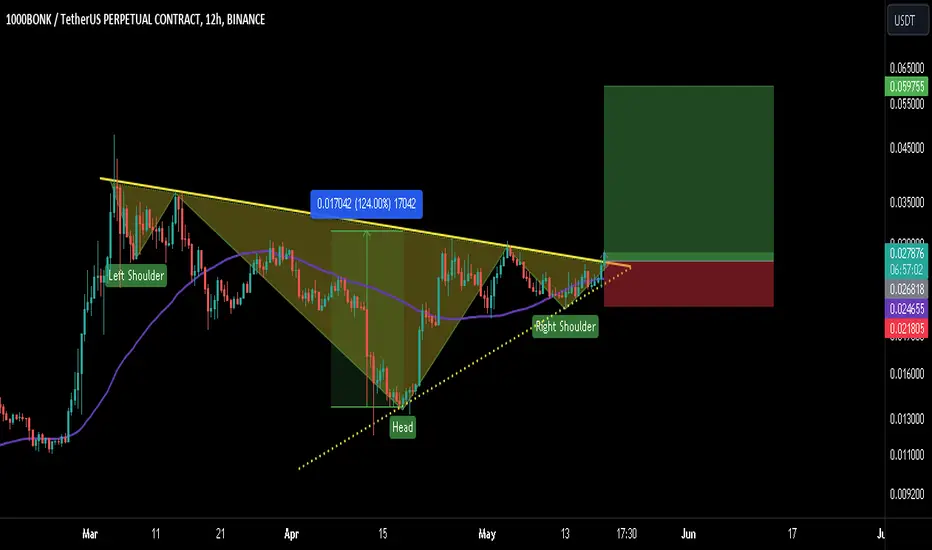
BONK/USDT LOOKS READY FOR A 100% PUMP!!Hey everyone! If you find this analysis valuable, please consider giving it a thumbs up and following for more content.
BONK is forming a potential inverse head and shoulders pattern. A confirmed breakout above the neckline could signal a significant price increase.
Here's what to watch for:
Breakout Confirmation: A candle close above the neckline strengthens the bullish case.
Volume: Higher trading volume on the breakout can increase confidence in the signal.
Possible Entry & Targets :
Entry: $0.025-$0.028
Potential Targets: $0.034, $0.042, $0.048, $0.060
Stop-Loss: $0.022 (Consider risk management strategies and set a stop-loss that suits your risk tolerance.)
Let's discuss it!
What are your thoughts on BONK's current price action? Share your analysis in the comments below!
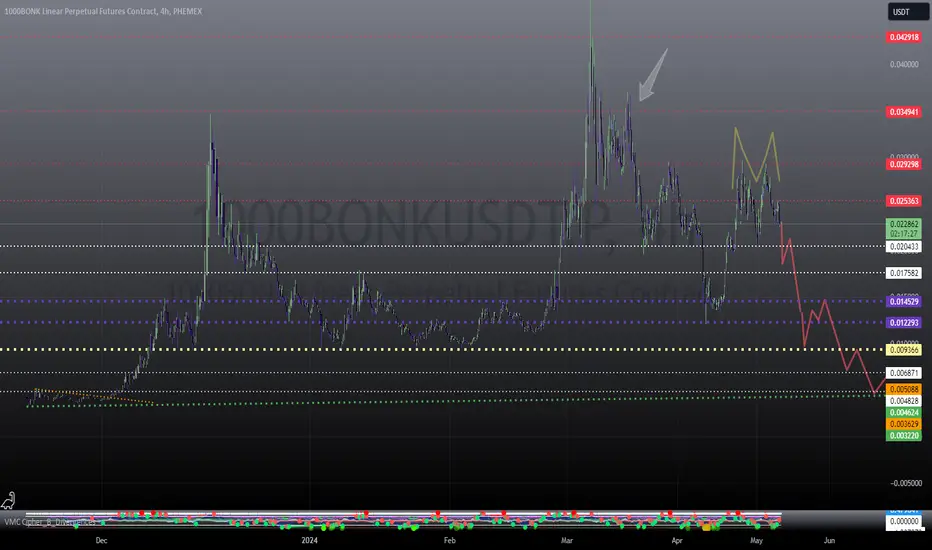
some bears have cases. idk y .. this is just an "imagine if" im just doing this so when we all lose our money in the worst wat possible then we can at least look back on this and laugh. ... weird that now i actually feel it can happen lmao
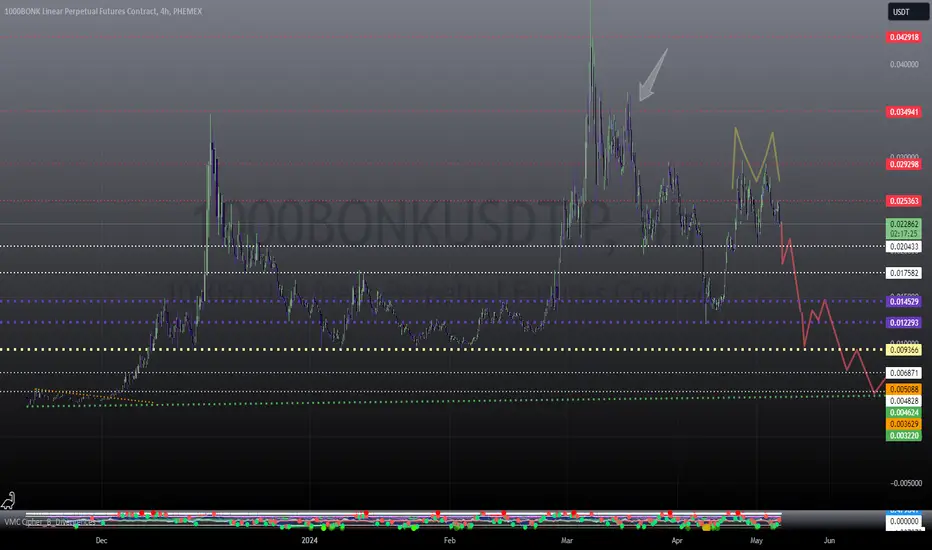
some bears have cases. idk y .. this is just an "imagine if" im just doing this so when we all lose our money in the worst wat possible then we can at least look back on this and laugh. ... weird that now i actually feel it can happen lmao
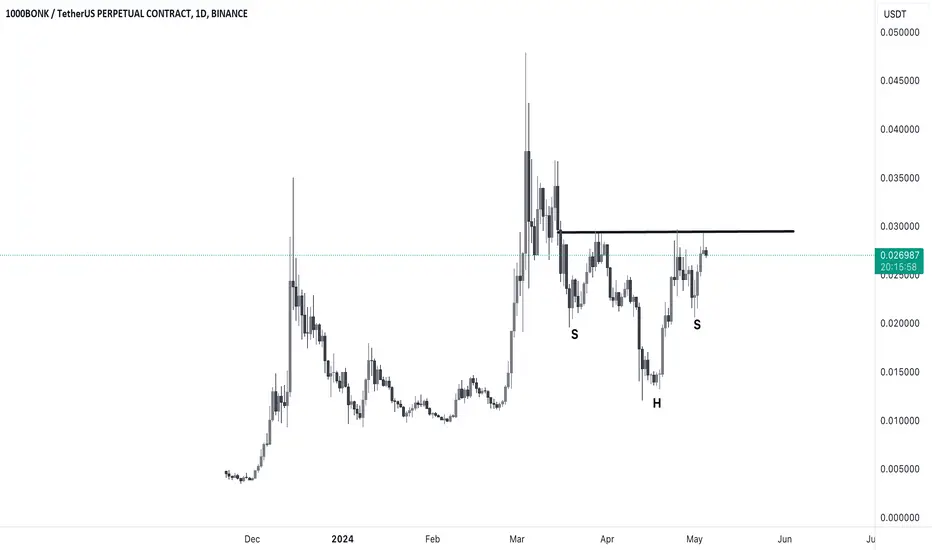
1000bonkusdtOn BonkUSDT, a head and shoulder pattern is clearly visible.
There are two ways to play this breakout: first, look for the volume for a long.
The second trade is a fake breakout, and these are typically more successful than true breakouts.
If you enjoy the content, please like and comment.
Zac
BONK LONGLONG in box
Confluence:
FIB golden pocket
D and 3D pocs
OB 1h
Additional confluence:
RSI bull div on 5m or 15min or 30min
SL manual.
I'm learning crypto, comments on idea are appreciated.
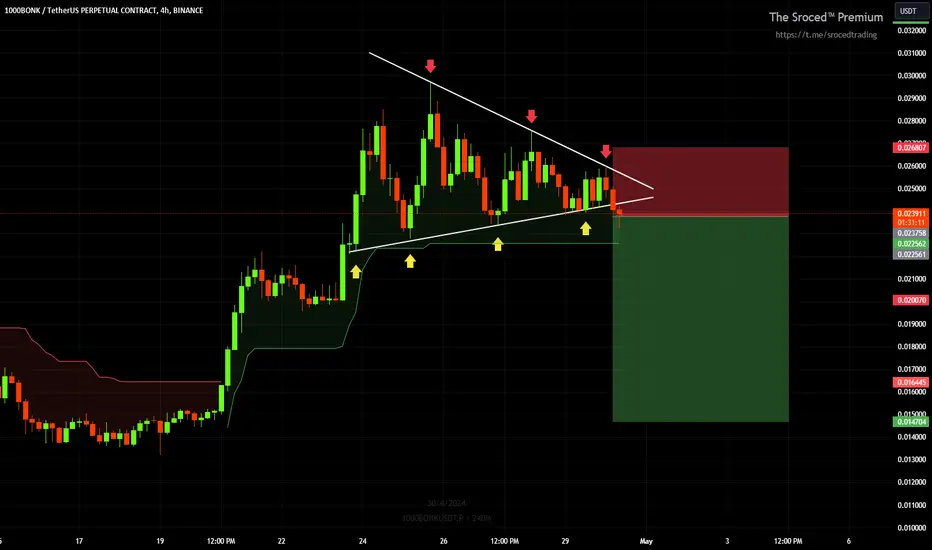
#1000BONK/USDT SHORT ENTRY#1000BONK/USDT SHORT ENTRY
Leverage: 3x
Entries: $0.023758
Take profit 1: $0.022642
Take profit 2: $0.020113
Take profit 3: $0.015185
Stop Loss: $0.026807
NOTE: This is just my prediction. Be sure to use STOPLOSS and remember that I am not a financial adviser. your money, your risk!
Thanks
The sroced. BINANCE:1000BONKUSDT.P
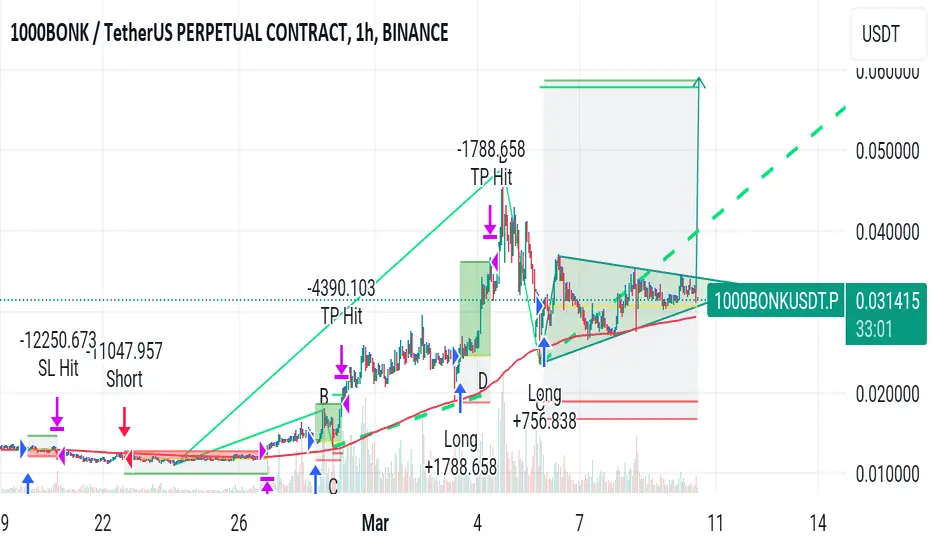
01.05 - INTRADAY TRADE - POSSIBILITY OF LONG 1000BONK USDTOne of the possibilities to enter long is this. OBVIOUSLY, I'M NOT A VIEWER AND IT MAY BE THAT THE MARKET WILL REACT OTHERWISE.
But if it reacts this way we can face a few more dollars in an trade with very positive risk and reward.
LOGIC BEHIND THE TRADE
THE MARKET MADE A FALSE CHANGE OF CHARACTER, leaving a strong order block region,i recommend to enter in this trade just if you see a CHoCH in the orderblock area.
REPEATING, this idea is for educational purposes only, I don't know how the market will react.

Bonk buy program activatedI need the two green lines zone to hold, which will trigger buy program expansion towards old high. Then RIP solana memes ✍️
1000bonk short ideaAfter returning to the previous ceiling, bonk rejected just near the 0.618 fibo. Therefore, it is expected that it will first break the bottom of 0.025 and then pull back towards the last LH. In that area, we can have a short position with a stop a little higher than the last LH.

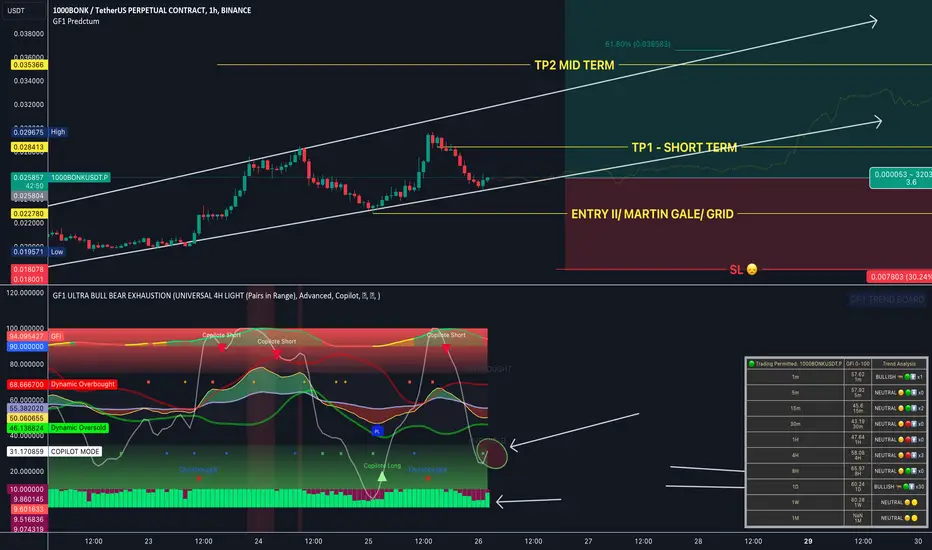
BONK SETUPDisclaimer: Before proceeding, please note that the following information is based on technical analysis and should not be construed as investment advice. Always conduct your own research and, if necessary, seek advice from a financial professional.
I've been watching this asset for a few weeks and all the manipulation has been done, by my indicators, there has just been a strong bounce on the 1-hour chart and on the longer 8-hour and 1-day charts we're bullish, one step before becoming stronger bullish, backed up by the 1-week yellow ball that is the transition to the bullish zone, in addition to the histogram showing that the bulls have gained strength at this level and the copilot oscillator being oversold.
Once again, these are solely my analyses and should not be taken as guarantees of success. The financial market is volatile, and there are always risks involved. Always be prepared and conduct your own analyses before making any investment decisions.
LONG #1000BONKUSDTLONG #1000BONKUSDT from $0.028485
2h TF. The instrument has formed a cascade of several resistance levels, behind each of which I expect to see the stops of the shorts of the participants who opened positions from them. Active compression and a local increase in volumes indicates the interest and strength of buyers.
I expect to see the formation of consolidation and an increase in activity in the glass with a tape of transactions before the breakdown of each of the levels.
#1000BONK breaking the Bullish Flag Pattern upwards in 1-Hour TF#1000BONK breaking the Bullish Flag Pattern upwards in 1-Hour TF!
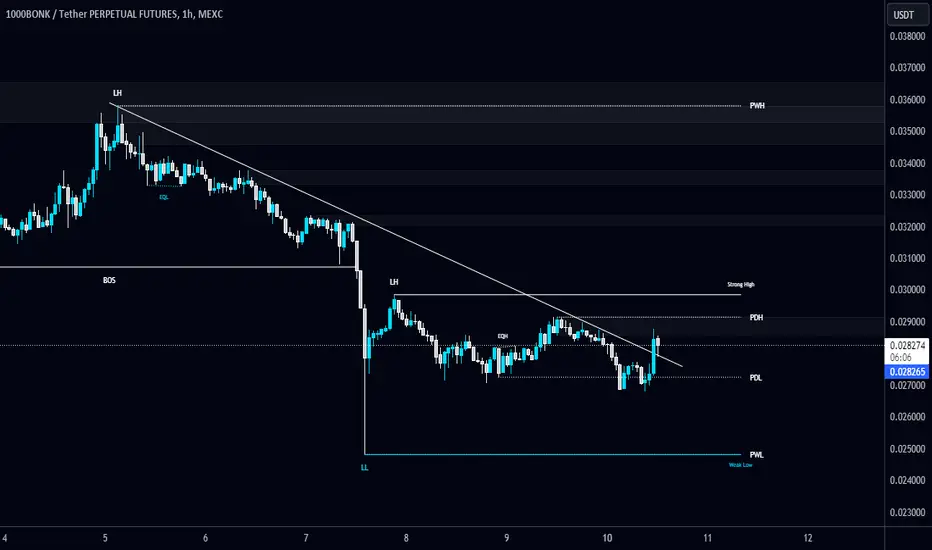
I will wait for a successful retest to Long $BONK. #BONKUSDT bounced from PML $0.019275 support level and currently testing PDH $0.0215. The next local resistance level is PWH #0.02225.
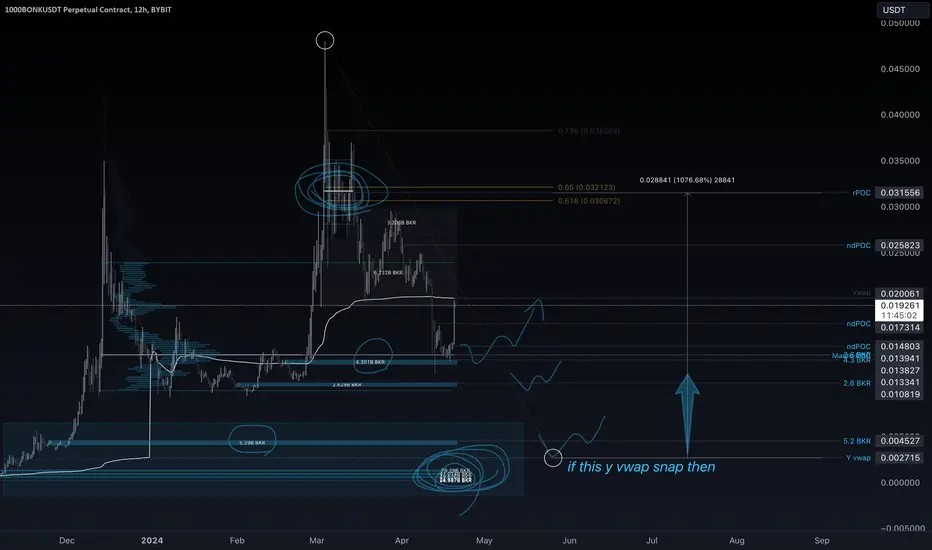
BONK - Key Levels of Support BelowIve marked out key areas below to find support.
These levels are fib 618 levels, breaker blocks with volume info, vwap yearly snap points, imbalances and Points of Control untapped. ndPOCs.
I have no idea where the market is going but "if" it goes down then these levels could be amazing supports.
look at my Total market chart for better bias as we move further.
Not Ever Financial Advice.
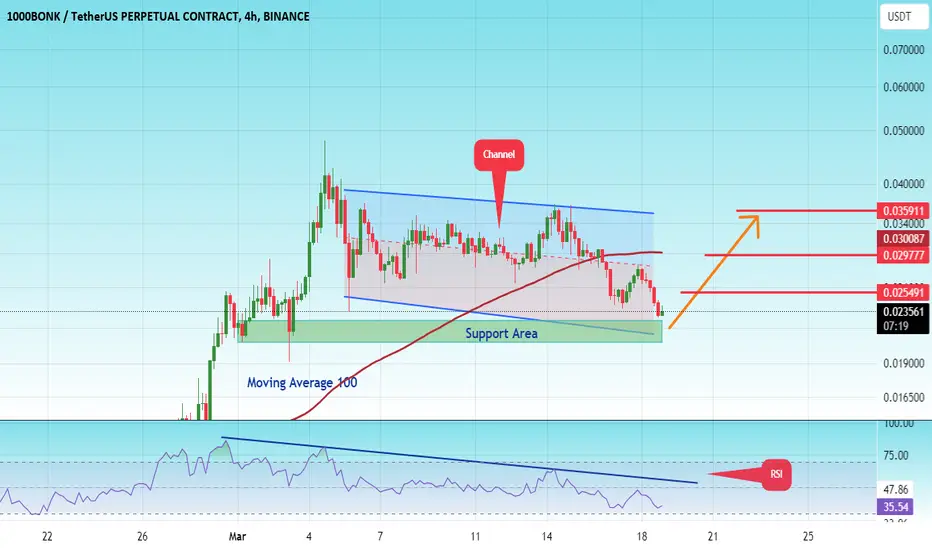
#1000BONK/USDT#1000BONK
The price is moving in an upward channel on a 4-hour frame and we have a support area in green at the level of the lower border of the channel at the price of 0.02200.
We have a trend to rise above the Moving Average 100 after breaking it down
The RSI indicator has a downtrend that is expected to be retested
Entry price is 0.02350
The first target is 0.02550
The second target is 0.03000
The third goal is 0.03600
$BONK an interesting areaWe have an interesting area between the 60 daily EMA and the 5 weekly EMA which have already shown excellent support in these BTC drops. BTC has already bounced off the 5 weekly EMA and this can only create an advantage over everything else. High risk trade with 6x leverage, I will close the position if the week closes below the 10 EMA.
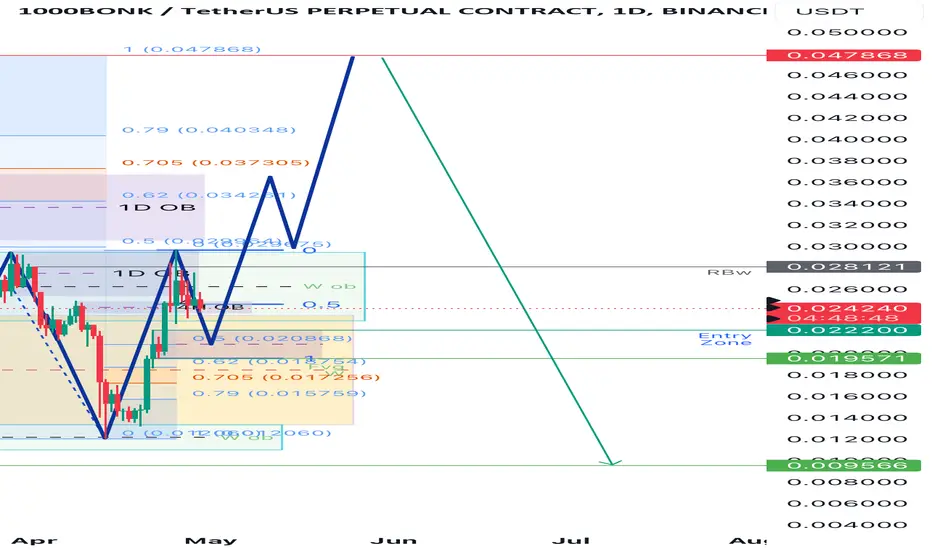
Smart Money Concept for 1000Bonk/USDT.P In the dynamic world of cryptocurrency trading, precision and foresight are paramount. Our analysis of 1000Bonk/USDT.P reveals an intriguing opportunity rooted in the Smart Money Concept (SMC), providing a roadmap for potential gains amidst market fluctuations.
Over the past day, 1000Bonk/USDT.P has surged to considerable heights, but signs indicate an impending downturn, albeit the timing remains uncertain. Leveraging the principles of SMC, we pinpoint an entry point at 0.024720. This selection aligns strategically with a 4-hour fair value gap (FVG), presenting an opportune moment to enter the market.
To mitigate risk, we implement a stop-loss (SL) at 0.023544, positioned 0.8% below the 4-hour FVG. This precautionary measure serves as a safeguard against adverse movements, preserving capital in the event of unexpected market shifts.
Our take-profit (TP) strategy is finely tuned to capitalize on market dynamics. We identify a TP level of 0.031182, strategically located at a bearish Order Block (OB). This targeted approach ensures that potential gains are maximized while maintaining a disciplined exit strategy.
Furthermore, traders are encouraged to exercise flexibility in managing their positions, with the option to scale out profits or adjust TP levels based on evolving market conditions. By integrating adaptability with strategic analysis, traders can optimize their returns and navigate the complexities of cryptocurrency trading with confidence.

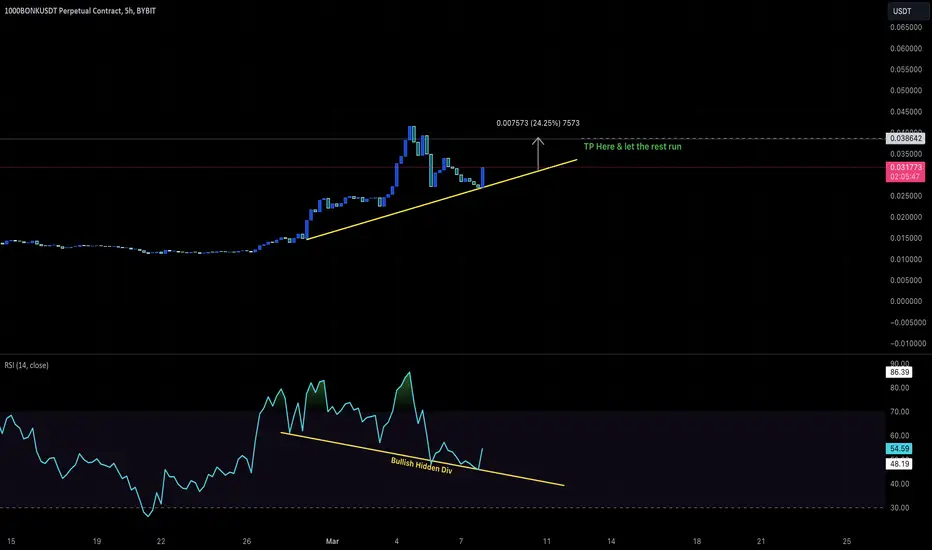
Bonk & RunHi All,
Decent Hidden Divergence here on the Bonk 5Hr, I waited for Momentum to pick up and have put in for a 25% long scalp.
Looking to TP 60% and hopefully let the rest run into new price discovery.
Cheers,
BB
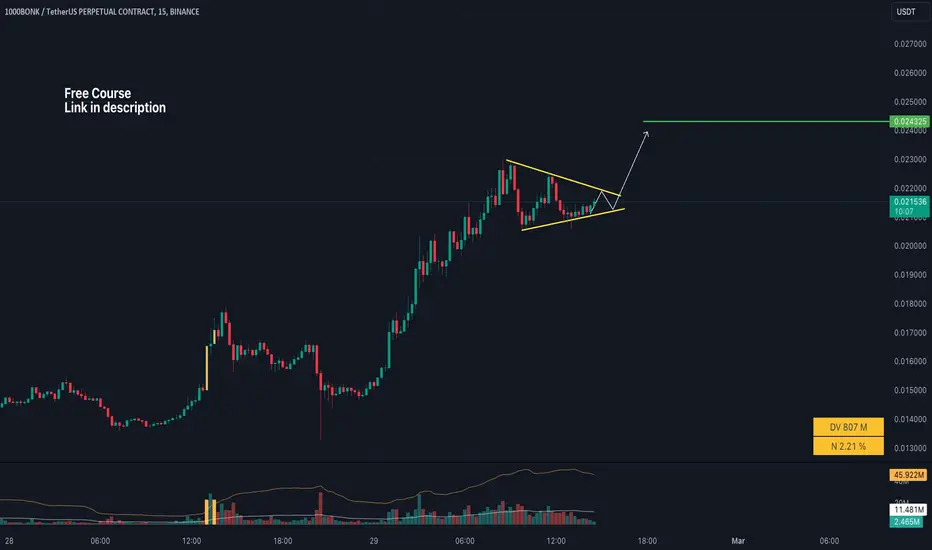
LONG #1000BONKUSDT target $0.024325LONG #1000BONKUSDT from $0.024325 stop loss $0.020553
15m TF. The coin is trading at increased volumes ($803M in 24 hours). After the rise, the price formed a triangle. They have gained a foothold above the POC level. I expect a rebound from the support level and a breakdown. The target is 0.024325
#1000BONK/USDT 8h (Binance Futures) Falling wedge breakoutBonk Inu finally regained 100EMA support, time for next bullish wave seems to have come!
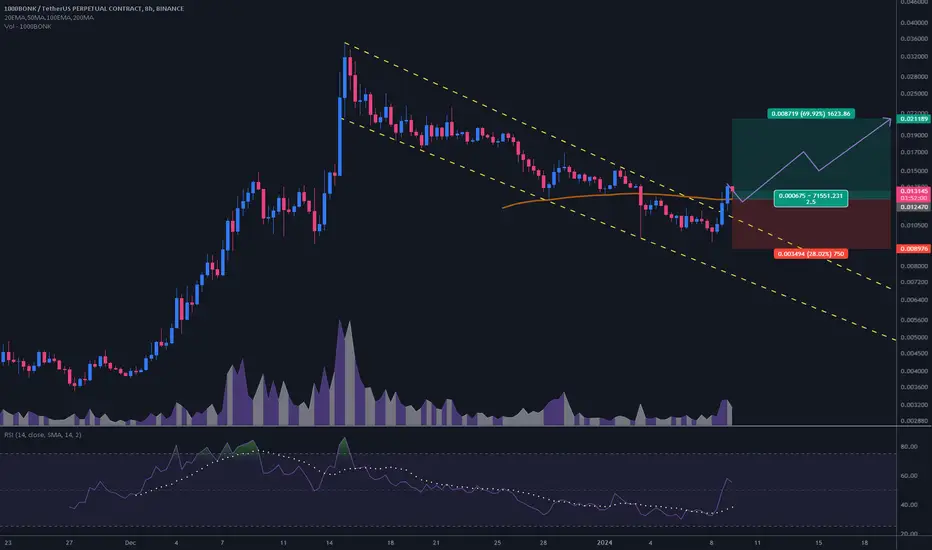
⚡️⚡️ #1000BONK/USDT ⚡️⚡️
Exchanges: Binance Futures
Signal Type: Regular (Long)
Leverage: Isolated (2.0X)
Amount: 5.4%
Current Price:
0.013145
Entry Targets:
1) 0.012470
Take-Profit Targets:
1) 0.021189
Stop Targets:
1) 0.008976
Published By: @Zblaba
$BONK BINANCE:1000BONKUSDT.P #Bonk #Meme bonkcoin.com
Risk/Reward= 1:2.5
Expected Profit= +139.8%
Possible Loss= -56.0%
Estimated Gaintime= 5-10 days