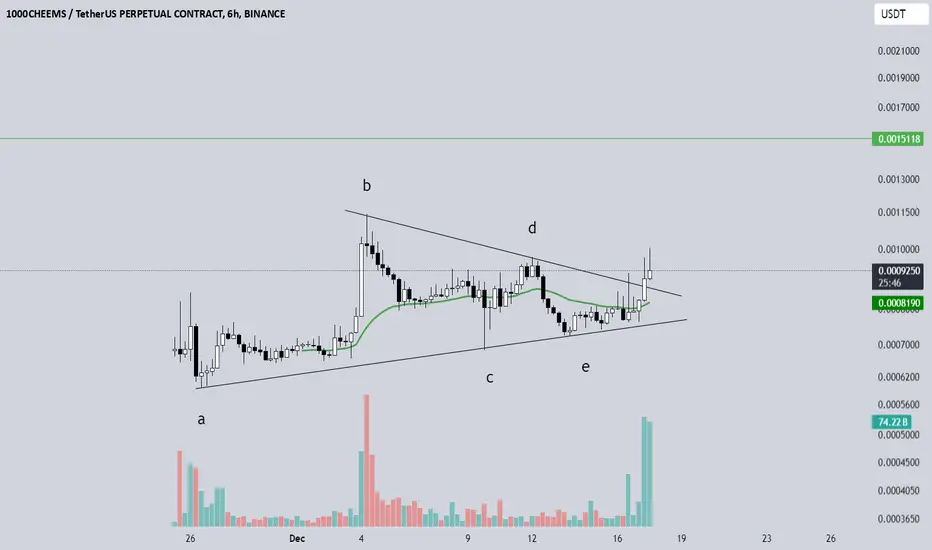
1000CHEEMS/USDT Breakout!!1000CHEEMS has been consolidating within a symmetrical triangle pattern over the past 100 days, indicating strong accumulation and decreasing volatility. Recently, price action reclaimed the key $0.014 support level and is holding firmly above it.
A confirmed breakout above the triangle resistance
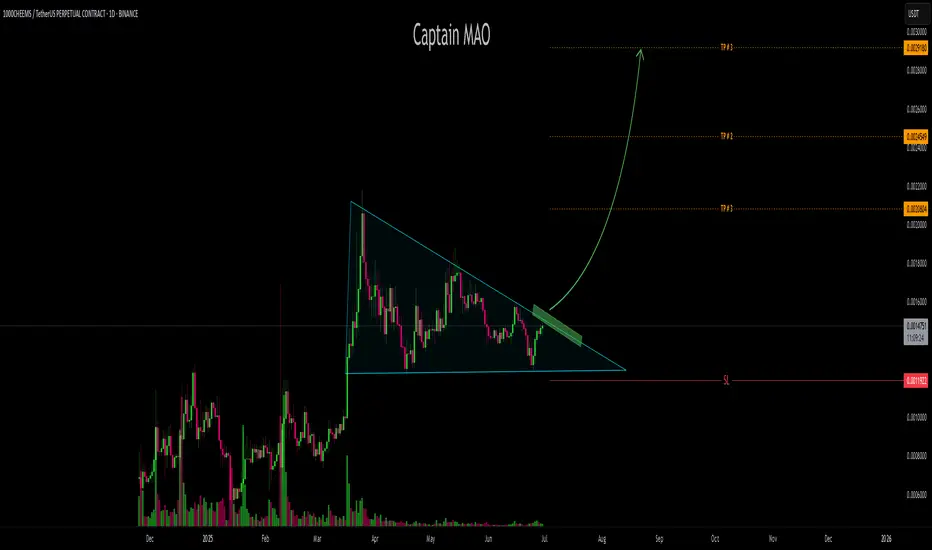
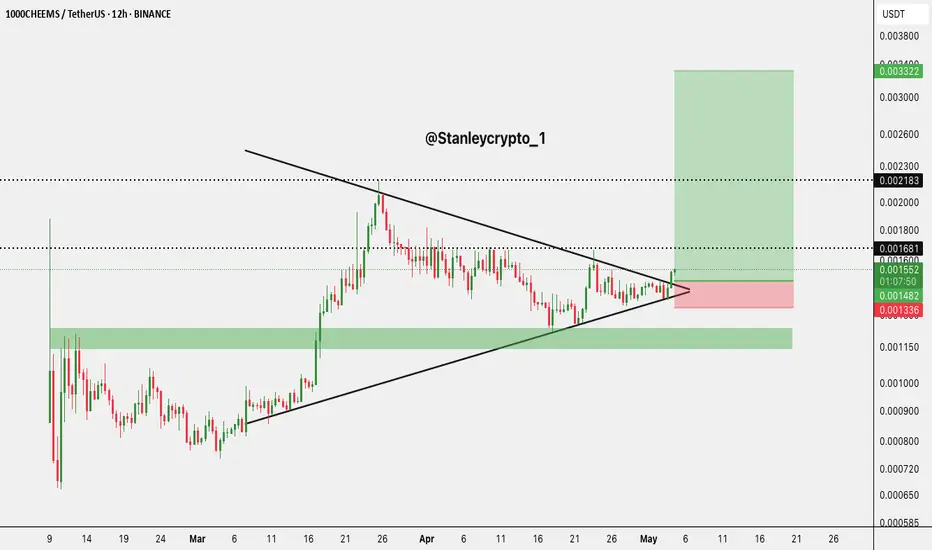
$1000CHEEMSUSDT Breakout Alert🚨 Breakout Alert! BINANCE:1000CHEEMSUSDT 🚀
Price broke out of a symmetrical triangle on the 12-hour chart, bullish confirmation in play.
- Entry: CMP
- Target 1: 0.001681
- Target 2: 0.002183
- Final Target: 0.003322
- SL: 0.001336
Volume confirmation next?
Watch closely! 👀
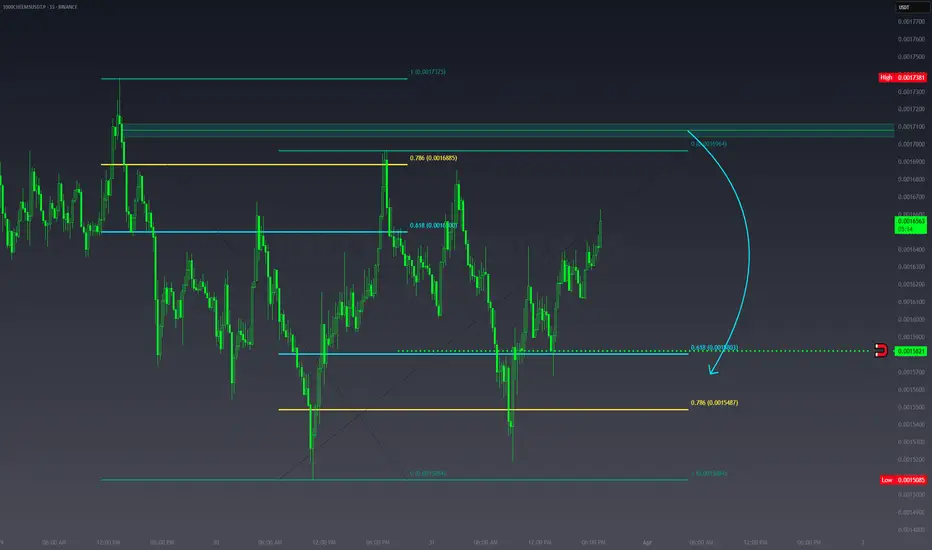
CHEEM/USDT a retracement trade idea, where price might sweep liquidity before reversing.
Fibonacci Levels:
The 0.618 (1.001600) and 0.786 (1.0016885) retracement levels are highlighted, indicating key reversal zones.
Price seems to be reacting around these areas, making them crucial for entries/exits.
Supp
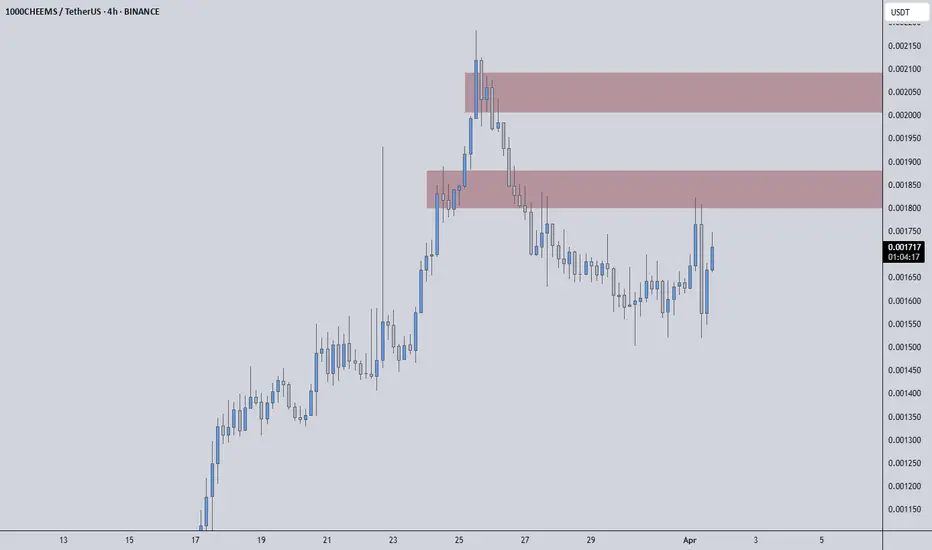
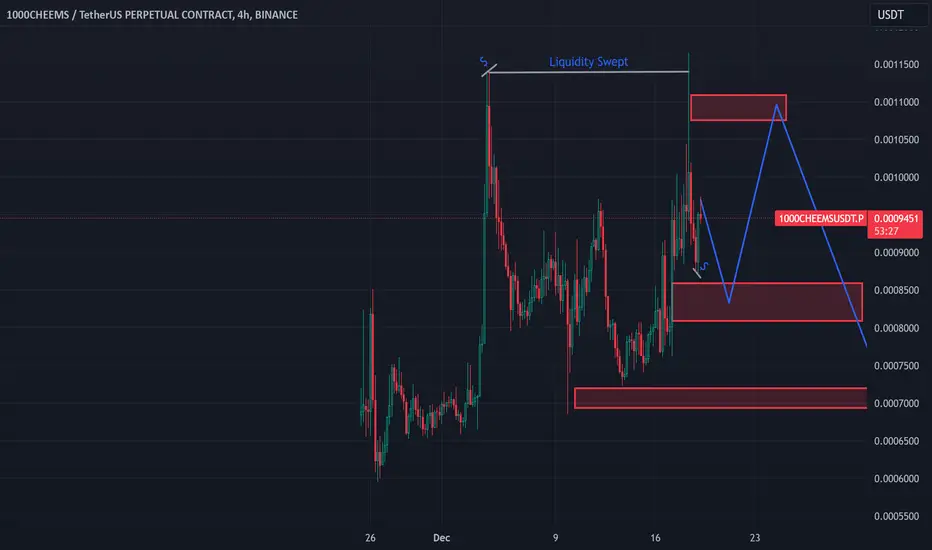
1000CHEEMSUSDT | Critical Resistance Zones – Precision Required!1000CHEEMSUSDT has hit a crucial point—the red boxes mark strong resistance zones where price reactions are highly probable. But let’s be clear: this is not a place to blindly short. Every professional trader knows that the key to success isn’t predicting, it’s reacting to confirmations.
🔴 Short Se
#1000CHEEMSUSDT is setting up for a breakout Long BINANCE:1000CHEEMSUSDT.P from $0,0014000
🛡 Stop loss $0,0013740
1h Timeframe
⚡ Plan:
➡️ POC is 0,0013254
➡️ Waiting for consolidation near resistance and increased buying activity before the breakout.
➡️ Expecting an impulsive upward move as buy orders accumulate.
🎯 TP Target

1000CHEEMSUSDT – 2500% Volume Surge!1000CHEEMSUSDT – 2500% Volume Surge! Watching the Blue Boxes Closely
“A 2500% volume increase is NOT a joke—something BIG is happening! But smart entries matter.”
🔥 Key Insights:
✅ Massive Volume Surge – This is where real moves start.
✅ Two Strong Support Zones Marked (Blue Boxes) – These are t
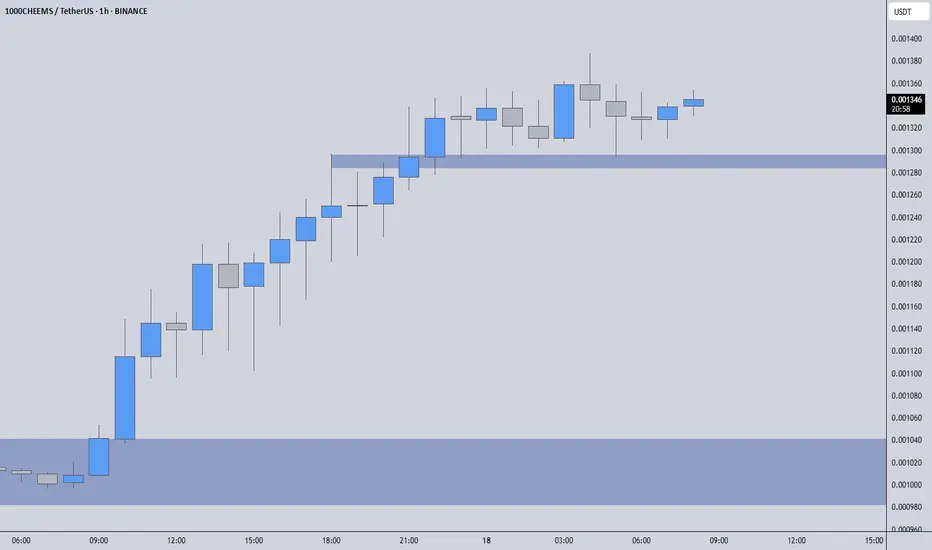
1000CHEEMS/USDTKey Level Zone : 0.0010592-0.0010722
HMT v2.0 detected. The setup looks promising, supported by a previous upward/downward trend with increasing volume and momentum, presenting an excellent reward-to-risk opportunity.
HMT (High Momentum Trending):
HMT is based on trend, momentum, volume, and marke
After a Mark-up expect a correctionWe had seen a increase on the demand in the last week.After an increase, the expectancy is that the price most likely will decline in order to correct.
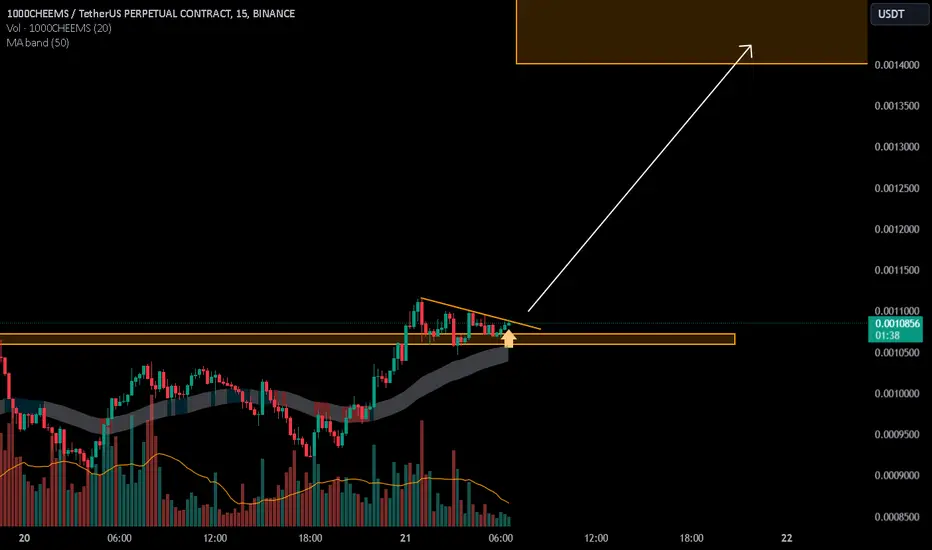
1000cheems - triangleFormed a bullish triangle, need to wait for a fix at 6 o'clock, then open a long, the main target is $0.0015
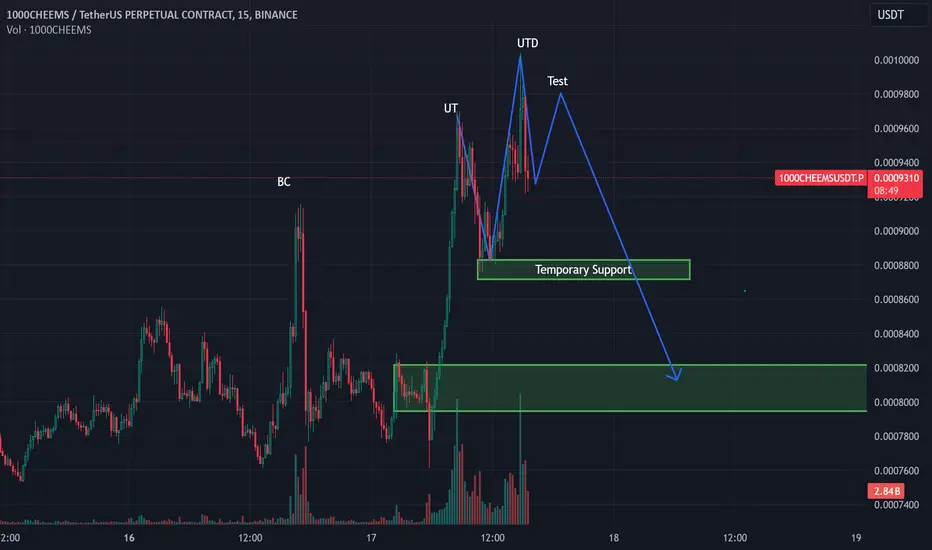
Distribution Phase We have seen a break liquidity sweep from the sellside on cheem. This breakout missed out the high rally after it.In the next hours,it will happen a test from this level, with a possible liquidity from the buyers on the 0,09 level, leading to a path to most likely get support on demand zone of 0,08
See all ideas
Summarizing what the indicators are suggesting.
Oscillators
Neutral
SellBuy
Strong sellStrong buy
Strong sellSellNeutralBuyStrong buy
Oscillators
Neutral
SellBuy
Strong sellStrong buy
Strong sellSellNeutralBuyStrong buy
Summary
Neutral
SellBuy
Strong sellStrong buy
Strong sellSellNeutralBuyStrong buy
Summary
Neutral
SellBuy
Strong sellStrong buy
Strong sellSellNeutralBuyStrong buy
Summary
Neutral
SellBuy
Strong sellStrong buy
Strong sellSellNeutralBuyStrong buy
Moving Averages
Neutral
SellBuy
Strong sellStrong buy
Strong sellSellNeutralBuyStrong buy
Moving Averages
Neutral
SellBuy
Strong sellStrong buy
Strong sellSellNeutralBuyStrong buy
Displays a symbol's price movements over previous years to identify recurring trends.