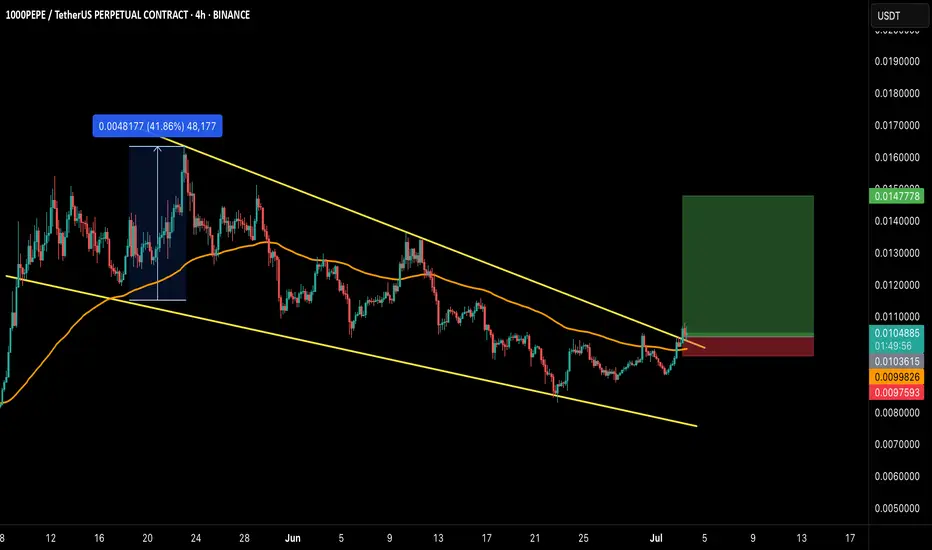
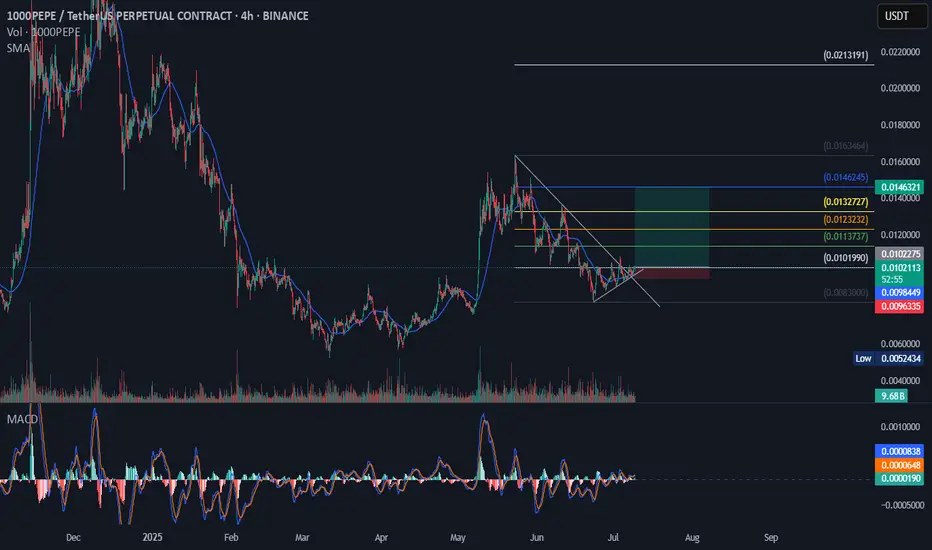
PEPE/USDT – Falling Wedge Breakout!Hey Traders — if you're into high-conviction setups with real momentum, this one’s for you.
CRYPTOCAP:PEPE has finally broken out from the falling wedge structure on the 4H chart after weeks of consolidation. This is a bullish reversal pattern that historically leads to explosive upside moves.
✅
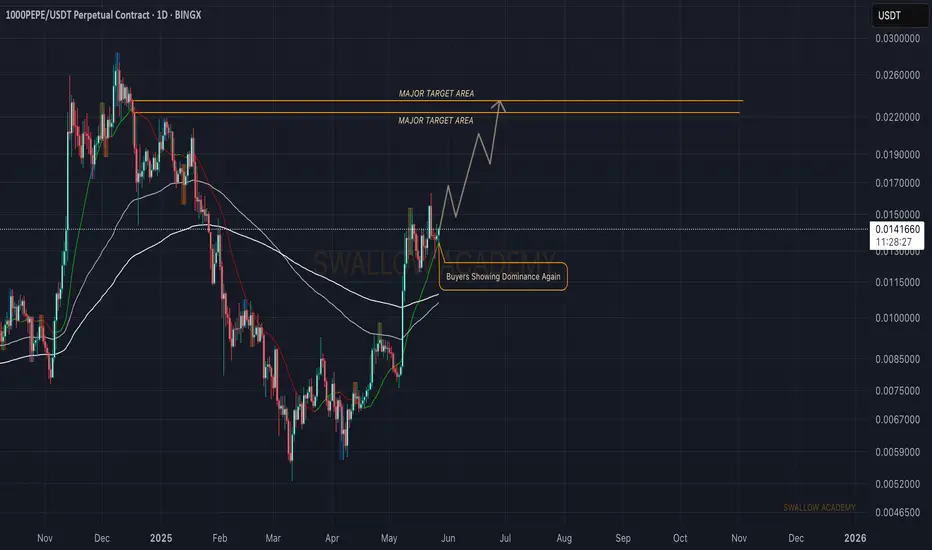
Pepe (PEPE): Buyers Are Slowly AccumulatingPepe coin seems to accumulate currently where buyers are preparing to form a new local high. With that being said we do not see any strong rejection but near 0.022 area which we will be setting as a target for us (as long as price hold the area above EMA)
Swallow Academy
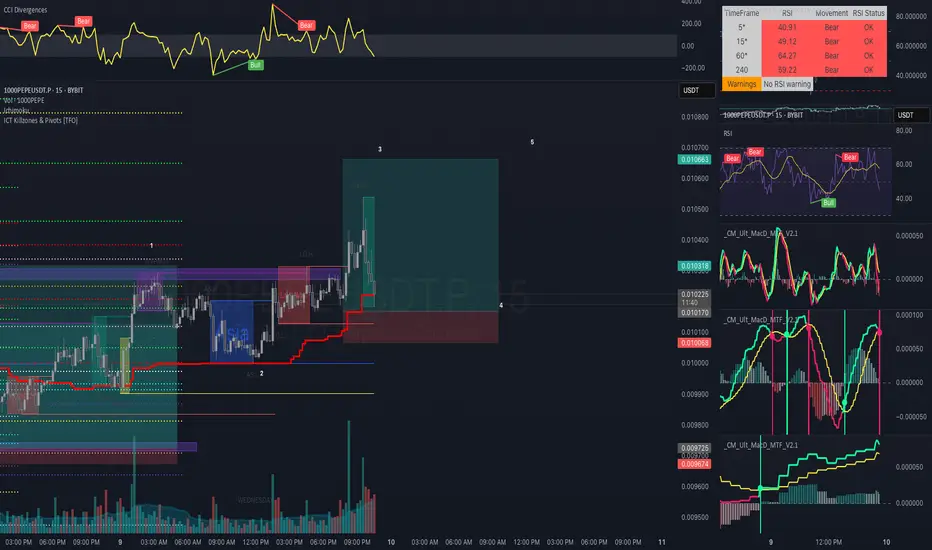
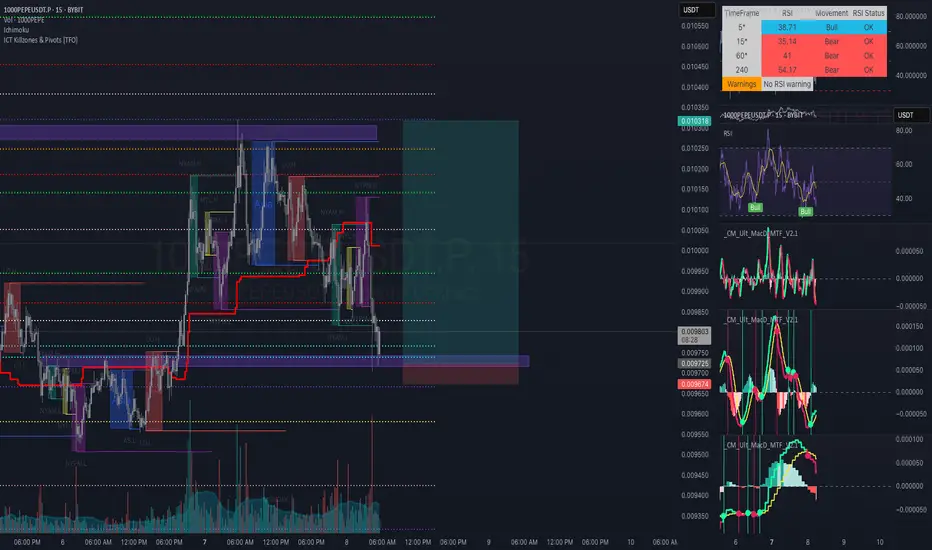
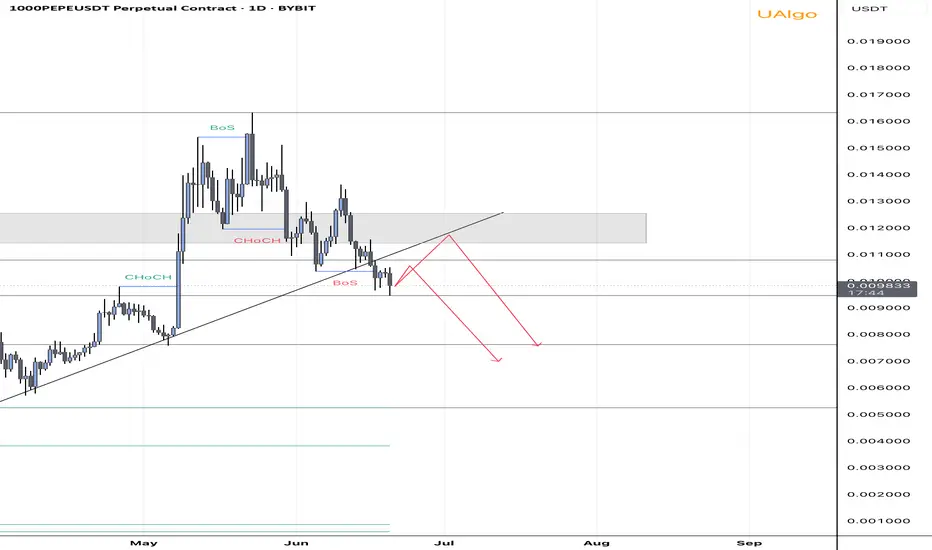
1000PEPEUDST.P LONG1000PEPEUSDT.P has broken its trendline. Time for massive longs moves!
Entry Area
.010215
SL
5-10%
TP in fib areas:
-.0113737
-.0123232
-.0132727
-.0146245
Greedy target
-.0213191
#DYOR
#TYOR
#NOT A FINANCIAL ADVICE
USE LOW LEV & MARGIN ONLY!
HAPPY TRADING!
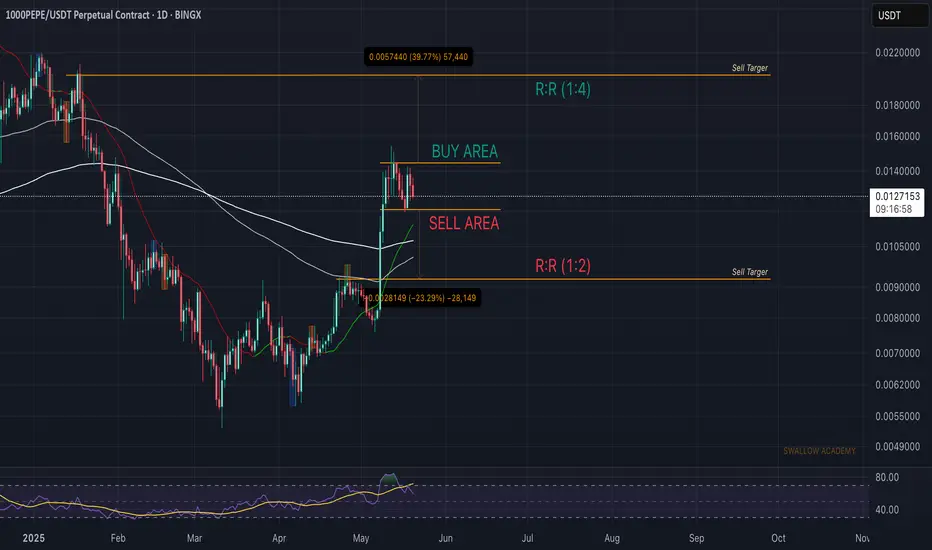
1000PEPE (PEPE): Good Risk/Reward Trades Can Be Taken | WaitPepe coin has shown us a good upward movement recently, and we are now at a pretty crucial zone. It does not matter if we see a breakout or breakdown; we are going to wait for a perfect sign in the form of a break, which would then give us either a 1:2 RR or 1:4 RR position that we can take.
Swallo
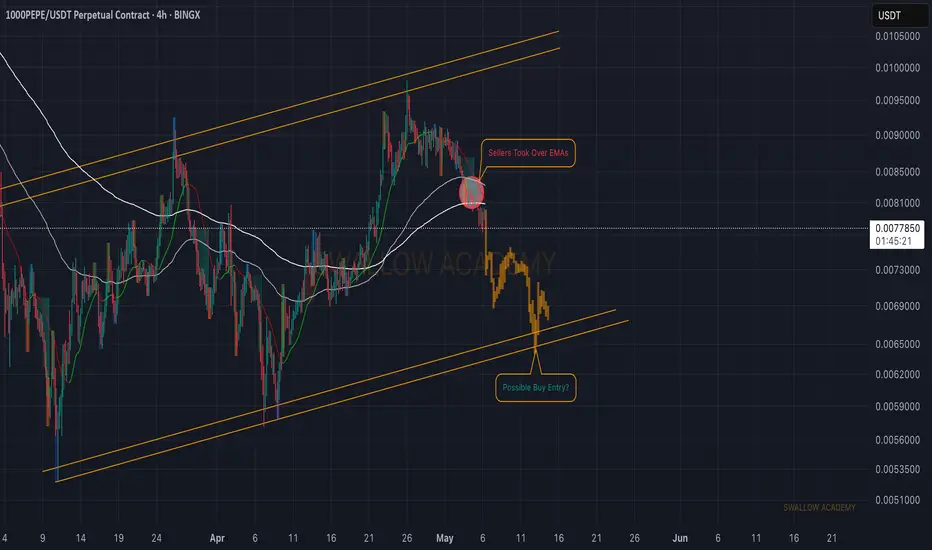
Pepe (PEPE): Strong Dominance From Sellers | Short Setup!Pepe coin has a good chance to fall where we have formed here a nice smaller bullish channel, and recently sellers had a decent rejection from the upper resistance zone, and sellers secured the EMAs.
It seems like the price is doomed to fall towards the lower zone here so as long as we are below E
1000PEPE looks good from here?I did my analysis on different times frames, On higher time frame we are bearish, Short time frame up or down is unpredictable. On as you guy can see price didn’t respect trend and breakdown’ It’s does means that 100% is goin down because we also have Fib Support may that change the market direction
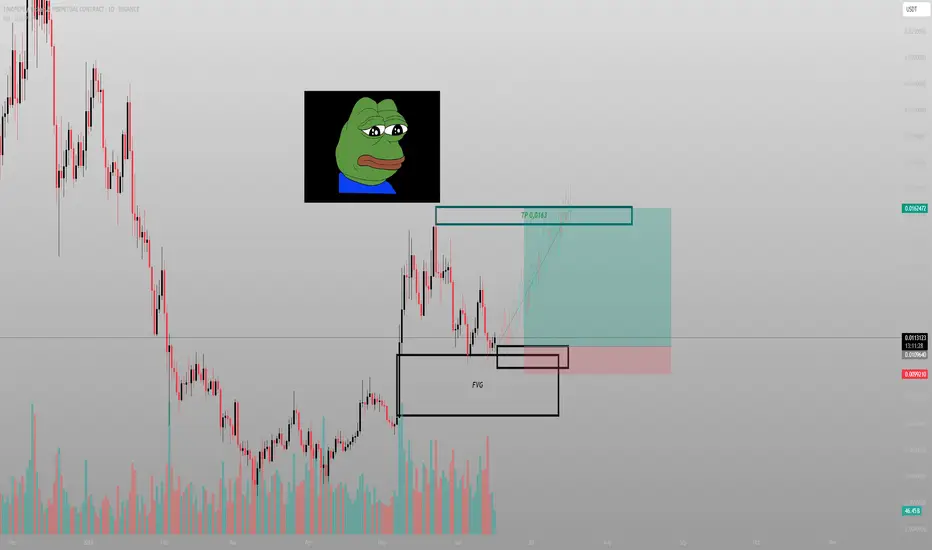
The FVG told the story. The chart just caught upThis wasn’t a pump. It was a re-delivery. Price tapped into the daily Fair Value Gap, respected the zone, and printed structure off the low. The retracement didn’t break us — it loaded us.
The logic:
The move began from an untouched Daily FVG — clean displacement, low retest, and now price is worki
See all ideas
Summarizing what the indicators are suggesting.
Oscillators
Neutral
SellBuy
Strong sellStrong buy
Strong sellSellNeutralBuyStrong buy
Oscillators
Neutral
SellBuy
Strong sellStrong buy
Strong sellSellNeutralBuyStrong buy
Summary
Neutral
SellBuy
Strong sellStrong buy
Strong sellSellNeutralBuyStrong buy
Summary
Neutral
SellBuy
Strong sellStrong buy
Strong sellSellNeutralBuyStrong buy
Summary
Neutral
SellBuy
Strong sellStrong buy
Strong sellSellNeutralBuyStrong buy
Moving Averages
Neutral
SellBuy
Strong sellStrong buy
Strong sellSellNeutralBuyStrong buy
Moving Averages
Neutral
SellBuy
Strong sellStrong buy
Strong sellSellNeutralBuyStrong buy
Displays a symbol's price movements over previous years to identify recurring trends.