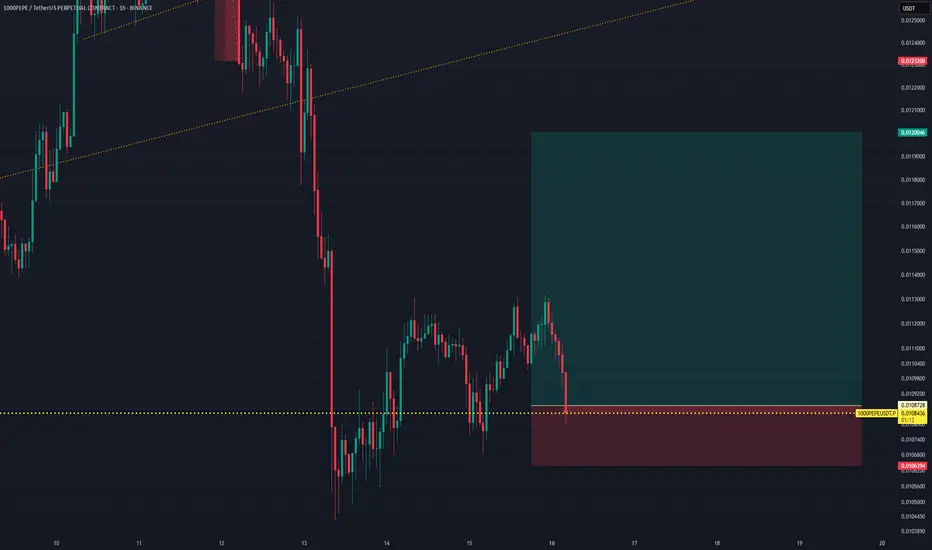
1000PEPEUSDT Perpetual – Demand Zone Long ReversalThis setup is a long (buy) strategy on the 1000PEPEUSDT.P pair, targeting a potential rebound from a key short-term support zone after a sharp pullback.
Setup Details:
Position: Long
Entry Price: 0.0108444
Stop Loss: 0.0106394
Take Profit: 0.0120046
Risk-to-Reward Ratio (RRR): ~5.66
Timeframe: Likely 1H or 4H based on candle size
Rationale:
Price is approaching a strong horizontal support zone that has held multiple times in the past.
The most recent candle has a long lower wick, indicating buying pressure or rejection of lower prices.
The trade anticipates a quick bullish reaction from this support level.
Take profit is set near a previous minor resistance / swing-high.
Summary:
This is a demand-zone reversal play suitable for scalpers or intraday traders looking for a high RRR bounce setup. Ideal confirmation would be a bullish engulfing or momentum candle forming after entry.
1000PEPEUSDT.P trade ideas
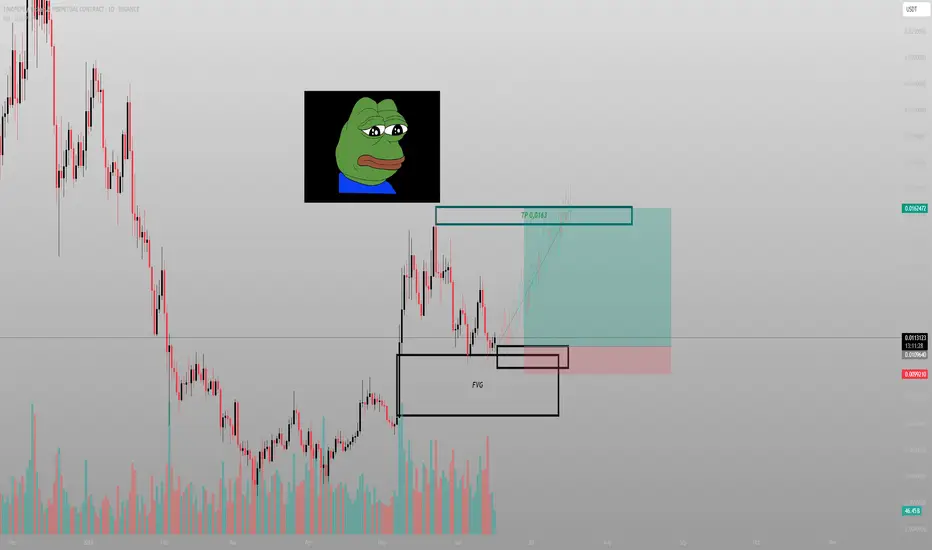
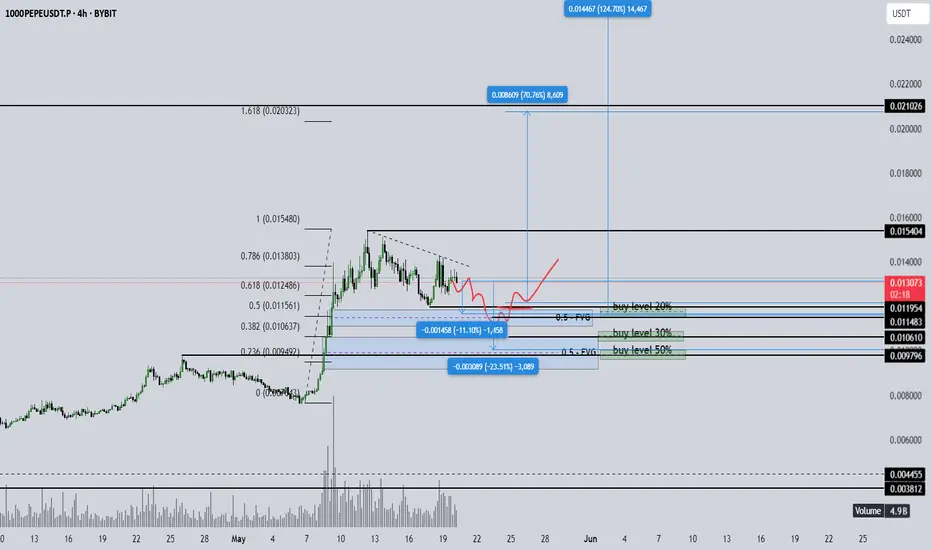
The FVG told the story. The chart just caught upThis wasn’t a pump. It was a re-delivery. Price tapped into the daily Fair Value Gap, respected the zone, and printed structure off the low. The retracement didn’t break us — it loaded us.
The logic:
The move began from an untouched Daily FVG — clean displacement, low retest, and now price is working its way through old inefficiencies. There’s no breakout here. Just one thing: delivery.
TP: 0.0163 — high timeframe imbalance resolution and prior volume pivot
The setup didn’t beg. It whispered. And now it’s unfolding, with confluence from every angle — market structure, volume, and intention.
Execution:
Entry: 0.0109–0.0113 (already in the zone)
SL: Below 0.0092
TP: 0.0163
Let others laugh at frogs. I’m here to extract liquidity from their disbelief.
Final thought:
“The move doesn’t care if you believe in it. It just needs a reason to unfold.”
PEPE CAN IT BREAK AND PUMP ?$1000PEPEUSDT: Zone Action!
🔴 Red Zone (0.012050 - 0.012150): Currently battling here. Expect DUMPS FROM RED, but a break means PUMPS IF BREAKS RED! 🚀
🔵 Blue Zones (0.011400 / 0.011000): If we dip, look for PUMPS FROM BLUE. Break below = DUMPS IF BREAKS BLUE! 📉
Watching these levels closely!

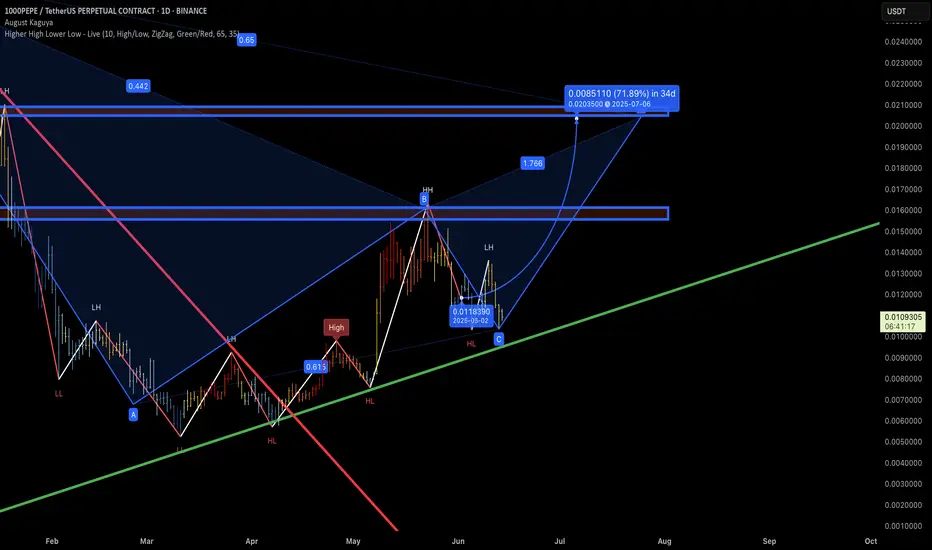
Bullish Setup with Harmonic + HL Retest PEPE is showing a potential bullish continuation after forming a Higher Low (HL) near key trendline support. The C point bounce aligns with a harmonic PRZ and macro market structure, suggesting a 70%+ upside move if confirmed.
📍 Entry: ~$0.0109 (support + HL retest)
🎯 Targets:
TP1: $0.0130 – minor resistance
TP2: $0.0155 – previous LH zone
TP3: $0.0176 – harmonic D projection
TP4: $0.0203 – full extension target (~72% gain)
BTC Traps Before the Pump?BTC Traps Before the Pump?
15-min hidden bullish divergence spotted on OBV 🫢
Liquidity stacked above I’m expecting a move up during New York session and Powell’s speech.
We saw a sharp dump from the daily open but before the real move unfolds, one more push up to take out liquidity makes perfect sense.
Could be the trap… before the launch. 🚀
Let’s see how it plays out.
#BTC #Crypto #Powell #SmartMoney
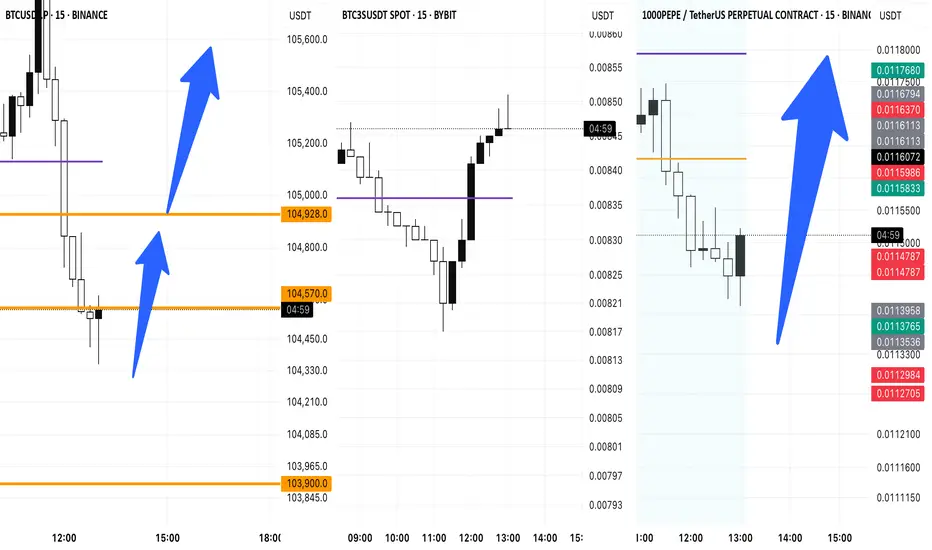
#1000PEPEUSDT LONG IDEA🟢 Took PEPE long after NY open
BTC has stabilized with the New York session open
as I mentioned earlier, I’m expecting upside continuation.
That’s why I tapped into CRYPTOCAP:PEPE long.
🎯 Reasons:
• 5M bullish divergences on CCI, OBV, MOM
• Liquidity above including daily open & PDL
• Price holding support + reactive strength
If BTC stays healthy, I expect alts to breathe this weekend.
Let’s see how it plays out.
Plan your levels. Stay sharp.

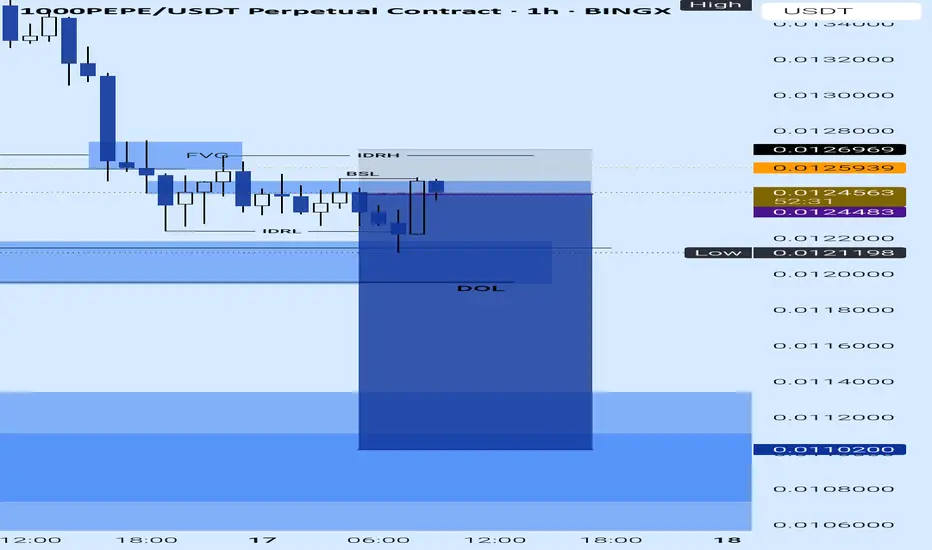
1000PEPEUSDTSHORTPrice has just tapped the POC (Point of Control) and showed an immediate reaction signs of absorption at the high.
The structure remains weak, and with London session approaching, we could see continuation to the downside.
🔍 Context:
Price rejected at key volume node
Consolidation under resistance
Potential for lower high formation
Liquidity resting below the range
I'm already in a short position from current levels, with eyes on the next support zones for possible TP.
Let’s see if London delivers the momentum for the next leg down.

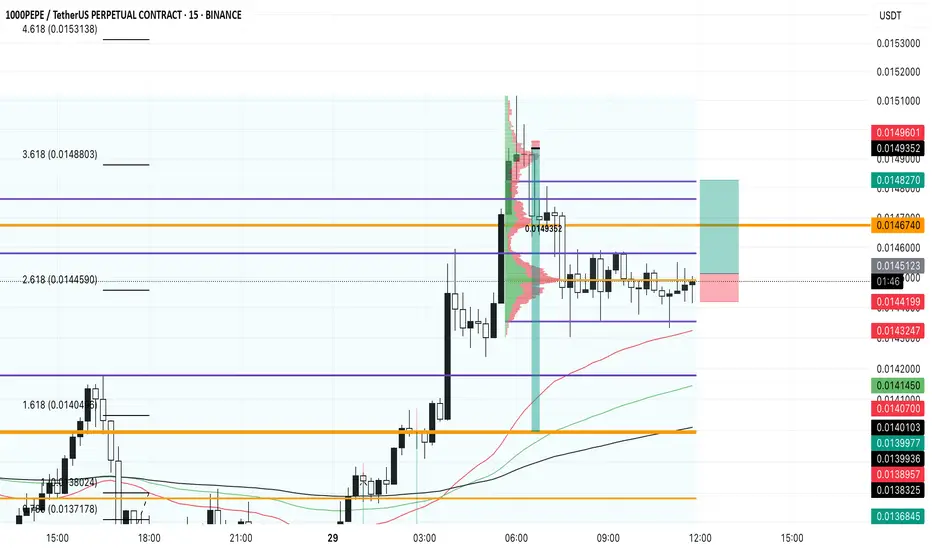
1000PEPEUSDT LONGPEPE/USDT – Possible Deviation Setup Forming | 15M Chart
We're currently trading above the 2.618 Fib extension level (0.0144590) — a key golden ratio zone.
There’s also a clear divergence on both MACD and CCI (15m TF), signaling potential momentum exhaustion.
The Volume Profile shows a low volume node above the current range — lots of untapped liquidity waiting to be swept.
This consolidation looks like accumulation during the Frankfurt session, followed by manipulation during London.
If BTC remains stable, I expect a deviation move during New York session, potentially sweeping highs above 3.618 (0.0148803) and into 4.618.
📍 Watching for a fake breakout and potential reversal setup from the upper fib zones.
Let’s see how it plays out.
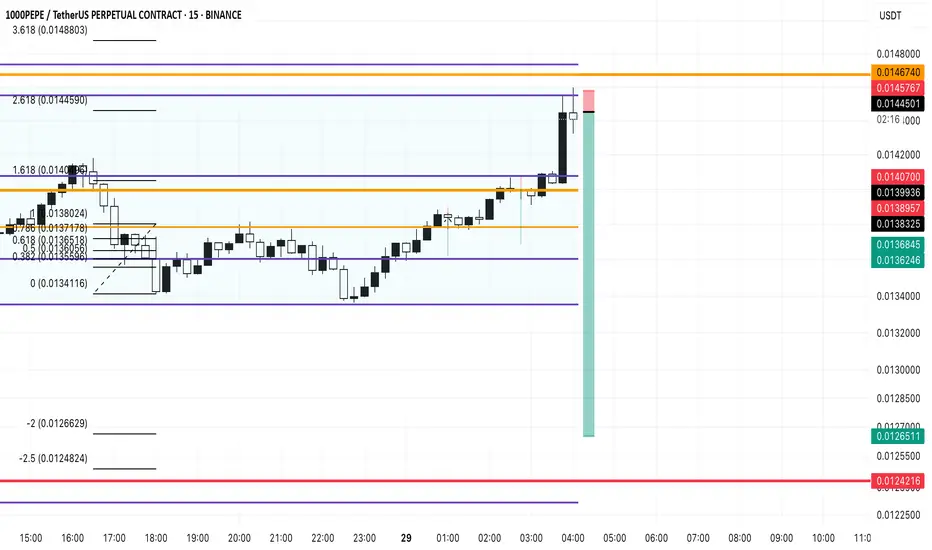
LONG SETUP | 15M ChartLONG SETUP | 15M Chart`
Asia session gave a fakeout dump followed by strong buying pressure.
Price reclaimed key support and broke structure with OBV confirmation.
Now consolidating above equilibrium.
Entered long with invalidation below 0.0142988.
Targets:
1️⃣ VAH zone — 0.0146740
2️⃣ Final target — 0.0146757 (FVG top)
Holding unless structure breaks down. Let’s see if the bulls have fuel. 🚀📈

PEPE SHORT 5 MIN CHARTThe price hit the VAH and failed to break through. If we get a reaction, a lower low is likely. I’ve entered a position.
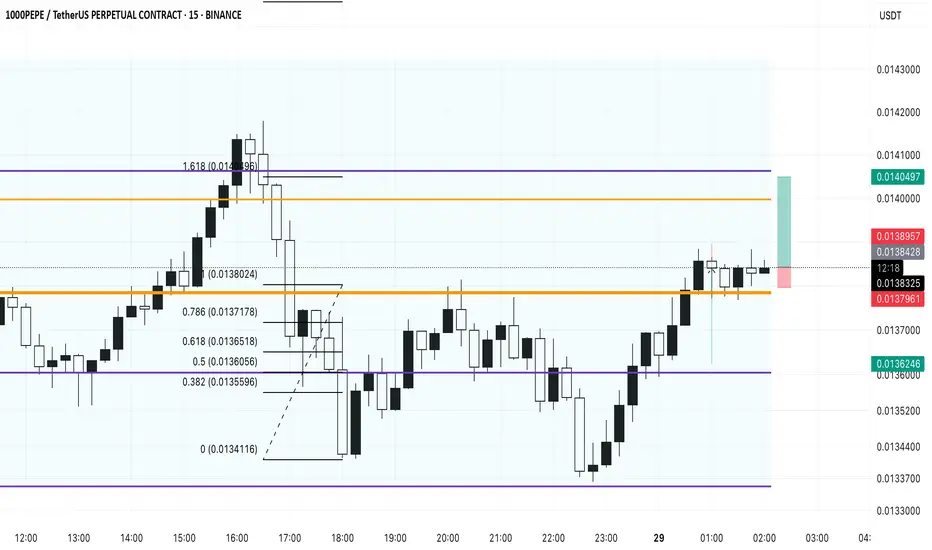
Long PepeBreaking through the resistance at 0.0138857 will open the way to the VAH and the 1.618 Fibonacci level.
pepe downi don't know why but yes it looks like a down trend with a circle like passing a ball to the bottem i think it will go as gods plan GLHF
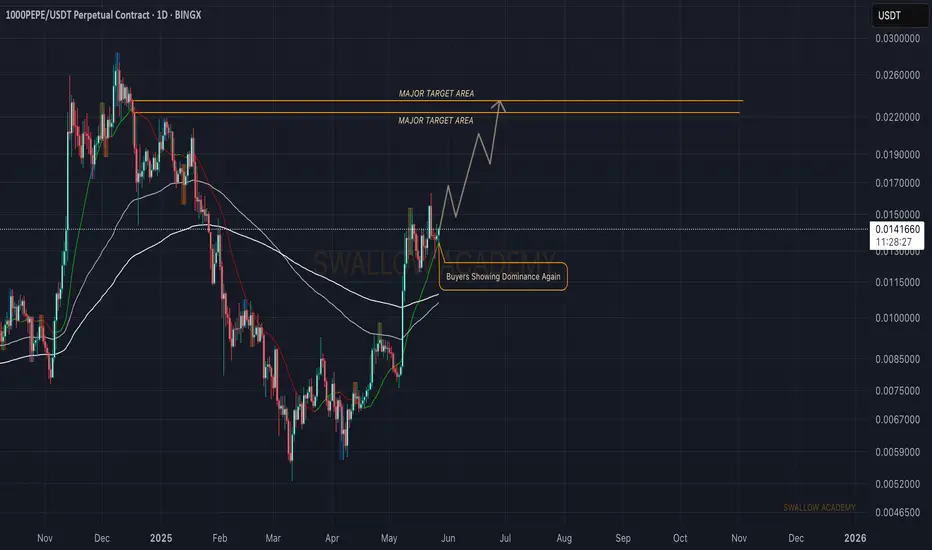
Pepe (PEPE): Buyers Are Slowly AccumulatingPepe coin seems to accumulate currently where buyers are preparing to form a new local high. With that being said we do not see any strong rejection but near 0.022 area which we will be setting as a target for us (as long as price hold the area above EMA)
Swallow Academy
Phemex Analysis #84: Pro Tips for Trading PEPEIn the vibrant and ever-changing landscape of cryptocurrency trading, PEPE ( PHEMEX:1000PEPEUSDT.P ) has recently captured significant attention from investors. Over the past 30 days, PEPE surged an impressive 130%, showcasing strong bullish momentum after a prolonged downtrend. This recent rally has rekindled investor interest, suggesting that a potential bullish reversal may be underway.
Yet, with volatility remaining high, traders should remain cautious.
Let’s explore several possible price scenarios and strategies to capitalize effectively on PEPE’s movements.
Possible Scenarios
1. Accumulation Followed by Breakout Rise
Currently, PEPE is showing signs of accumulation in the $0.015 to $0.012 range. This sideways consolidation typically indicates that market participants are gathering positions before a potentially significant upward move. If PEPE breaks decisively above the critical resistance at $0.0163, especially accompanied by a notable spike in trading volume, it would be a strong confirmation of bullish sentiment.
Pro Tips:
Entry Strategy: Consider accumulating positions within the consolidation range ($0.015 - $0.012). Wait for confirmation of a breakout above $0.0163 to scale up your positions confidently.
Risk Management: Place stop-loss orders below $0.012 to mitigate downside risk should the breakout fail to materialize.
2. Retesting the $0.007 Support Area
A pullback scenario could also unfold, bringing PEPE’s price down to retest the critical support zone around $0.007. If this retest occurs with relatively low trading volume and the RSI remains higher compared to previous lows—signaling a Double Bottom formation with RSI divergence—this could provide an excellent accumulation opportunity.
Pro Tips:
Accumulation Signals: Monitor trading volume and RSI closely. A successful retest at $0.007 with bullish divergence could indicate strong buying pressure.
Entry Confirmation: Conservative traders may prefer waiting for a confirmed breakout upward from the $0.007 support area before entering positions.
3. Bearish Drop Scenario
Despite the recent bullish signs, a bearish scenario remains possible. If PEPE declines towards the support level at $0.012 with increasing trading volume, and subsequently drops to $0.007 with even higher volume, it could indicate strong bearish momentum and weak market sentiment. Under these conditions, caution is highly recommended.
Pro Tips:
Market Caution: If price action unfolds this way, it’s advisable to refrain from entering positions immediately.
Wait and Observe: Allow price to stabilize before reconsidering any potential entry points, ensuring clear evidence of support.
Conclusion
PEPE’s recent 130% surge represents promising signs of a bullish reversal, yet navigating such volatility demands careful planning and strategic execution. By closely monitoring the outlined scenarios—recognizing accumulation signals, bullish divergences, and maintaining disciplined risk management—traders can maximize their potential returns while minimizing risk exposure. Always stay alert, responsive to market signals, and ready to adapt to changing conditions to trade PEPE confidently and profitably.
Tips:
Trade Smarter, Not Harder with Phemex. Benefit from cutting-edge features like multiple watchlists, basket orders, and real-time strategy adjustments. Our unique scaled order system and iceberg order functionality give you a competitive edge.
Disclaimer: This is NOT financial or investment advice. Please conduct your own research (DYOR). Phemex is not responsible, directly or indirectly, for any damage or loss incurred or claimed to be caused by or in association with the use of or reliance on any content, goods, or services mentioned in this article.

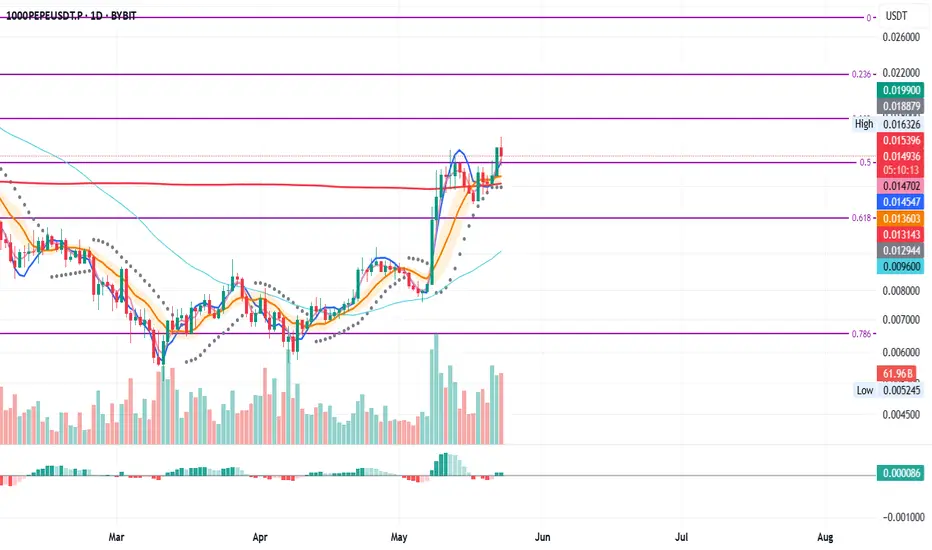
PEPE Daily – Testing Key Fib Support
After getting rejected at the 0.5 Fibonacci level on May 14, PEPE is now retesting it as support.
On the way down, price found support at the 200MA, even after briefly closing below it on the daily chart.
You could argue MLR > SMA, but both are still above the BB center and the 200MA, which maintains the overall bullish structure.
⚠️ Watch for a daily close below the 0.5 Fib—that would weaken the structure and could lead to further downside.
Look closer at smaller time frames.
Thanks for reading—if you found this engaging, react or comment.
Always manage risk and take profits. 📊
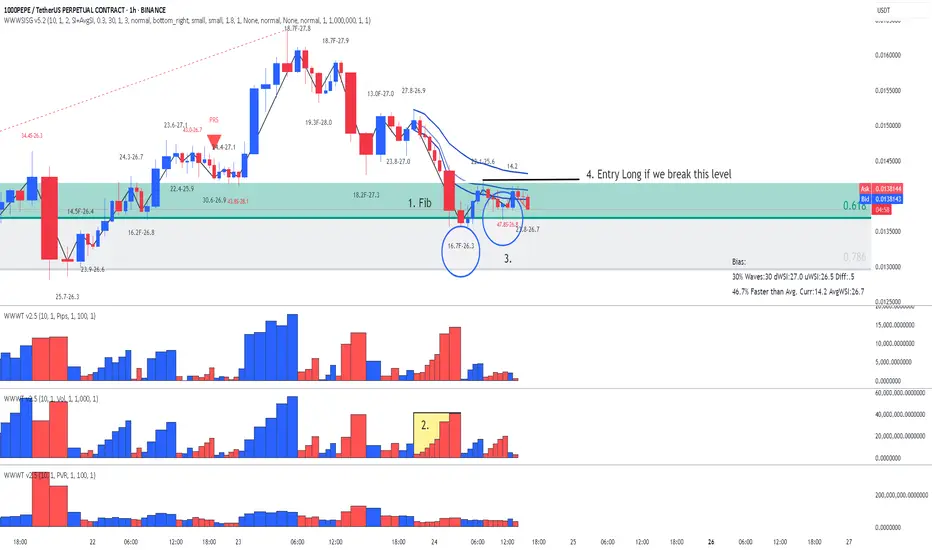
PEPE - Trade is on the way - Reading Speed IndexChart reading using price location, volumes and Speed Index:
1. We are on Fib (buyers could enter here)
2. Fast down wave on the way to Fib with SI at 16.7 while the average was 26.3
3. Next down wave it's a very slow wave and it look like an HTMD (hard to move down) with a very high Speed Index of 47.8 while the average was 26.8 (probable buyers absorbing sell orders). This is change in Behavior , but in order to confirm the reading it would nice be for the forming down wave to finish with a high Speed Index.
4. AVWAP blue lines act as resistance. Finally to enter long we need price to break resistance level marked with the black line, otherwise we might get stuck into a range and you never know what's going to happen next.
Patience! Enjoy!
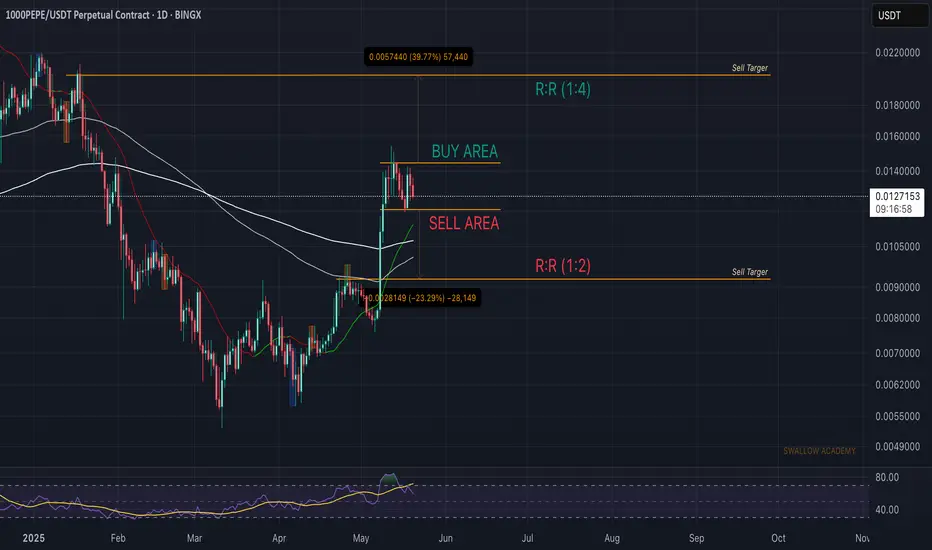
1000PEPE (PEPE): Good Risk/Reward Trades Can Be Taken | WaitPepe coin has shown us a good upward movement recently, and we are now at a pretty crucial zone. It does not matter if we see a breakout or breakdown; we are going to wait for a perfect sign in the form of a break, which would then give us either a 1:2 RR or 1:4 RR position that we can take.
Swallow Academy
PEPE key levelsBINANCE:PEPEUSDT
The chart shows partial zones for buying this asset.
Further on there will be a good profit to risk ratio.
$1000PEPE | Smart Money Retracement Levels - Watch FVG + Fib ConAfter a strong breakout and Change of Character (ChoCH), $1000PEPE is now pulling back into a potential premium-to-discount retracement. I'm watching the following key areas:
FVGs + Fib Gold Zones (50% & 61.8%) = high-probability bounce regions
Bu-MB & Bu-B zones = smart money interest area
Daily MSB confirms shift in structure
Key retracement levels:
🔸 Fib 61.8% at 0.0105671
🔸 Fib 78.6% at 0.0091527
🔸 Fib 100% at 0.0052434
Targets: Reclaiming PDH / PWH could suggest continuation.
Invalidation: Break below 0.0052 weak low area (LL) cancels bullish bias.

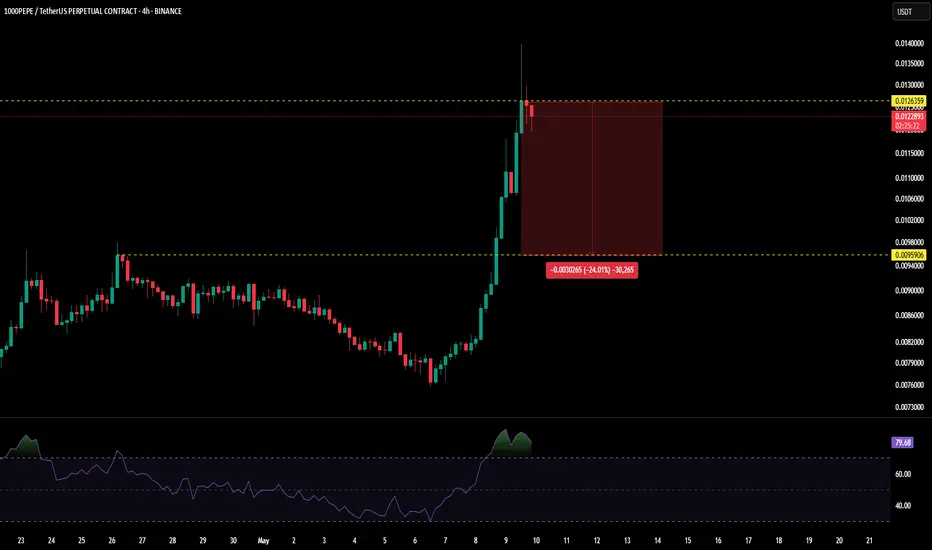
1000PEPE Short Signal1000PEPE Short Signal Alert
🔻 Entry: Short 1000PEPE at CMP
📉 Stop-Loss: $0.013
⚡️ Leverage: 10x
🎯 Targets: $0.0112 → $0.0106 → $0.0100 → $0.0098
The setup looks solid for a potential downside move — but as always...
📌 DYOR (Do Your Own Research) before entering the trade.
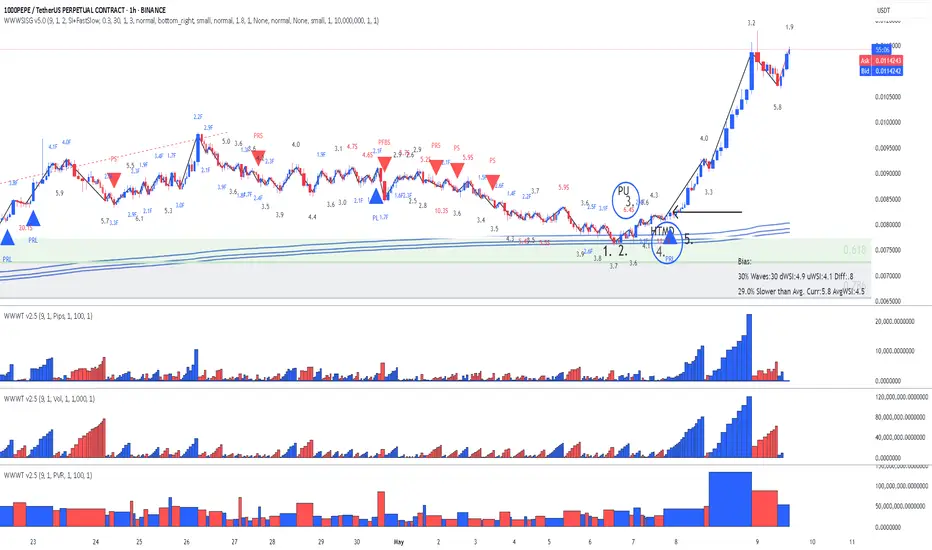
PEPE - This is why price explode - Speed Index ReadingThere is always a reason why price explodes either true or fake. The criteria to look at are:
- Location - very important - where is the price locate - higher probability trades accomplished when the price leaves a significant location such us Fib, Sup/Res, AVWAP
- The volume waves - nothing moves without volume - sometimes is not so visible by the volume waves alone because they distribute or accumulate little by little, that's why we have Speed Index
- Reading Speed Index
- The proper entry signal
In the attached chart I will demonstrate how I read it using the above criteria (annotations are in sync with the chart):
1. Price entering Fib Area 50-61.8 - possibility of buyers to come in
2. Price touching AVWAP (three blue lines) coming from the bottom of a previous swing acting as resistance - another possibility of buyers to come in.
3. Speed Index 6.4, that's an abnormal speed index , that what I call first push up or PU, price never drops below the beginning of this wave
4. Speed Index 11.1, that's another abnormal speed index and that's what I call a hard to move down (HTMD) . What's happening here is that all the sell orders are absorbed by buy orders and price breaks on the up wave the origin of the HTMD wave.
5. Finally the entry Long with a PRL (Plutus Reversal Long) signal an up,up,up, we go!!!
I hope my years of work helps you out on reading charts!
Enjoy!
PEPEPEPE has broken to the upside with really good strength and volume. I identified and OB which lies near previous resistance hence making it a valid OB.
Looking for a tap, than a confirmation on the 15 min timeframe and then I will share my entries.
