PEPEUSDT🚨 Trading Signal Alert 🚨
Hello, traders!
I’ve just updated my chart with precise indicators to guide your trades. Here’s what you need to know:
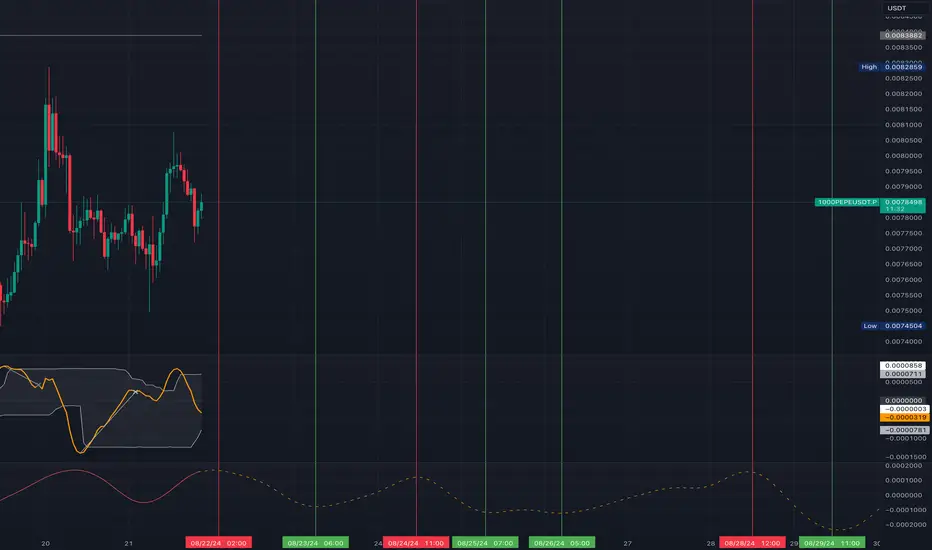
🔴 Red Lines - Selling Phase: These lines signal the start of a downward trend. Consider taking profits or shorting on these dates:
• August 22, 2024, 02:00
• August 24, 2024, 11:00
• August 28, 2024, 12:00
🟢 Green Lines - Buying Phase: These lines indicate the beginning of an upward trend. Ideal for opening long positions on these dates:
• August 23, 2024, 06:00
• August 25, 2024, 07:00
• August 26, 2024, 05:00
• September 29, 2024, 11:00
These signals are based on a blend of trend analysis, momentum indicators, and predictive modeling. They’re designed to help you identify the best times to enter and exit the market, aiming to maximize your gains.
As always, combine these signals with your own analysis and risk management strategies for the best outcomes.
Happy trading and stay ahead of the market! 📈
1000PEPEUSDT.P trade ideas
1000PEPEUSDTBINGX:1000PEPEUSDC.P
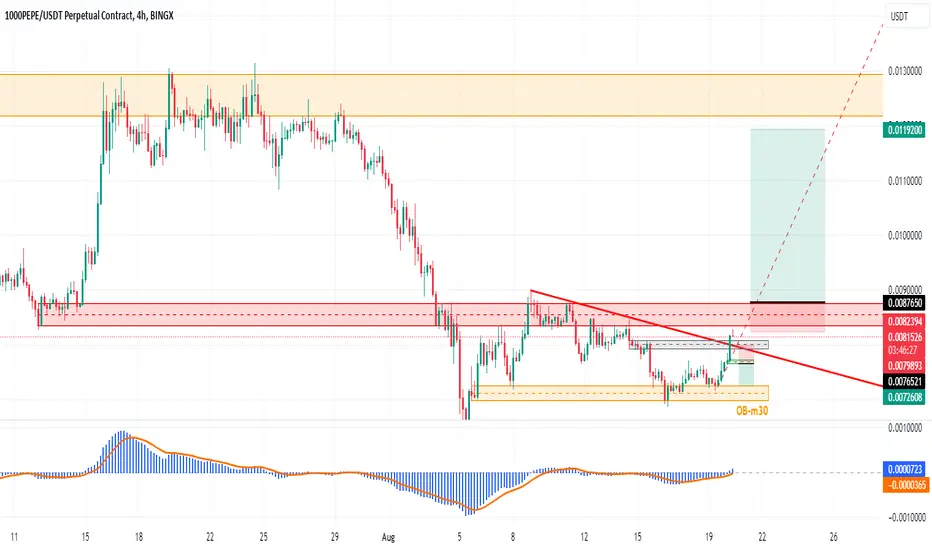
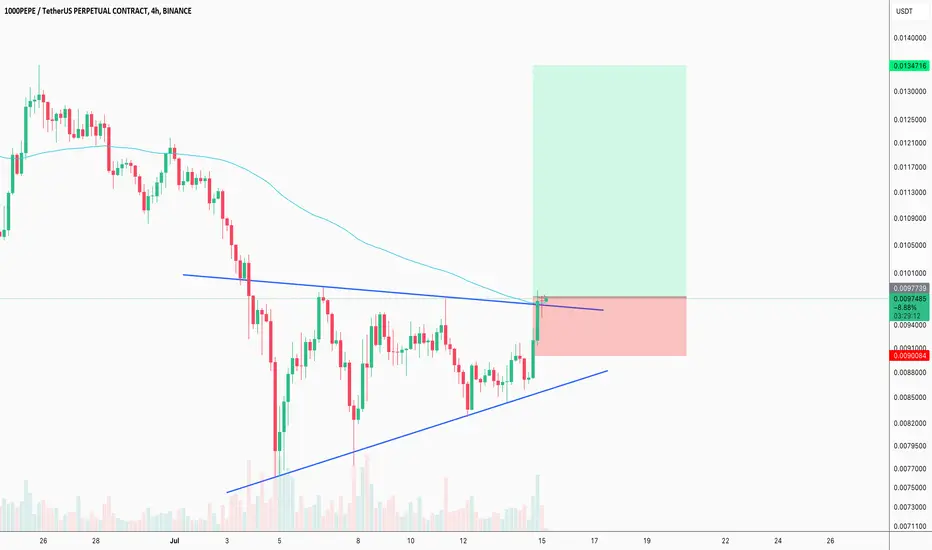
Well, in updating this analysis, I have to add a point that the red range drawn in the 4-hour period caused the price to fall in the previous downward trend, but pay attention to the fact that it formed a higher floor, so most likely, after crossing the red range to On the upper side, we will enter into the purchase transaction in the first pullback and earn a profit of 1:6 risk to reward.
As simple as this delicious.
1000PEPEUSDTBINGX:1000PEPEUSDC.P
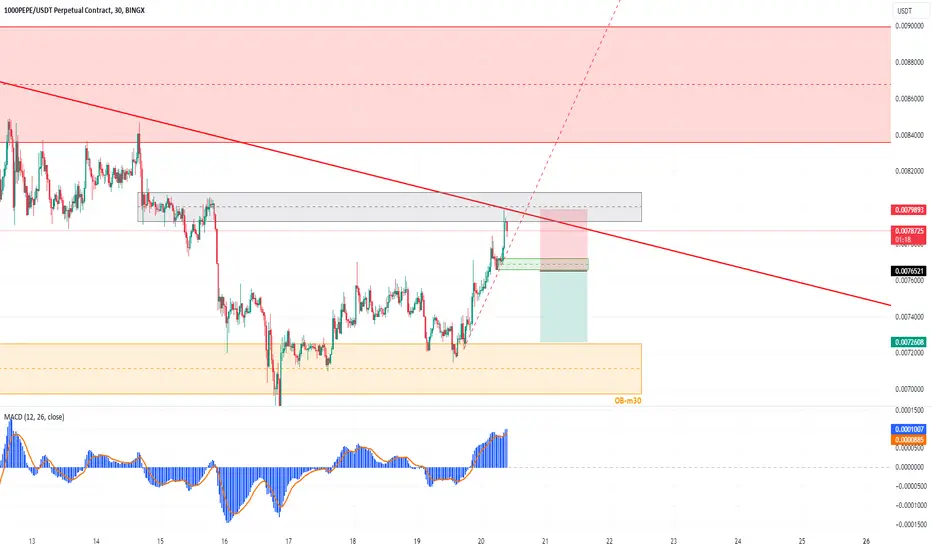
The red line is the 4-hour trend, the gray range is the price compression in 30 minutes, if the trend line is broken and the price closes below the green range, you can enter a sell order in pullback, keep in mind that the big red range that It is at the top of the price, it was the 4-hour range, and the price has retraced its money in that time frame, so eventually we will have a decline, according to the previously mentioned conditions.
This is a simple method of chart analysis.
PEPE will gonna explode anytime soon!!PEPE is one of my favorite memecoins, and it's currently riding the momentum of wave 3.
If we successfully complete this wave, we could potentially see gains as high as 10x to 15x—making it an incredibly exciting opportunity!

1000PEPE/USDT🔍 1000PEPE/USDT Analysis: Strategic Dates for Optimal Trading 🐸
The 1000PEPE/USDT chart highlights key dates that traders should monitor closely:
Best Purchase Opportunity: September 4, 2024 - Green Line: This date marks a potential local low, offering the best conditions for accumulating 1000PEPE. Consider this a prime time to build or add to your position.
Price Peaks: October 16, 2024, and January 14, 2025 - Red Lines: These dates are anticipated to be local peaks. Traders should consider taking profits or reducing exposure around these times as the market could reach resistance levels.
By timing your trades around these critical dates, you can optimize your strategy and enhance your trading performance in the 1000PEPE market.
#1000PEPE #CryptoTrading #MarketAnalysis #Cryptocurrency #Altcoins #1000PEPEUSDT #PEPE

PEP. 0.0083782. LONGThe token is recovering well, the long zone is clean, there are no deep pullbacks. We are going to retest the nearest strong level.

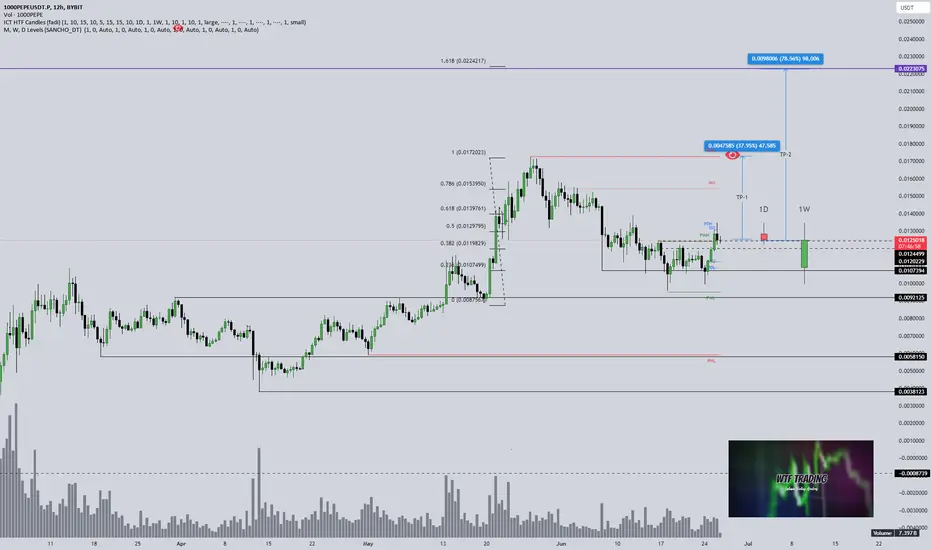
1000PEPE 1D AnalysisFor the past 3 weeks BINANCE:1000PEPEUSDT.P has been in a slump, last week in particular with consecutive red daily candles. I have slight bias towards longs, while open to shorts.
Here is the Fibonacci I am watching with a local VP showing a POC of .01200 <- A target.
Closing above the 0.786 Fib provides grounds for a return to the 0.5 Fib, which is also the local bearish 0.618 Fib from the $0.013 poor highs.
Price being closer to the low still gives me a bias for longs, but if we move to 0.382 or 0.5 I will be cautious for shorts.
Here I have a few ideas for a long.
I will be watching 12H,4H & 30min + 5min structure for precision entries.
The CC indicator (Top) is showing a 0.84 to BINANCE:BTCUSDT.P (over the past 50ohlc4) Suggesting a very close correlation to Bitty. Regardless of the key level BTC chooses, CRYPTO:PEPEUSD will likely require Bitty bullish structure there.
ADR (Bottom) over the past 100 candles showing these moves will take time to develop, days to weeks/months.
Zooming in to a 30minute; I spy with my little eye, poor lows ripe for the taking. Note the Daily 0.786 Fib is also the golden pocket from our 30m low. Watch for the hidden bull div on the 30minute RSI. However, 12H buyside with a 1D 0.618 right above may provide a perfect opportunity to short before we move that low. Of course, look for good structure & data driven edge such as OI or NL/S for entries.

LONG #1000PEPEUSDT 4h TF. Globally, after a strong impulse movement, the price pushed off from the support level at which the block order is also located, and the "equal lows" loss was also formed, which indicates a price reversal. I expect to go up in order to work out all levels of liquidity, as well as collecting limit orders from market participants with the potential to break the downward structure.
Take profits:
1 TP - 0.0074311, The Imbalance
2 TP - 0.0091145, The Imbalance
3 TP - 0.0127951, Block order and local maximum
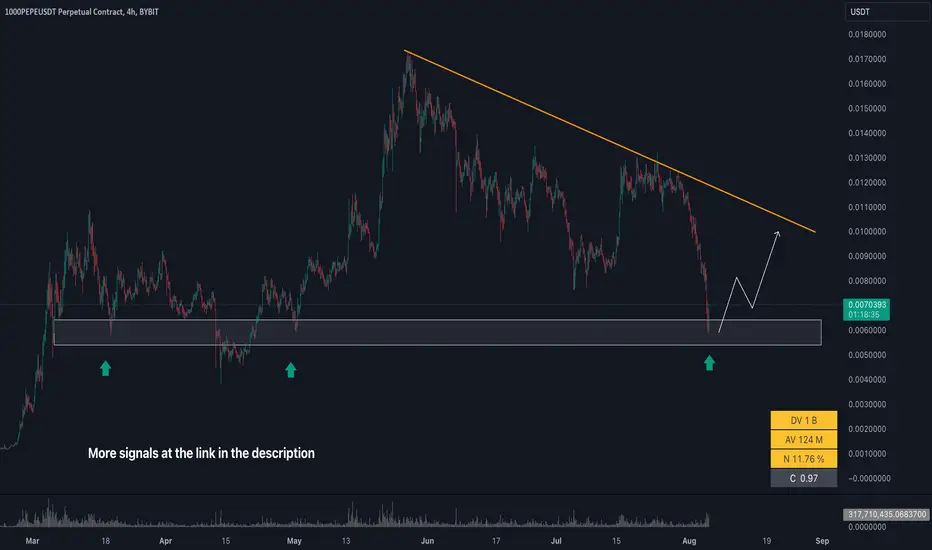
Pepe Swing—Support & Resistance (Range) | Developing Intuition This chart shows a range: Support and resistance levels for short- to mid-term trading.
The general bias is bearish based on the peak produced late May 2024.
With a bearish bias, any rise can be used as an opportunity to sell.
➖ When prices move toward resistance (up), short entry opportunities develop.
➖ When prices move toward support (down), long entry opportunities develop.
After range trading is over the market will develop a trend.
The hardest time and place to trade is when the market is ranging; such as now.
Many shakeouts and false signals can develop at this point.
👉 To trade successfully here one needs to be attuned to their emotions and feelings and go against the general market impulse.
➖ When things are looking really good and an impulse to buy develops, this normally happens at resistance before a turnaround. This is because the impulse we feel is the current market sentiment. The sentiment turns bullish when prices are rising and thus we get the impulse to buy. But buying isn't necessarily the best choice in this example.
➖ When things are looking bad. Prices are dropping. We get a negative feeling, we feel an urge to sell. But this might not be the best choice at the moment. The negative, depressing feeling reflects the fact that prices are dropping and people are selling, not that the chart is good to sell.
So we need to learn to distinguish between market feelings and our own internal guidance; intuition.
Your intuition will never be colored by strong feelings.
Your intuition will never rush you. It is a calm sentiment. A wise feeling.
Your intuition can insist a few times and then retreat.
The market impulse will rush you: "Now or never." "Hurry!" "FOMO!" Etc.
The market impulse will come with chatter in your mind. You start hearing all sorts of excuses as to why you need to make a move "now."
Learning to distinguish between your own internal guidance and the market sentiment can lead to major growth and success.
There is no hurry.
You can take your time.
Start small... And let it grow.
You are appreciated.
Namaste.
Short term ideaIt will not be borring today... Idea was created for education & entertainment and this is not a trading advice.

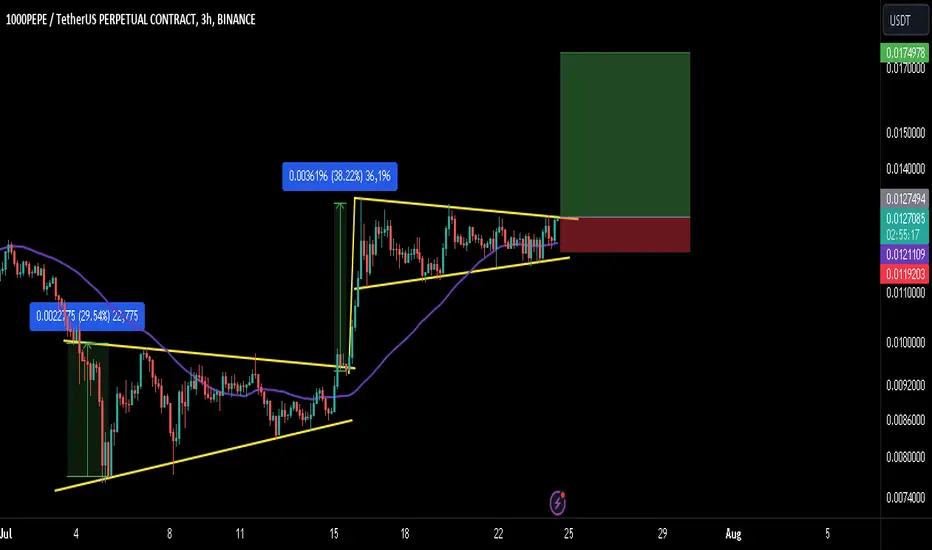
PEPE/USDT: LOOKS READY FOR A 25-30% RALLY!!Hey everyone!
If you're enjoying this analysis, a thumbs up and follow would be greatly appreciated!
PEPE looks good here. Forming a bull flag-like structure here and trying to break it out. You can enter now or wait for a clear breakout.
Targets:- $0.0136/$0.0148/$0.175
SL:- $0.0118
What are your thoughts on PEPE's current price action? Do you see a bullish pattern? Share your analysis in the comments below!
August 4th 2024 bullish entry $PEPE Fractal market analysis by Benoit Mandelbrot suggests market assets replicate former instances of price action due to the simple idea that, "Something can only be what it is; it can not be what it is not." This theory, coupled with a continued recent trend in whale purchases of BYBIT:1000PEPEUSDT.P , implies that the logic made in the provided image may be a worthwhile opportunity.

1000PEPE idea Im counting on both break and retest and sweep of inverse fvg for confluence. I cant give an exact entry as i can only do that after a sweep.

1000PEPE Eyes Breakout: Flag Pattern Indicates Potential Rally1000PEPE on the daily chart has formed an ascending channel and a bullish flag pattern, suggesting a potential upward move. The price is currently at 0.0121083 USDT, testing the flag's upper boundary. If 1000PEPE breaks out from this flag pattern, it could signal a strong bullish continuation, targeting the upper boundary of the ascending channel around 0.025 USDT.
KEY POINTS:
Ascending Channel: The price is moving within a clear ascending channel, indicating a general upward trend. This is a bullish pattern that suggests further price increases.
Bullish Flag Pattern: A bullish flag pattern within the channel shows a brief consolidation before a potential breakout. This pattern is a continuation signal in an uptrend.
Current Price Action: The price is consolidating near the upper boundary of the flag pattern, indicating a potential breakout point.
Volume Confirmation: Watch for increased trading volume to confirm the breakout, ensuring it is not a false signal.

PEPE/USDT BINANCE:PEPEUSDT
This idea has a long-term profit target.
All targets are indicated on the graph.
- Risk 1-3% on deposit
- R/R min 1/2
P.S (This is not an investment recommendation, this is my personal opinion.)
PEPEUSDT Good Buy!PEPEUSDT technical analysis update
PEPE has formed a triangle pattern on the 4-hour chart, and the price has now broken the triangle resistance in the 4-hour timeframe. Additionally, the price has broken above the 100 EMA, indicating a potential bullish move in PEPE in the coming days.
Regards
Hexa
everytime PEPE hit that level will always bouncethis is great oportunity to buy PEPE at discount area.

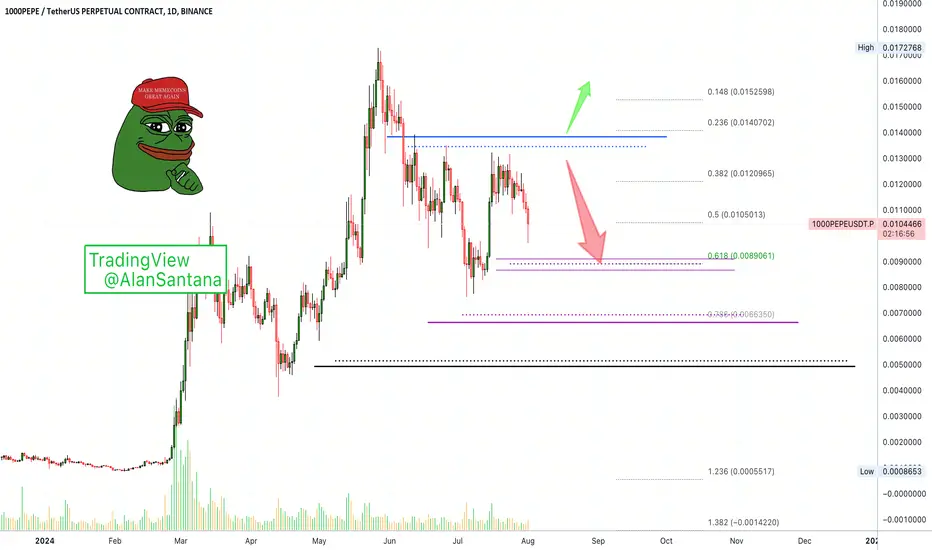
What will be the fate of PEPE?PEPE correction has started from where we entered "START" on the chart.
Several identical waves have been identified on the chart, which appear to be related to a diametric pattern.
From the red range, we expect PEPE to reject towards the two specified targets.
Closing a daily candle above or below the specified invalidation levels will cause the corresponding movements to be violated
For risk management, please don't forget stop loss and capital management
When we reach the first target, save some profit and then change the stop to entry
Comment if you have any questions
Thank You

Aggressive or ( X + X0 ) Entry Model 15m : must be we are in Kill zone of any session
X = LQ Swept against previous HL
X0 = LQ Swept against previous candle
after X + X0 happened, wait for last recent candle close then mark it as 15m Demand zone
LTF( 1m ) :
1. 15m Demand zone must be mitigated in LTF
2. LTF unmitigated Order Flow must be mitigated
After points 1 and 2 are met, we should be ready to place a market order as soon as a bullish confirmation candle appears on the 1-minute chart.
Since X and X0 happened at the same time, this entry should be considered an Aggressive Entry.

Crypto : 1000PEPEUSDT.P ORDER FLOW Entry15m : First Order Flow Mitigated( mandatory ) > Second Order Flow Demand Zone Mitigated
LTF(1m) : Liquidity Swept > Candle Confirmation(Bullish) > Entry
Note: Whenever 15m order flow doesn’t fully mitigated up to its order block, getting at least one confirmation from the liquidity side ( i.e liquidity sweep) in LTF(1m) will increase your chances of entering the trade. After the liquidity sweep, wait for a candle confirmation before entering with a limit order.

$PEPE on $ETH ETFOn the daily timeframe, we can see that the market structure is still bullish as price is currently trading above daily 200ema
With Ethereum ETF going live, it could spike up to .0107 to .0115 retesting the VWAP
Local resistance to break .0095
Alikze »» 1000PEPE | Pull Back to the broken structure🔍 Technical analysis: Pull Back to the broken structure
- In the frame time frame, a five -wave cycle has completed the upward movement.
- It is currently moving in a mid -time uptrend.
- After several reactions to the major roof, it eventually faces pressure in the middle of the channel and is now on the uptreen floor.
- This short return can continue the correction after the money to the broken structure, by failing the channel to the origin of the Movement and the Buyer Zone.
💎 Alternative scenario: can test the fiber range of 2.618 and the middle of the channel if it can break the supply area.
»»»«««»»»«««»»»«««
Please support this idea with a LIKE and COMMENT if you find it useful and Click "Follow" on our profile if you'd like these trade ideas delivered straight to your email in the future.
Thanks for your continued support.
Best Regards,❤️
Alikze.
»»»«««»»»«««»»»«««
BINANCE:1000PEPEUSDT.P

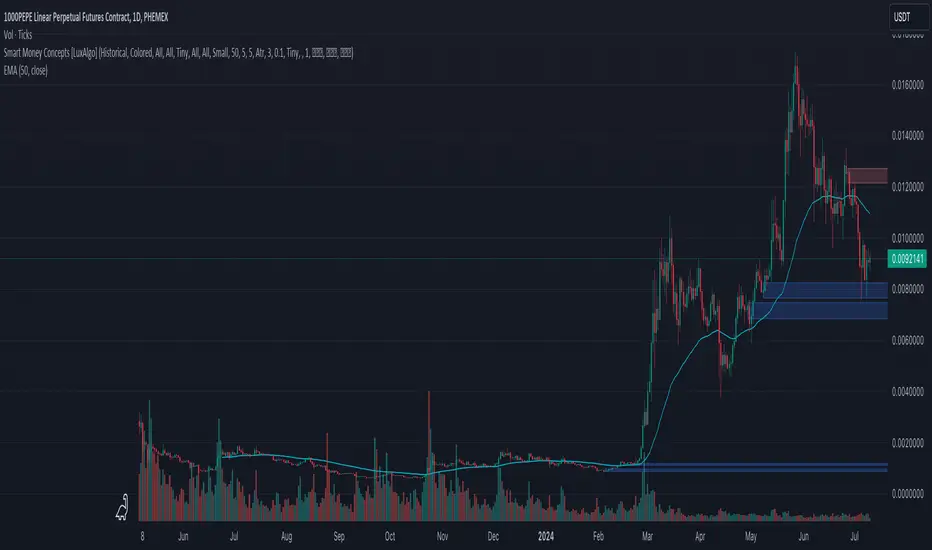
Phemex Analysis #5: 1000PEPE_ Resistance, Support & Trade Ideas.Since October, PHEMEX:1000PEPEUSDT.P has been a standout performer in the bull market, showcasing an impressive gain of 2,300% (from $0.000747 on October 23rd, 2023, to $0.0172 on May 27th, 2024). However, recent market signals indicate a potential deceleration. The formation of a lower high on June 26th and a significant decline in the Relative Strength Index (RSI) suggest weakening price strength, culminating in a notable drop to $0.0076 last week.
This development necessitates a comprehensive reassessment of the technical landscape, with a specific focus on critical support and resistance levels that are pivotal for informed trading decisions.
Resistance Levels:
Understanding resistance levels is essential for anticipating zones where selling pressure may intensify, potentially halting or reversing the current uptrend. Here are the identified resistance levels for PHEMEX:1000PEPEUSDT.P :
$0.0117 (Weak resistance): This level represents a modest obstacle where price might temporarily pause before potentially resuming its upward trajectory.
$0.0127 (Medium resistance): A more significant barrier that could trigger a temporary consolidation or pullback in price.
$0.0139 (Strong resistance): This level presents substantial resistance and may require robust buying activity to surpass.
$0.0158 (Strongest resistance): The highest resistance identified, indicating a formidable barrier where sustained buying pressure is needed for further upward movement.
Monitoring these levels is critical for detecting potential signs of exhaustion or reversal, particularly if repeated attempts to breach these levels prove unsuccessful.
Support Levels:
Conversely, support levels denote areas where buying interest is expected to emerge, potentially leading to price stabilization or a rebound. Here are the identified support levels for PHEMEX:1000PEPEUSDT.P :
$0.0076 (Weak support): A minor support level capable of temporarily arresting downward movements.
$0.0059 (Medium support): A more substantial support level where significant buying activity could help stabilize the price.
$0.0046 (Strong support): Represents a critical level historically associated with strong buying interest, often triggering significant price rebounds.
$0.0039 (Strongest support): The most robust support level identified, indicating a solid foundation where price has consistently found buyers in the past.
These support levels are pivotal for identifying potential entry points for long positions, especially when price approaches these levels and shows signs of stability or reversal.
Trading Ideas:
Armed with a clear understanding of these key support and resistance levels, traders can implement effective strategies tailored to current market conditions:
Long Position Strategy: Consider initiating long positions when the price consolidates near a strong support level, indicating potential for a rebound and continuation of the uptrend.
Short Position Strategy: Look for opportunities to initiate short positions as price approaches strong resistance levels and displays signs of exhaustion or reversal, such as the formation of a third top combined with RSI divergence.
Advanced Strategy - Neutral Grid Bots: For traders with advanced technical skills, deploying neutral grid bots can provide a strategic advantage. These bots are designed to capitalize on price fluctuations within a specified range, enabling traders to benefit from both upward and downward movements without committing to a single directional bias.
By integrating these strategies into their trading approach, intermediate traders can effectively navigate market volatility and capitalize on opportunities presented by key support and resistance levels.
Note: Do check out Phemex website for our Neutral Grid Bots that is specially crafted for Sophisticated, Advanced Traders, like you.
Disclaimer: This article is intended for educational purposes only and does not constitute financial or investment advice. Readers are encouraged to conduct their own research (DYOR) and consider their financial situation and risk tolerance before making any investment decisions. Phemex does not assume responsibility, directly or indirectly, for any potential damage or loss incurred or claimed to be caused by or in connection with the use of or reliance on any content, goods, or services mentioned in this article.