1000Shib Short ideaBased on trend analysis price is decreasing.
Bearish flag, decreasing trend.
Stop loss 6.4%/ take profit 11.24%.

Support and resistance zone: 0.016987-0.017858
Hello, traders.
If you "Follow", you can always get new information quickly.
Have a nice day today.
-------------------------------------
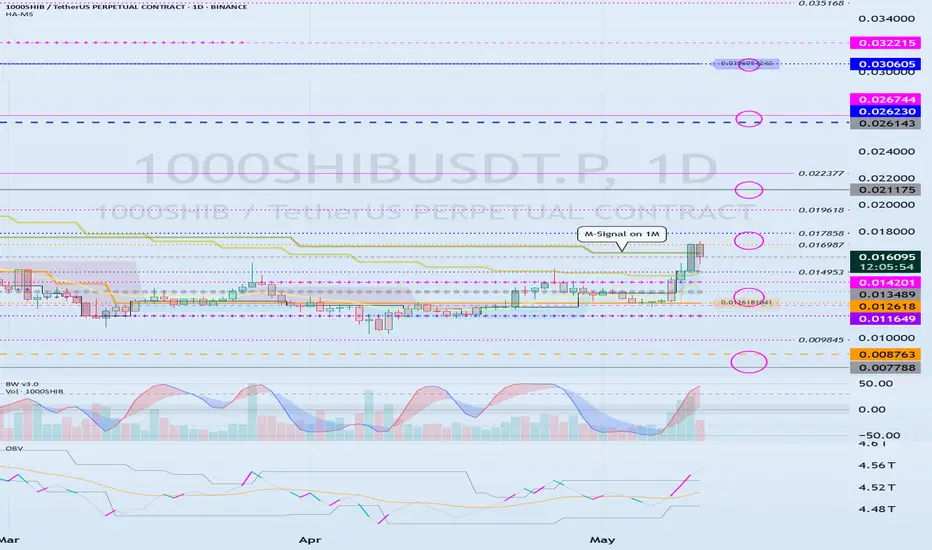
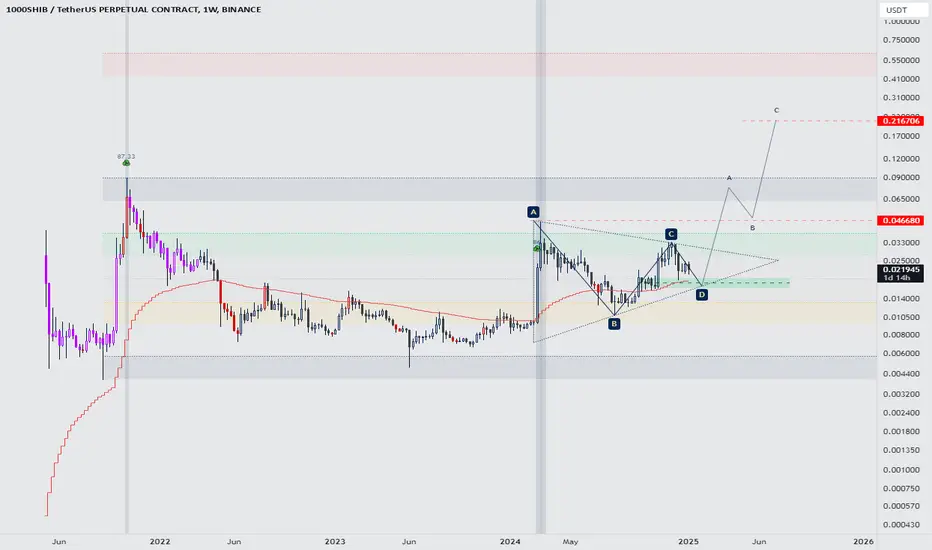
(1000SHIBUSDT.P 1W chart)
The key is whether the M-Signal indicator on the 1M chart can rise above and maintain the price.
If the price rises above the impo
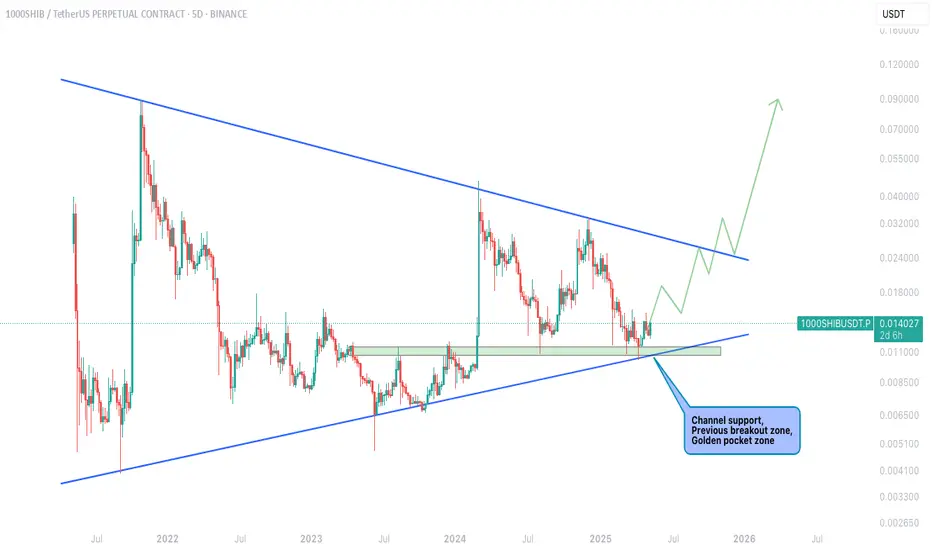
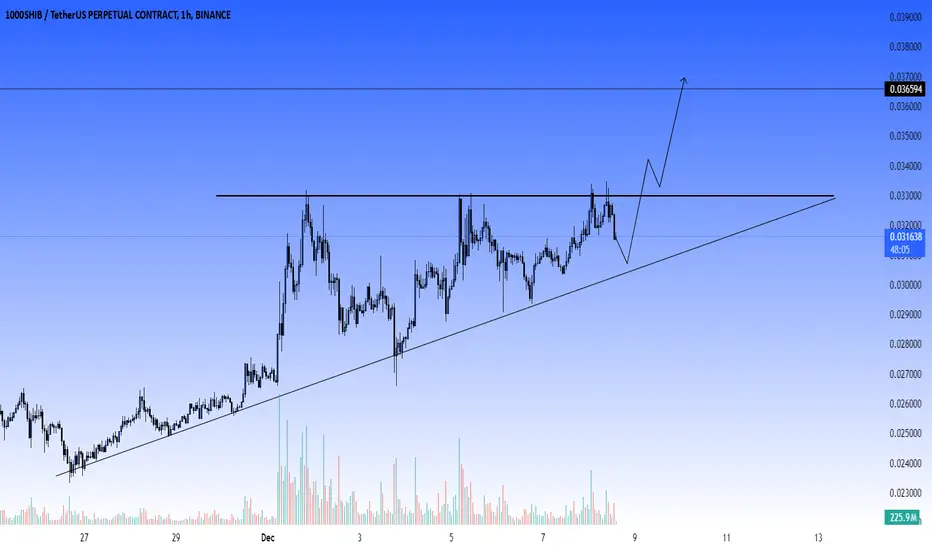
SHIBUSDT – Perfect Confluence Zone Holding Strong!CRYPTOCAP:SHIB has just bounced from a critical confluence zone, combining:
✅ Channel support
✅ Previous breakout zone
✅ Golden pocket retracement
This triple-layered support has historically acted as a powerful launchpad, and the price is already showing early signs of strength.
The price struct
SHIBUSDT.P SHORT/SELL SETUPHello, TradingView community and my subscribers, please if you like ideas do not forget to support them with your likes and comments, thank you so much and we will start a SHORT/SELL outlook on #1000SHIBUSDT.P explained
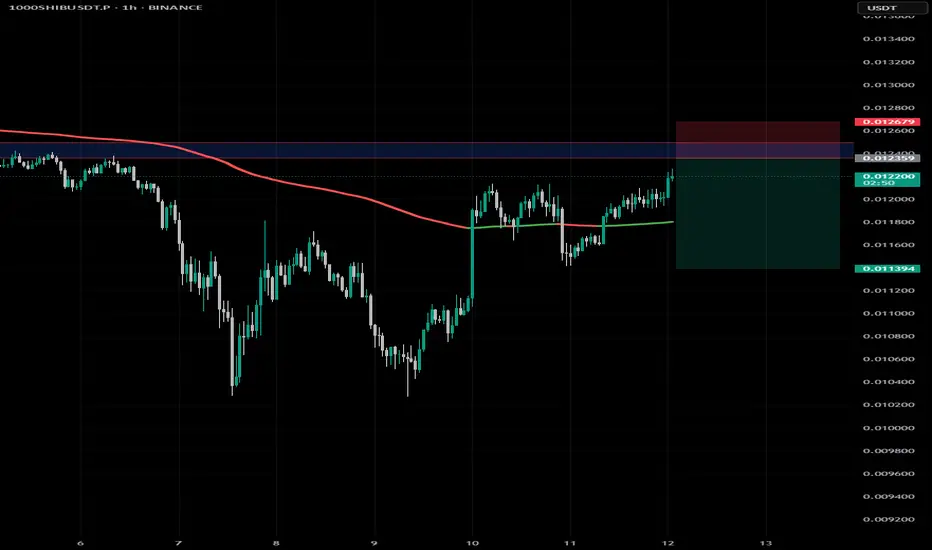
1000SHIB Ready for a Massive Move? Key Support Holding Strong! 🔍 Market Analysis & Trade Opportunity
The ( BINANCE:1000SHIBUSDT.P ) pair is sitting at a critical support zone, showing signs of potential reversal. With buyers stepping in and multiple rejections forming, this level could act as a launchpad for the next bullish rally.
🧐 Why This Setup is Import

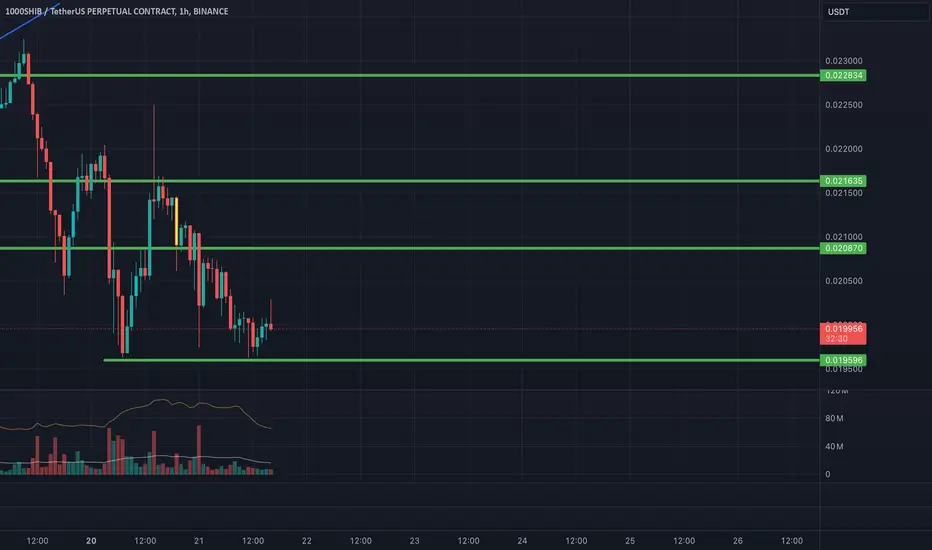
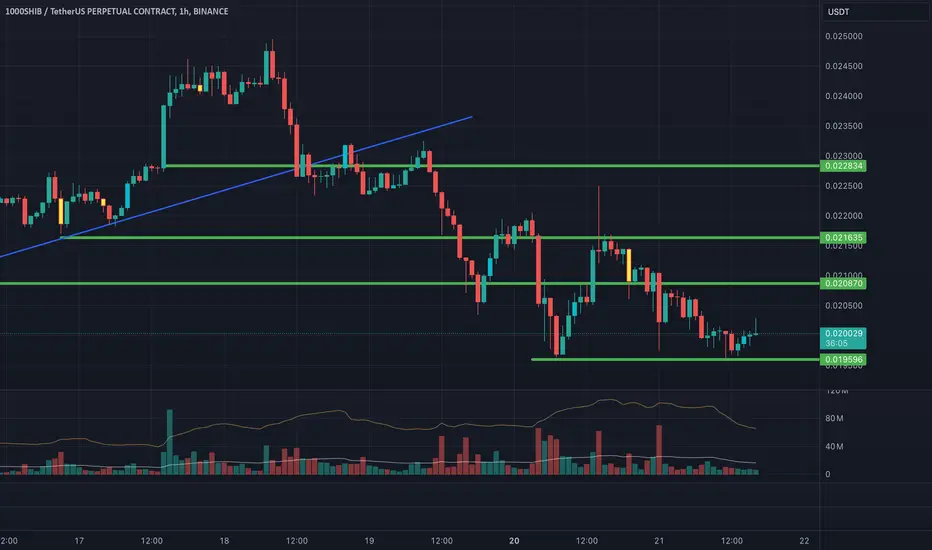
SHIB1000USDT: Reversal or Breakdown?
📉 BYBIT:SHIB1000USDT.P is currently trading at a critical support zone around 0.019900 USDT . After multiple tests of this level, buyers are stepping in, but is it enough to trigger a rally?
---
🔑 Key Levels:
Support:
0.018347 USDT — the last support level, a breakdown her
CHoCH (Change of Character) in Crypto TradingWhat is CHoCH?
CHoCH (Change of Character) is a concept from Smart Money Concept (SMC) used in technical analysis. It signals a shift in market behavior and often marks the beginning of a new trend phase, whether a trend reversal or consolidation.
Unlike Break of Structure (BoS), which confirm
Potential to reach New ATHshibausdt BINANCE:SHIBUSDT
Considering Shiba's weekly price movement, it has the potential to reach a new all-time high (ATH) again. Let's wait and see
Fresh Demand Zone IdentifiedDespite potential year-end challenges in the crypto market, it’s crucial to plan for buying scenarios to navigate adverse conditions. For SHIBUSDT, the fresh demand zone highlighted on the chart represents the strongest remaining support level, where buyers are likely to step in.
This zone offers a

See all ideas
Summarizing what the indicators are suggesting.
Oscillators
Neutral
SellBuy
Strong sellStrong buy
Strong sellSellNeutralBuyStrong buy
Oscillators
Neutral
SellBuy
Strong sellStrong buy
Strong sellSellNeutralBuyStrong buy
Summary
Neutral
SellBuy
Strong sellStrong buy
Strong sellSellNeutralBuyStrong buy
Summary
Neutral
SellBuy
Strong sellStrong buy
Strong sellSellNeutralBuyStrong buy
Summary
Neutral
SellBuy
Strong sellStrong buy
Strong sellSellNeutralBuyStrong buy
Moving Averages
Neutral
SellBuy
Strong sellStrong buy
Strong sellSellNeutralBuyStrong buy
Moving Averages
Neutral
SellBuy
Strong sellStrong buy
Strong sellSellNeutralBuyStrong buy
Displays a symbol's price movements over previous years to identify recurring trends.