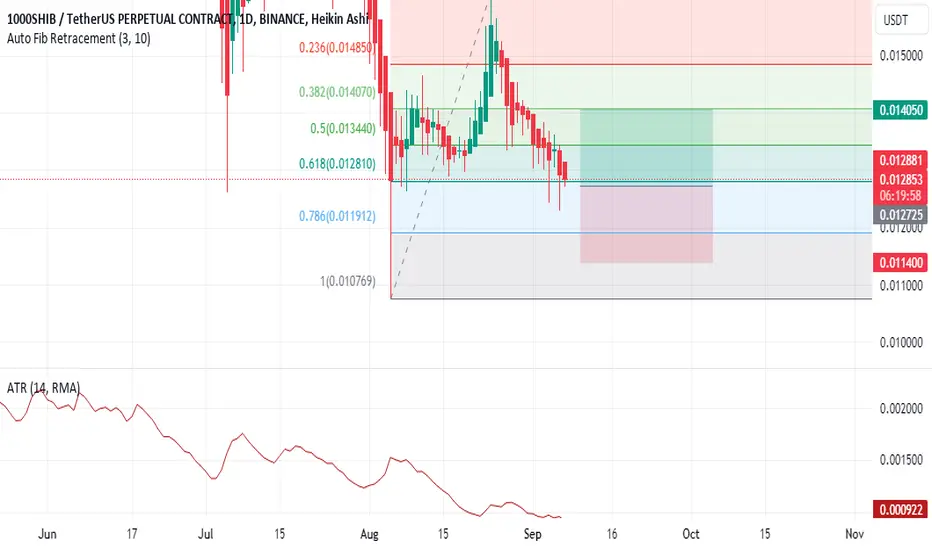
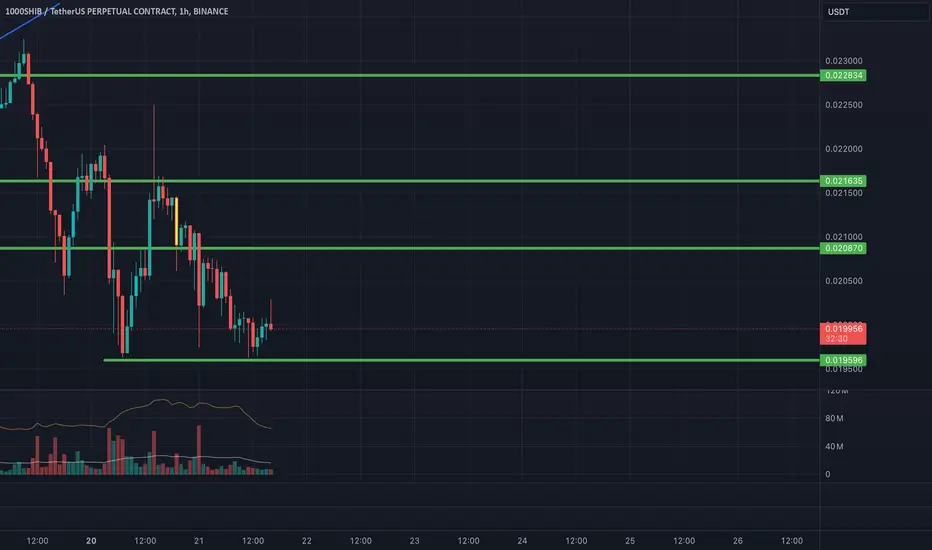
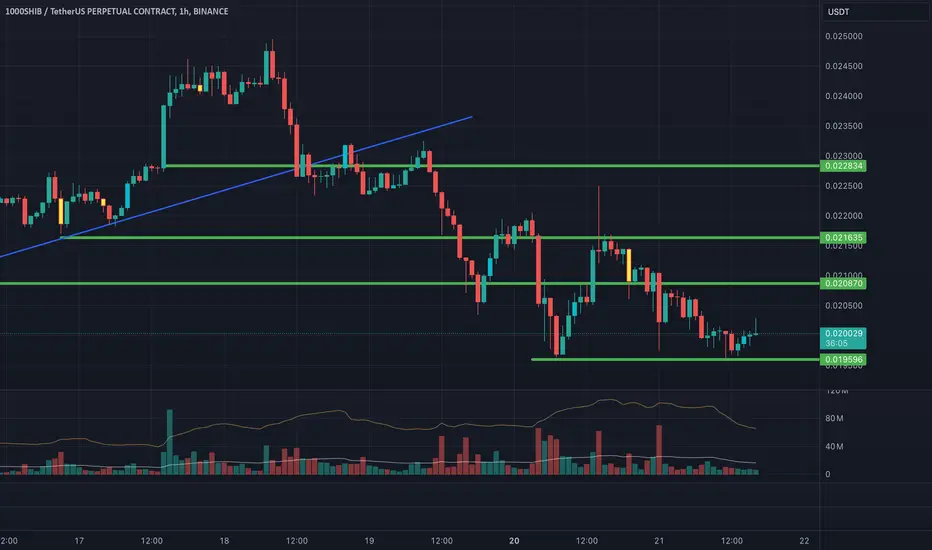
1000Shib Short ideaBased on trend analysis price is decreasing.
Bearish flag, decreasing trend.
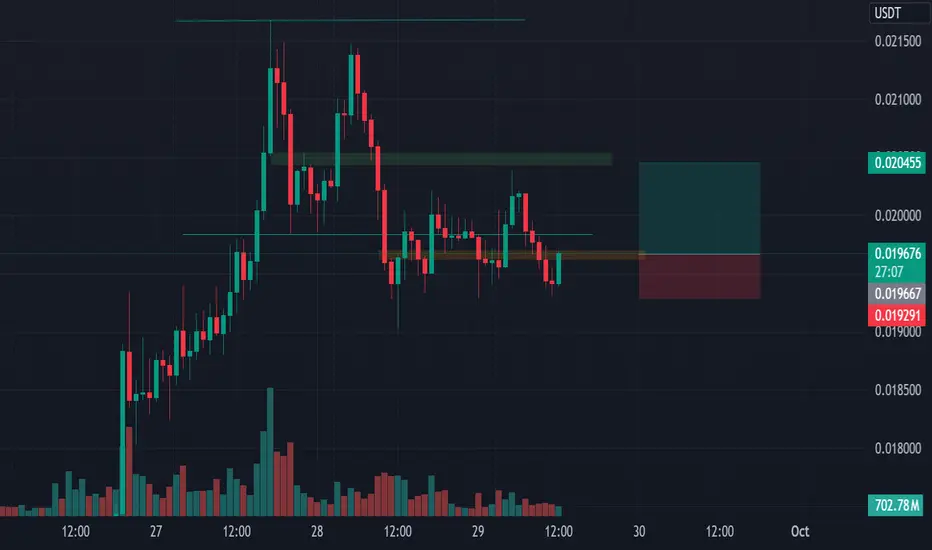
Stop loss 6.4%/ take profit 11.24%.
1000SHIBUSDT.P trade ideas

Support and resistance zone: 0.016987-0.017858
Hello, traders.
If you "Follow", you can always get new information quickly.
Have a nice day today.
-------------------------------------
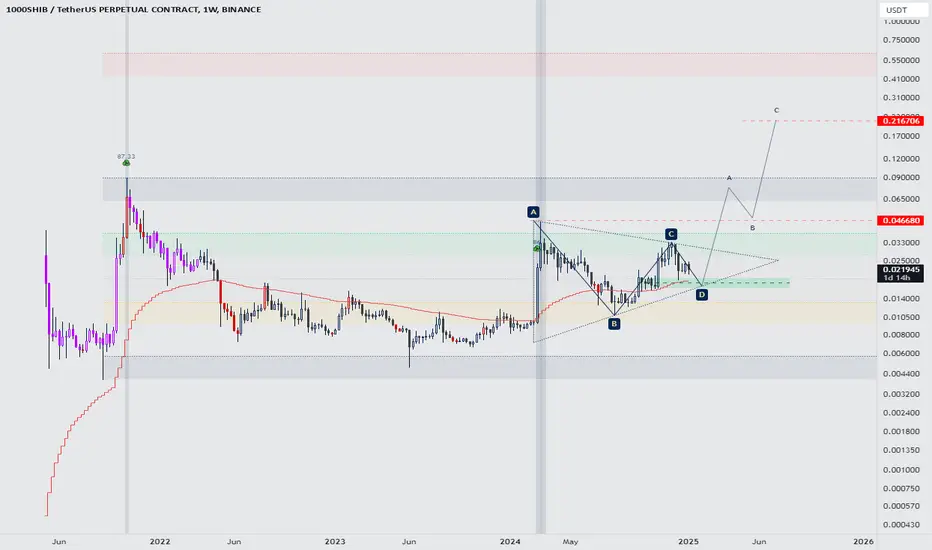
(1000SHIBUSDT.P 1W chart)
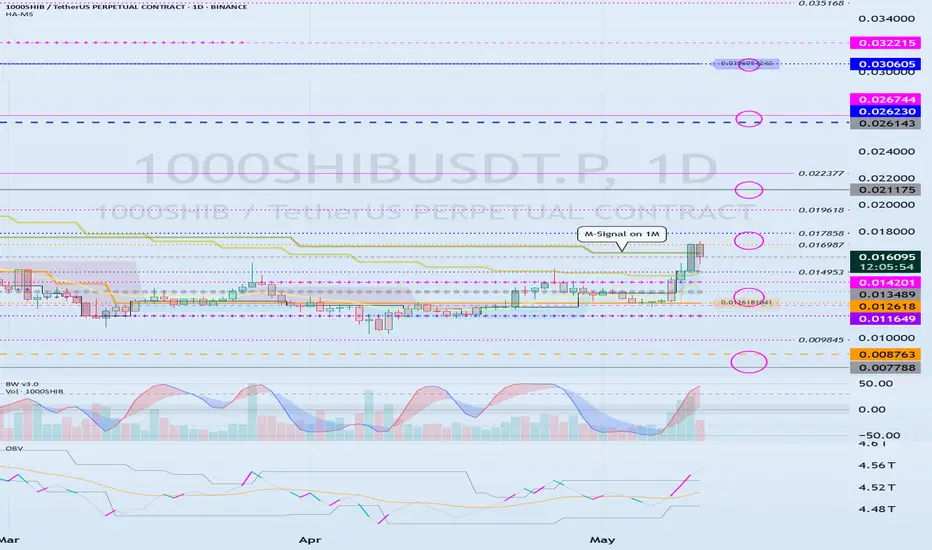
The key is whether the M-Signal indicator on the 1M chart can rise above and maintain the price.
If the price rises above the important zone of 0.021175-0.026744 and maintains, the uptrend is likely to begin.
If it fails to rise, you should check for support near 0.008763.
-
(1D chart)
In order to maintain the price above the M-Signal indicator of the 1M chart, it is important to see if it can rise to the vicinity of 0.016987-0.017858 and receive support.
Since the volume profile section is formed at the point of 0.021175, it is important to see if it can receive support in this section.
If it fails to rise, it is necessary to check for support in the vicinity of 0.012618-0.013489.
-
Since the StochRSI indicator has entered the overbought section, it is expected that the rise will be limited even if it continues to rise further.
Therefore, it is recommended to first check for support in the vicinity of 0.016987-0.017858.
-
Thank you for reading to the end.
I wish you successful trading.
--------------------------------------------------
- Explanation of the big picture.
I used TradingView's INDEX chart to check the entire range of BTC.
I rewrote it to update the previous chart by touching the Fibonacci ratio range of 1.902 (101875.70) ~ 2 (106275.10).
(Previous BTCUSD 12M chart)
Looking at the big picture, it seems to have been maintaining an upward trend following a pattern since 2015.
In other words, it is a pattern that maintains a 3-year upward trend and faces a 1-year downward trend.
Accordingly, the upward trend is expected to continue until 2025.
-
(Current BTCUSD 12M chart)
Based on the currently written Fibonacci ratio, it is displayed up to 3.618 (178910.15).
It is expected that it will not fall again below the Fibonacci ratio of 0.618 (44234.54).
(BTCUSDT 12M chart)
Based on the BTCUSDT chart, I think it is around 42283.58.
-
I will explain it again with the BTCUSD chart.
The Fibonacci ratio ranges marked in the green boxes, 1.902 (101875.70) ~ 2 (106275.10) and 3 (151166.97) ~ 3.14 (157451.83), are expected to be important support and resistance ranges.
In other words, it seems likely that they will act as volume profile ranges.
Therefore, in order to break through these ranges upward, I think the point to watch is whether they can receive support and rise near the Fibonacci ratios of 1.618 (89126.41) and 2.618 (134018.28).
Therefore, the maximum rising range in 2025 is expected to be the 3 (151166.97) ~ 3.14 (157451.83) range.
In order to do that, we need to see if it is supported and rises near 2.618 (134018.28).
If it falls after the bull market in 2025, we don't know how far it will fall, but based on the previous decline, we expect it to fall by about -60% to -70%.
Therefore, if it starts to fall near the Fibonacci ratio 3.14 (157451.83), it seems likely that it will fall to around Fibonacci 0.618 (44234.54).
I will explain more details when the bear market starts.
------------------------------------------------------
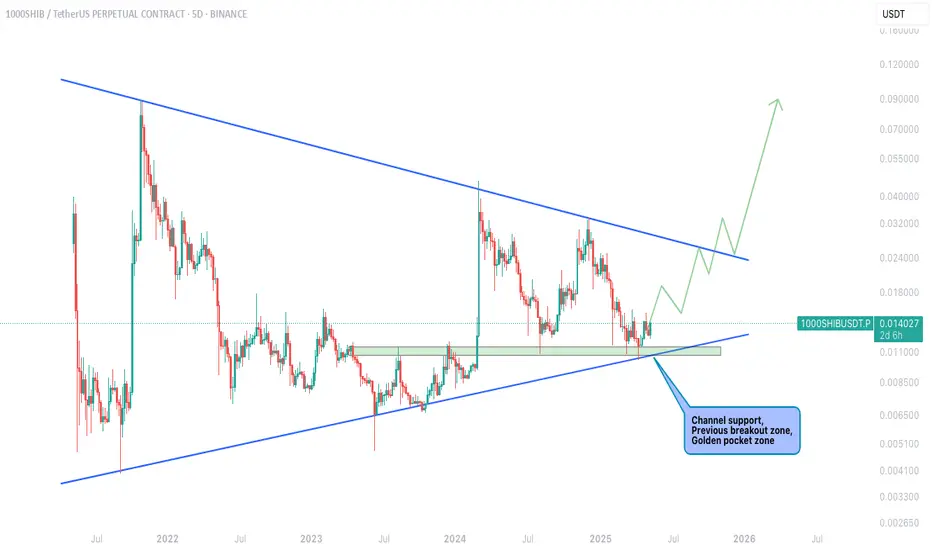
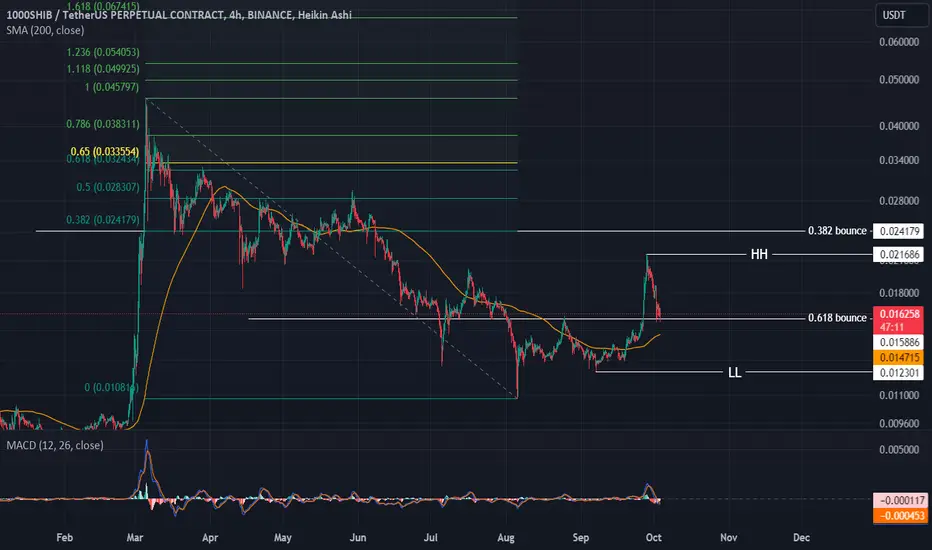
SHIBUSDT – Perfect Confluence Zone Holding Strong!CRYPTOCAP:SHIB has just bounced from a critical confluence zone, combining:
✅ Channel support
✅ Previous breakout zone
✅ Golden pocket retracement
This triple-layered support has historically acted as a powerful launchpad, and the price is already showing early signs of strength.
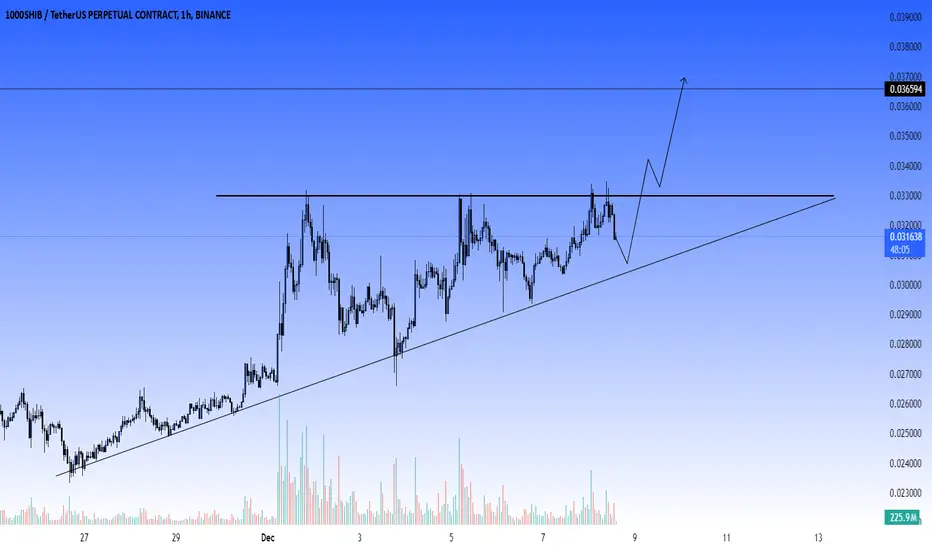
The price structure is tightening inside a long-term wedge, and a breakout from the upper resistance trendline could trigger a massive upside leg.
First breakout test near 0.024
Potential long-term move toward 0.07+
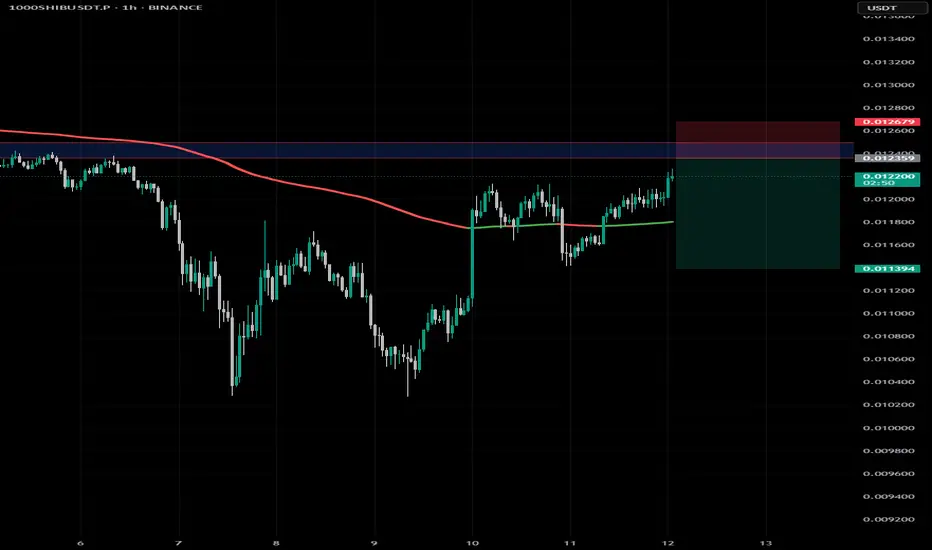
In shorter timeframe, CRYPTOCAP:SHIB broke out of its long-standing falling wedge pattern and is now retesting the breakout zone. With bullish volume creeping in, this move could ignite a powerful trend reversal toward the 0.0000239 zone. Ideal structure for spot entries with defined risk!
SHIB could be coiling for something massive. Keep an eye on structure and volume.
If you find this analysis helpful, please hit the like button to support my content! Share your thoughts in the comments, and feel free to request any specific chart analysis you’d like to see.
SHIBUSDT.P SHORT/SELL SETUPHello, TradingView community and my subscribers, please if you like ideas do not forget to support them with your likes and comments, thank you so much and we will start a SHORT/SELL outlook on #1000SHIBUSDT.P explained
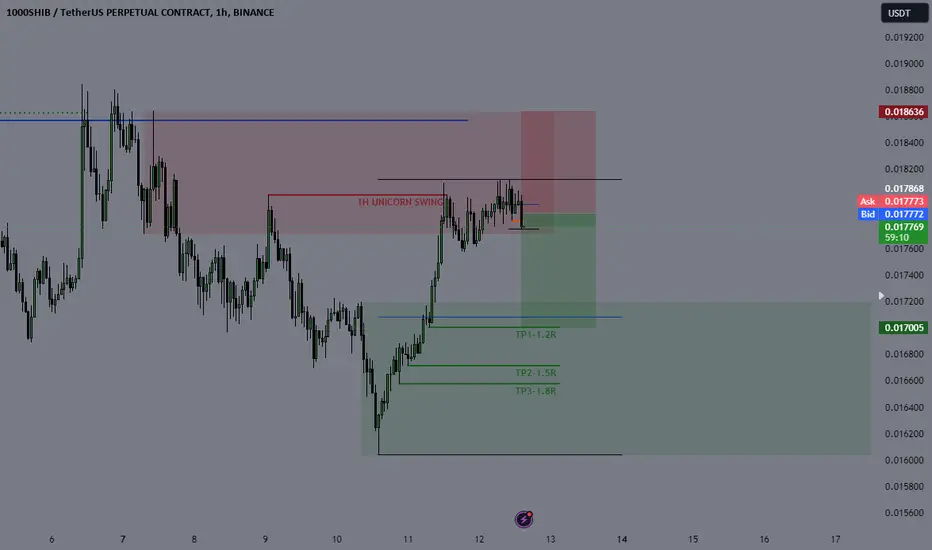
1000SHIB Ready for a Massive Move? Key Support Holding Strong! 🔍 Market Analysis & Trade Opportunity
The ( BINANCE:1000SHIBUSDT.P ) pair is sitting at a critical support zone, showing signs of potential reversal. With buyers stepping in and multiple rejections forming, this level could act as a launchpad for the next bullish rally.
🧐 Why This Setup is Important?
✅ Strong Support Zone: Price is testing a key demand area that has historically led to strong bounces.
✅ Rejection Wicks: Sellers tried pushing the price lower, but buyers are stepping in aggressively.
✅ Potential Bullish Move: If this support holds, we could see a rally toward major resistance levels.
📌 Key Levels to Watch:
🔹 Support Holding: Grey Box
🔹 Breakout Targets:
TP1: 0.012665
TP2: 0.013221
TP3: 0.013797
TP4: 0.014465
TP5: 0.015661
🚨 Stop Loss (SL): 0.011777 / 4H CC (To manage risk effectively)
🔥 Will 1000SHIB Bounce or Break Down?
This level is make-or-break for SHIB! If support holds, it could trigger a major rally. But if it fails, lower levels could come into play.
👀 What’s your bias? Are you bullish or bearish? Drop your thoughts in the comments! ⬇️
🚀 CMP Crypto Insights – Stay tuned for more premium trade setups & market updates! 🚀
🔥Don't forget to press the 🚀 Boost button to support me—every boost helps! 💙

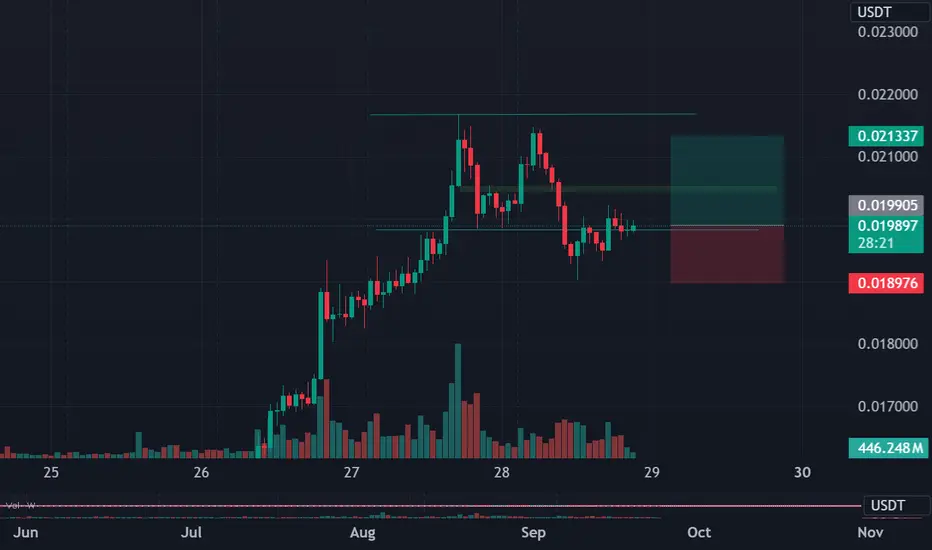
SHIB1000USDT: Reversal or Breakdown?
📉 BYBIT:SHIB1000USDT.P is currently trading at a critical support zone around 0.019900 USDT . After multiple tests of this level, buyers are stepping in, but is it enough to trigger a rally?
---
🔑 Key Levels:
Support:
0.018347 USDT — the last support level, a breakdown here could lead to further downside.
0.019825 USDT — current liquidity accumulation area.
Resistance:
0.022000 USDT — the first target in case of a bounce.
0.026403 USDT — a liquidity zone that could act as a magnet if the price breaks through local resistances.
---
🚩 Trading Strategy:
Entry Point:
- Consider a long position if 0.019825 USDT holds with increasing volume.
Stop-Loss:
- Below 0.018347 USDT to minimize risks in case of a breakdown.
Take-Profit Targets:
0.022000 USDT — first target for partial profit-taking.
0.026403 USDT — potential target if a bullish impulse kicks in.
---
📈 Technical Analysis:
The price is testing a support level with repeated buyer reactions.
A breakout could trigger a recovery phase with potential movement towards 0.026403 USDT.
If the support fails, a drop to 0.018347 USDT is likely.
---
💡 Conclusion:
The price is at a crossroads: a bounce could yield great profits, but a breakdown could spell trouble. Stay alert! What’s your take? Waiting for a retest or already in? Let’s discuss in the comments! 🚀
CHoCH (Change of Character) in Crypto TradingWhat is CHoCH?
CHoCH (Change of Character) is a concept from Smart Money Concept (SMC) used in technical analysis. It signals a shift in market behavior and often marks the beginning of a new trend phase, whether a trend reversal or consolidation.
Unlike Break of Structure (BoS), which confirms trend continuation, CHoCH indicates a potential change in direction.
---
How to Identify CHoCH?
1. In an Uptrend:
Price forms Higher Highs (HH) and Higher Lows (HL).
If the price breaks the last HL but fails to create a new HH, this is CHoCH, signaling a potential bearish reversal.
2. In a Downtrend:
Price forms Lower Lows (LL) and Lower Highs (LH).
If the price breaks the last LH but does not form a new LL, this is CHoCH, suggesting a bullish reversal.
---
How to Trade CHoCH?
CHoCH is a powerful tool for spotting trend weakness and entering trades early.
1. Spotting Trend Weakness:
In an uptrend, if the price fails to make a new HH and breaks the last HL, a trend shift might be occurring.
In a downtrend, if the price fails to form a new LL and breaks the last LH, expect bullish momentum.
2. Entry Strategies After CHoCH:
Wait for confirmation with a retest of the key level.
Use volume indicators to check if the breakout is significant.
Enter the trade after the retest of the broken support/resistance level.
3. Combining CHoCH with Other Tools:
CHoCH works well with Order Blocks, Liquidity Zones, and Fair Value Gaps (FVG).
Volume analysis helps confirm institutional activity in the trend change.
---
CHoCH Trading Example
Imagine an uptrend where price forms Higher Highs (HH) and Higher Lows (HL). Suddenly, the price fails to create a new HH and breaks the last HL. This is CHoCH, suggesting a potential shift from bullish to bearish.
💡 Traders can use this signal to exit long positions and prepare for short setups.
Potential to reach New ATHshibausdt BINANCE:SHIBUSDT
Considering Shiba's weekly price movement, it has the potential to reach a new all-time high (ATH) again. Let's wait and see
Fresh Demand Zone IdentifiedDespite potential year-end challenges in the crypto market, it’s crucial to plan for buying scenarios to navigate adverse conditions. For SHIBUSDT, the fresh demand zone highlighted on the chart represents the strongest remaining support level, where buyers are likely to step in.
This zone offers a strategic entry point for long positions. Monitor closely for price reactions and confirm trades with lower time frame signals. Always manage risk effectively in uncertain market conditions.
I keep my charts clean and simple because I believe clarity leads to better decisions.
My approach is built on years of experience and a solid track record. I don’t claim to know it all, but I’m confident in my ability to spot high-probability setups.
My Previous Analysis
🐶 DOGEUSDT.P: Next Move
🎨 RENDERUSDT.P: Opportunity of the Month
💎 ETHUSDT.P: Where to Retrace
🟢 BNBUSDT.P: Potential Surge
📊 BTC Dominance: Reaction Zone
🌊 WAVESUSDT.P: Demand Zone Potential
🟣 UNIUSDT.P: Long-Term Trade
🔵 XRPUSDT.P: Entry Zones
🔗 LINKUSDT.P: Follow The River
📈 BTCUSDT.P: Two Key Demand Zones
🟩 POLUSDT: Bullish Momentum
🌟 PENDLEUSDT: Where Opportunity Meets Precision
🔥 BTCUSDT.P: Liquidation of Highly Leveraged Longs
🌊 SOLUSDT.P: SOL's Dip - Your Opportunity
🐸 1000PEPEUSDT.P: Prime Bounce Zone Unlocked
🚀 ETHUSDT.P: Set to Explode - Don't Miss This Game Changer
🤖 IQUSDT: Smart Plan
⚡️ PONDUSDT: A Trade Not Taken Is Better Than a Losing One
💼 STMXUSDT: 2 Buying Areas
🐢 TURBOUSDT: Buy Zones and Buyer Presence

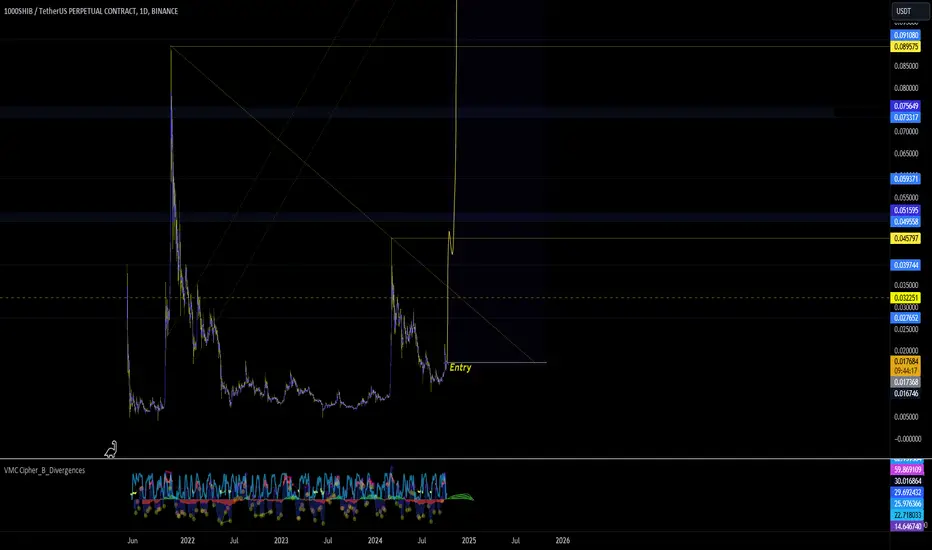
SHIB Swing Long Idea -SHIBA Memecoin TrendSHIB is the second-largest memecoin of all time, and I believe it hasn't reached its full potential yet. We've recently seen huge rallies in DOGE and BONK (refer to my previous analysis, where we captured over a 50% rise in BONK in just two days). I expect SHIB and DOGE to continue surging in the coming weeks. Notably, SHIB hasn’t reached its Spring 2024 high yet, unlike other memecoins, which gives me additional confidence that SHIB has much more room to grow.
Technical Analysis: Price is rebounding from a monthly demand zone and has created a weekly demand zone by breaking the bearish trendline that has governed the downtrend since Spring 2024.
I'm expecting a retracement back to the weekly demand (marked as the purple zone), which aligns with the Optimal Trade Entry (OTE). It may retrace as far as the trendline, or it may not. I'll be looking for confirmations within the purple zone, labeled 'Max Discount Zone.
SL: 0.0152
TP: 0.0456 (Spring 2024 high)

SHIBUSDT Bullish Move Confirmed!SHIBUSDT technical analysis update
SHIB's price has broken the trend resistance line and made a new higher high on the daily chart. Additionally, it has crossed above the 100 EMA on the daily timeframe, which is considered a strong bullish signal for SHIB.
We could potentially see a 100-200% bullish move in SHIB over the next few months.

Shiba to All Time HighI believe Shiba Inu is poised to reach its all-time high. Bitcoin reaching a new ATH is the major catalyst here, and it’s currently forming a valid higher low, though it’s not very obvious. I think the current setup will push BTC above $80,000 in the near future.
Shiba Inu is the flagship memecoin, which had one of the greatest pumps back in 2021. In March, we also saw it move sharply, mimicking the velocity of the 2021 pump. It has had a strong accumulation phase, and this community project has been developing a great ecosystem over the past few years.
Take profit levels:
TP1: 0.11466
TP2: 0.30848
TP3 (potential short): 0.36021
Shiba moves in a way that is groundbreaking compared to the rest of the altcoins. Once it runs, it becomes unshortable, and many people end up getting burned in the process.
Enjoy the ride!
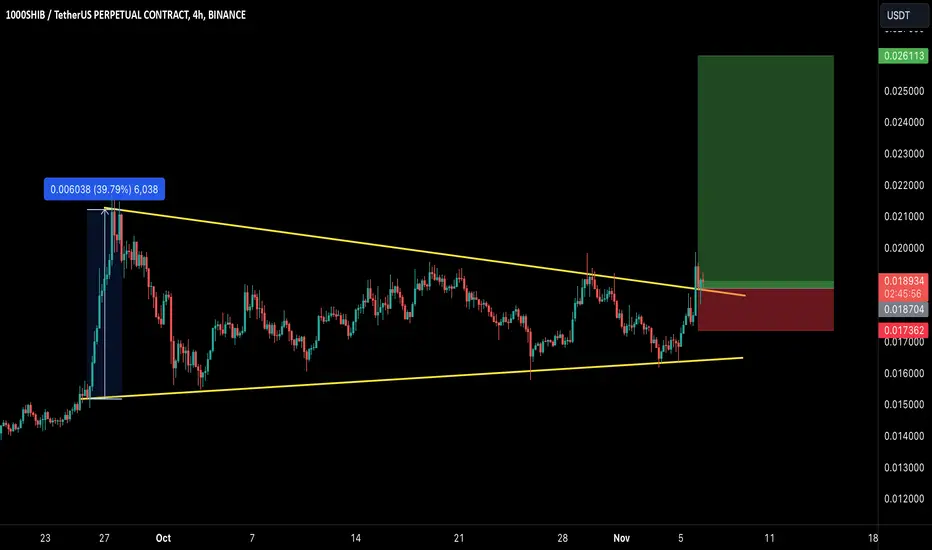
SHIB/USDT: BREAKOUT ALERT! LONG TRADE SETUP!!Hey everyone!
If you’re finding value in this analysis, don’t forget to hit that 👍 and follow for more updates!
SHIB is looking strong! It’s broken out of the symmetrical triangle on the 4-hour time frame, with a successful retest. Consider a long at the current price, adding more on dips.
Entry range: Current Price (CMP) and up to $0.0183
Targets: $0.0209 / $0.0224 / $0.0245 / $0.0262
Stop Loss: $0.0174
Leverage: Low leverage (Max 5x)
What’s your take on SHIB’s price action? I’m seeing a solid bullish setup here! Share your insights and analysis in the comments below!
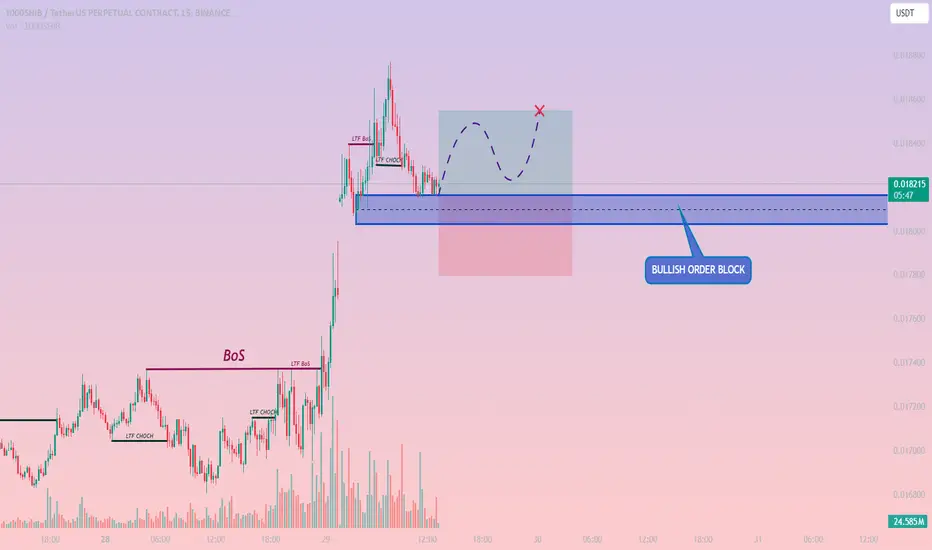
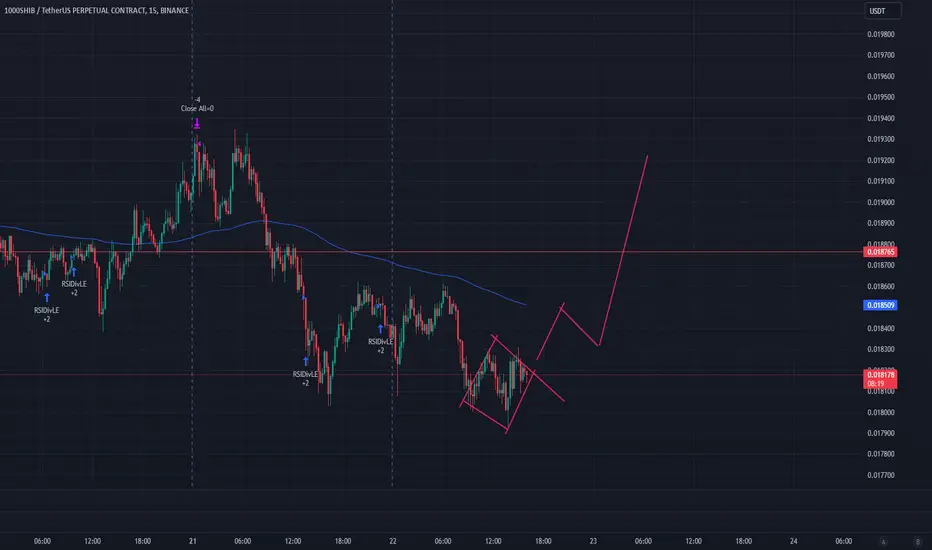
1000SHIBUSDT / LONG / M151000SHIBUSDT may rise from the Bullish Order Block
Bullish Order Block: 0.18288 and 0.18141
1000SHIBUSDT has potential for an upward move from the bullish order block, with high probability of profitability based on the analysis. I used Smart Money Concepts (SMC) to review the charts, which suggest a promising rise from this level. Let’s see how the price reacts!
1000SHIBUSDT / LONG / M15
LEVERAGE :- 75X
Entry Price :- 0.018304
Take Profit :- 0.018953
Stop Loss :- 0.017654
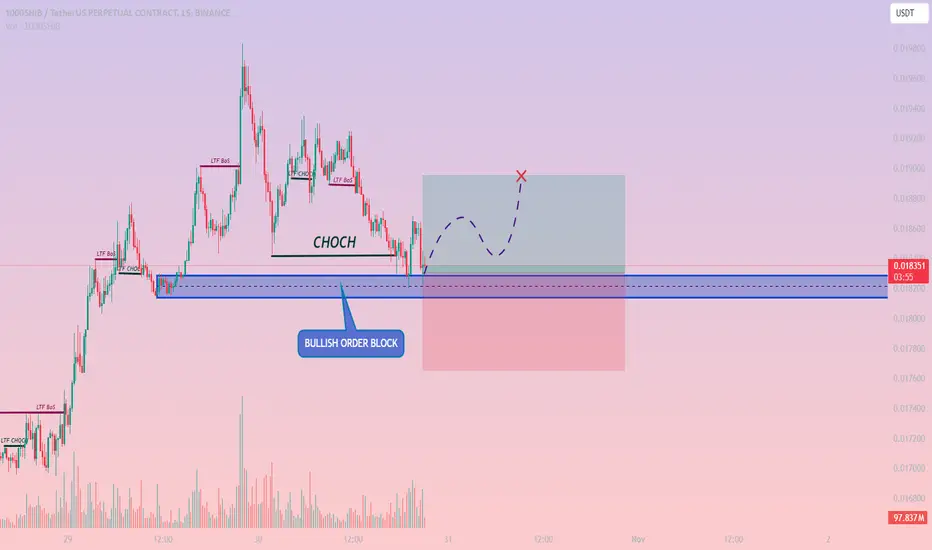
1000SHIBUSDT / LONG / M151000SHIBUSDT may rise from the Bullish Order Block
Bullish Order Block: 0.018163 and 0.018031
The 1000SHIBUSDT pair may experience an upward movement from the bullish order block. There’s a strong probability of a profitable outcome on this trade. Let's observe how the price reacts in this zone.
1000SHIBUSDT / LONG / M15
Leverage :- 50x
Entry Price :- 0.018163
Take Profit :- 0.018546
Stop Loss :- 0.017798
shib bullish diamondtoday i spotted a bullish diamond on shiba inu, and i hope to make some profits out of it, this is for educational pourposes only, good luck
SHIB SHORT IDEA - 1000SHIB FUTURES SHORTPrice hit to supply zone and looks pretty heavy imo. LTF market structer shifted and it gave me confident to enter short side. I am also awaiting bitcoin to drop a litle (see my bitcoin chart on my profile) so they can work together.
Targets can be seen on the chart.
Nothing i share is financial advice. Education purposes only.
1000SHIB 4HR TF1000SHIB Bounce Play
MA 200 Strong Support
Breakout Retest
0.618 Fibb Bounce
Bullish Divergence
We are seeing Spring OR msow on action ! It's no brainier for me not to take Long from here.
But always as i saw take smaller % because confirmation haven't happened yet.

TRADING STRATEGY FOR 1000SHIBI think it needs to make an attack from here for 1000shib, which is approaching the daily Fibo average.