Long Position on 1000SHIBUSDT / (Volume Projection)BINANCE:1000SHIBUSDT.P
PHEMEX:1000SHIBUSDT.P
SL2 ---> Mid-risk status: 5x-8x Leverage
SL1 ---> Low-risk status: 3x-4x Leverage
👾The setup is active but expect the uncertain phase as well.
⚡️TP:
0.013409
0.013570
0.013720
0.013830
0.013990
0.014190(In Optimistic Scenario)
➡️SL:
0.01268
0.01237
🧐The Alternate scenario:
🔴If the price stabilizes below the trigger zone, the setup will be cancelled.
1000SHIBUSDT.P trade ideas

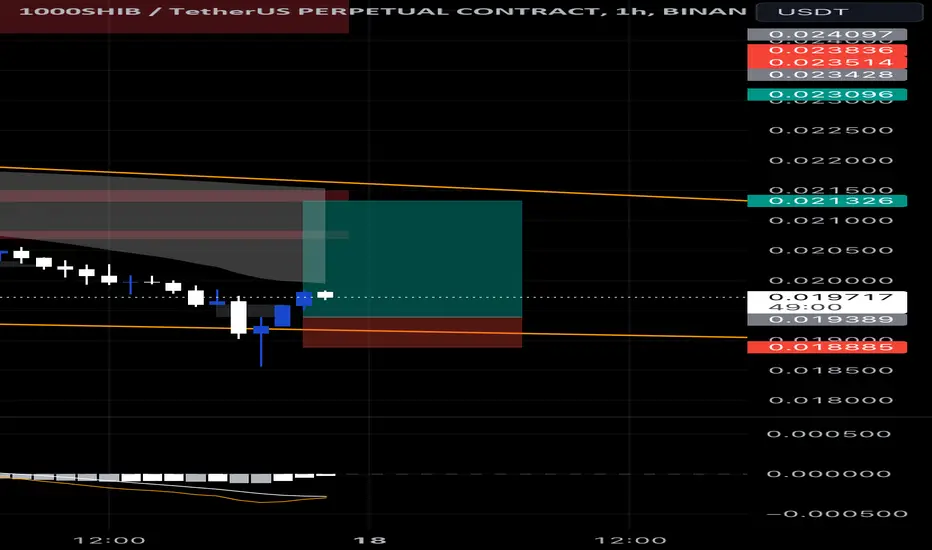
Shib analysisI’m entering a long as the price bounced on the hourly from the lower trendline from the channel

Shib analysisI’m entering a long as the price bounced on the hourly from the lower trendline from the channel
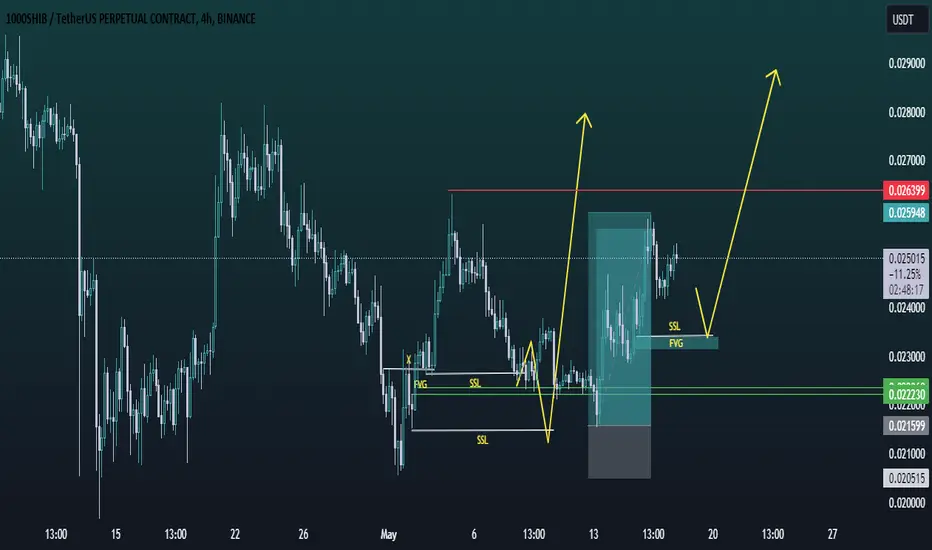
1000SHIB Gearing for a 30% rally!1000SHIB is gearing up for a potential 30% move. With the current price at the support level, SHIB is likely set up for a bounce back.
Entry: $0.0222 to CMP.
Stop Loss: $0.021.
Leverage: 3x to 5x.
Target: 15% to 30%.
Important note: Do not trade with high leverage; always use a stop loss.
Do your own research before investing.
Regards,
Team Dexter.

1000Shib idea update1000shib chart was shared last week and it took marked liquidity, filled entry and pumped hard. Now again I am looking for another liquidity sweep then again a pump. Highlighted on chart.
SHIB analysis for a breakoutHello guys,
I've entered a short position as breakout started to happen in the lower timeframes and this is my plan for this trade.
Stop loss is set to the lower channel and long is set to the high of the channel.
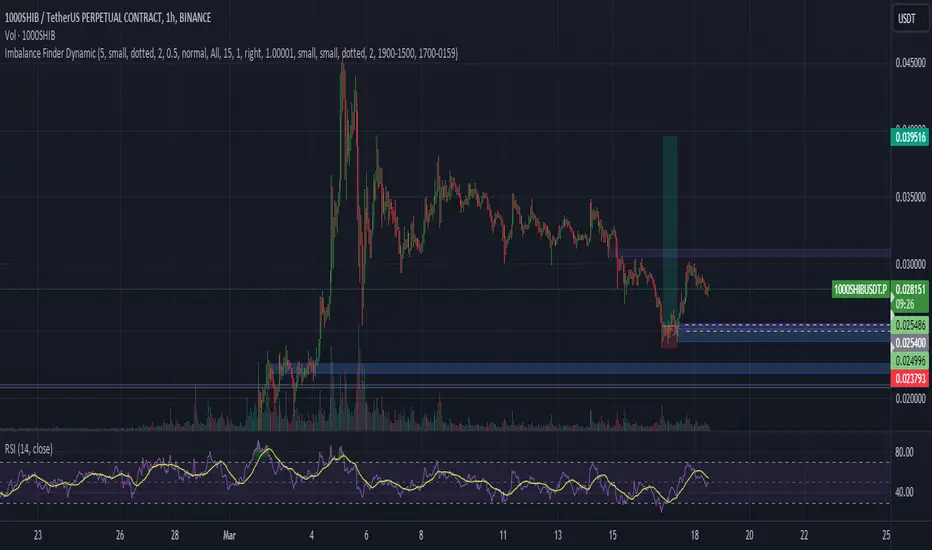
SHIB AnalysisThis is my plan for the day. I'm expecting a breakdown to the downside, as price currently looks very uncertain to keep going up. After breaking this channel I'm expecting a touch to the downtrend. I'll keep you updated if anything changes.
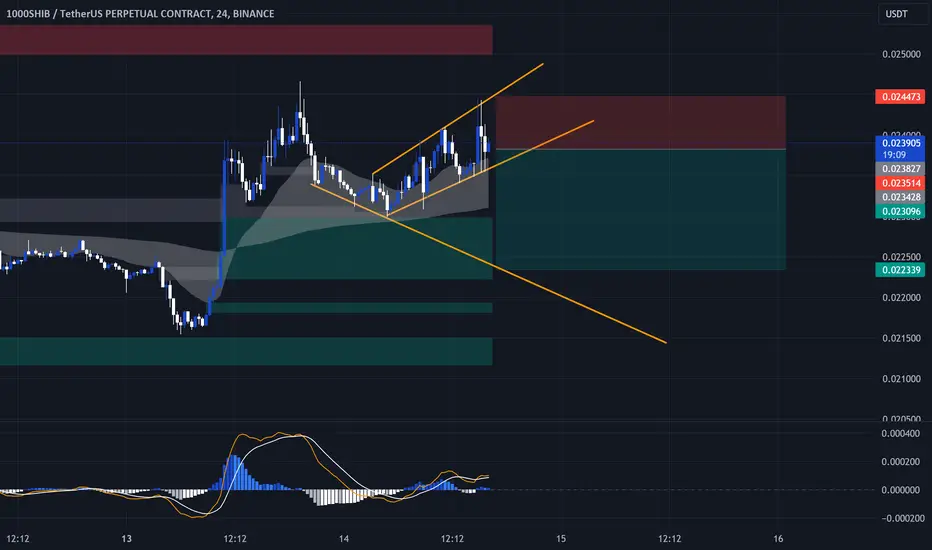
SHIB prediction scalpHello,
My prediction for the SHIB for today. Let's see if this will play out.
I am waiting for a retest of the trendline, which will solidify the meaning of it. From there I am entering a short.
Enter: 0.023340
First target is: 0.023882 retesting the forming resistance
Second target is: 0.024910 - Recent liquidity grab
Trade is invalidated if it breaks below: 0.022903
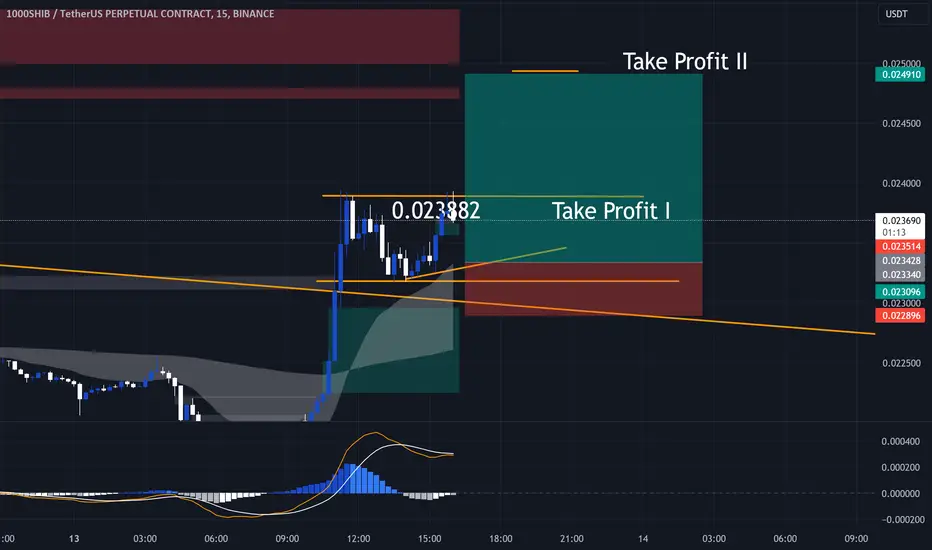
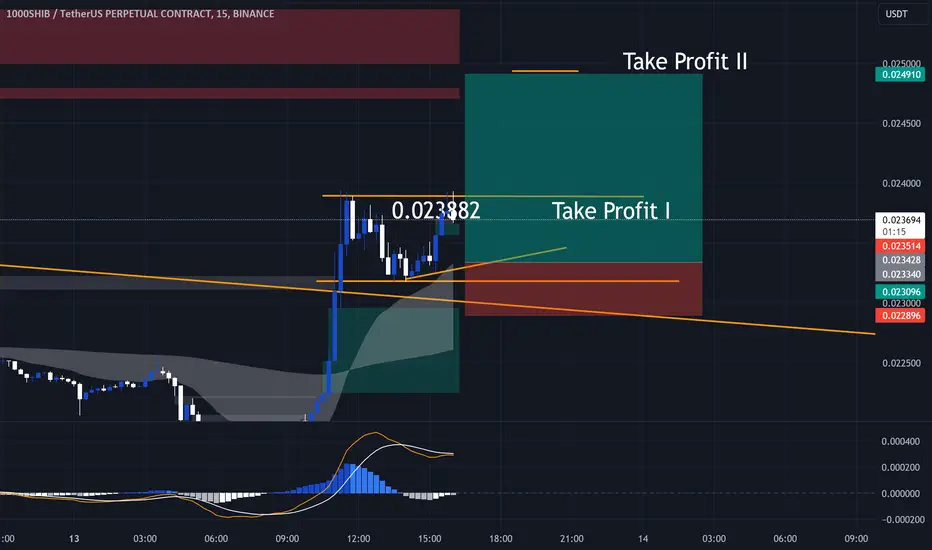
SHIB prediction scalpHello,
My prediction for the SHIB for today. Let's see if this will play out.
I am waiting for a retest of the trendline, which will solidify the meaning of it. From there I am entering a short.
First target is: 0.023882 retesting the forming resistance
Second target is: 0.024910 - Recent liquidity grab
Trade is invalidated if it breaks below: 0.022903
step index forecast derivhey traders , here we share the STEP INDEX . What the your opinion about it? keep comment

BTC and 1000SHIB Weekly Forecast by FOREX HIGHTWelcome to FOREX HIGHT, your trusted source for in-depth weekly forecasts in the exciting world of cryptocurrency trading! Join us as we dive into the dynamic realms of Bitcoin (BTC) and 1000SHIB, providing invaluable insights and predictions to help you stay ahead in the crypto game.
In this episode, our seasoned analysts meticulously dissect the charts, exploring the latest trends, key support and resistance levels, and potential catalysts shaping the price action of BTC and 1000SHIB for the upcoming week. Whether you're a seasoned crypto enthusiast or just venturing into digital assets, our comprehensive forecast equips you with the knowledge needed to make informed trading decisions.
Don't miss out on the opportunity to capitalize on the volatility of crypto markets. Subscribe now to FOREX HIGHT and unlock the potential for profitable trading strategies in the ever-evolving world of cryptocurrency. Join us on this exciting journey towards financial success!

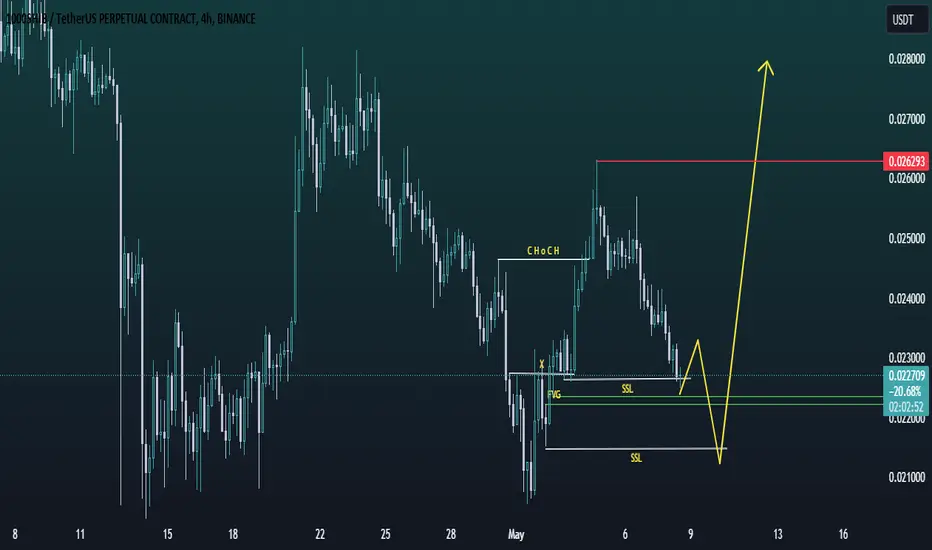
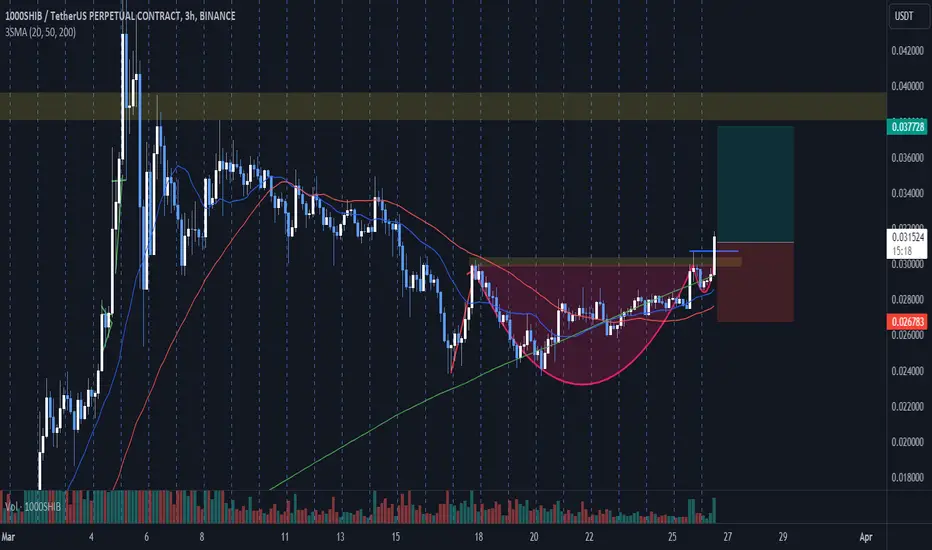
1000shib 4h Analysis1000Shib has done CHoCH on 4H time frame and shifted in trend from bearish to bullish. Now as its in bullish trend so we will look for buying oppertunities. I have marked poi for buying oppertunity. Current price is very good but a agressive entry. Second poi is very clean which is also marked on chart.
THE BLUEPRINT OF SHIBA - NEW ALL TIME HIGH EMERGING
Following through from our previous analysis MEXC:SHIBAUSDT precisely reached the pullback zone I highlighted and bounced approximately 20% immediately putting us on a profitable edge. Now all I can say is good luck on the journey to a new ALL TIME HIGH again for SHIBA on this particular scenario.
Don't forget I have been calling this since $0.08 see analysis below.
Stay updated for any changes that might occur I will be notify you.
PREVIOUS ANALYSIS
OTHER ANALYSIS

Chat patternThis is a chat pattern is called a descending triangle which has a support and once the price breaks the support is signify a Bearish movement in price as you can see on the chart price just break the support which makes the the bears in control of the market at this point in time so we look forward to the next support which slightly might hold. You never can predict the market until you get a signal from the market.
SHIBA ON THE RUN TO A NEW ALL TIME HIGH
From the previous analysis, it is clear that BINANCE:SHIBUSDT is finally bullish and this update is to look for entry at the next retracement which could possibly be the resistance line that will become support. Keep in mind that price might not necessarily kiss the support line perfectly therefore it is good to start accumulating at the $0.02 region and DCA as it goes further.
PREVIOUS ANALYSIS
OTHER ANALYSIS

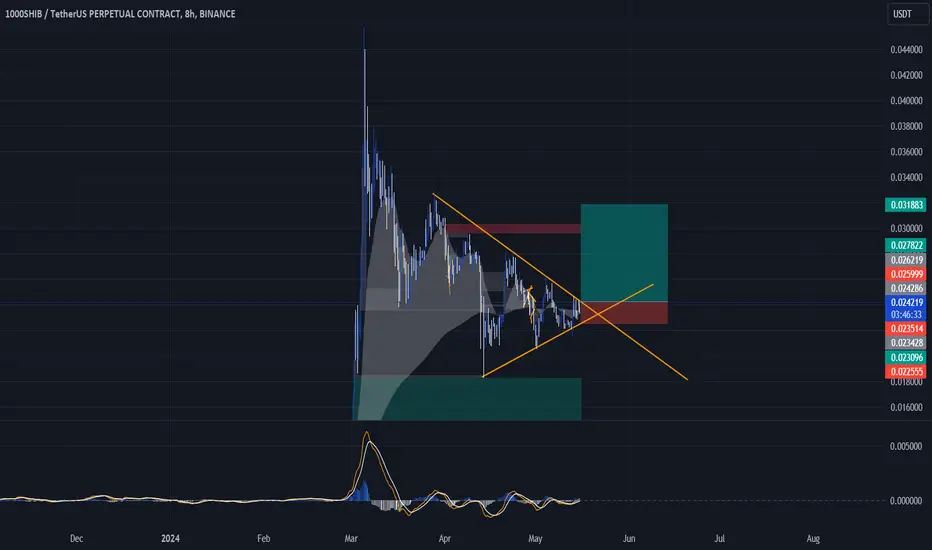
#1000SHIB/USDT#1000SHIB
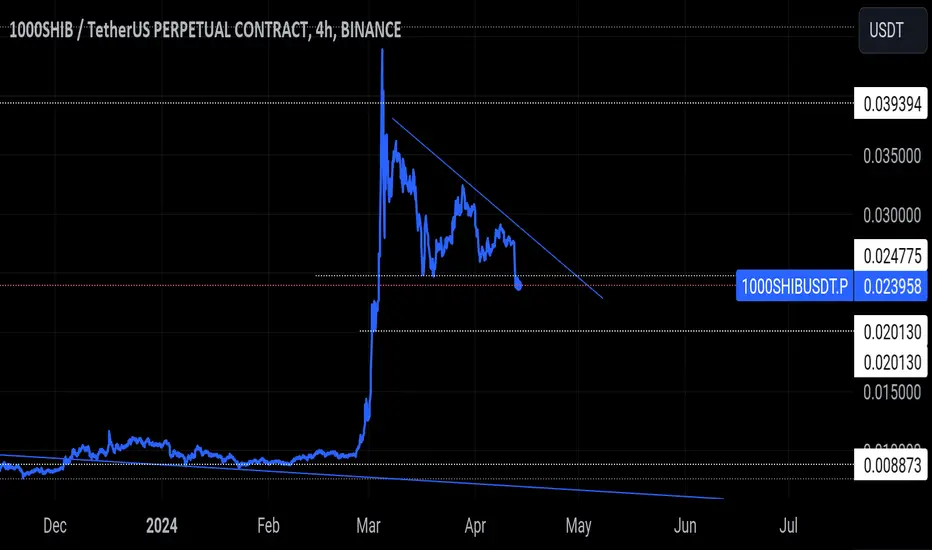
The price is moving in a triangle on the 4-hour frame and we have a green support area at the 0.0300 level
We have a higher stability moving average of 100
We have a breakout of the downtrend about to happen
Our RSI indicator has a downtrend that is about to break higher
Entry price is 0.03200
The first target is 0.03660
The second target is 0.04070
The third goal is 0.04600

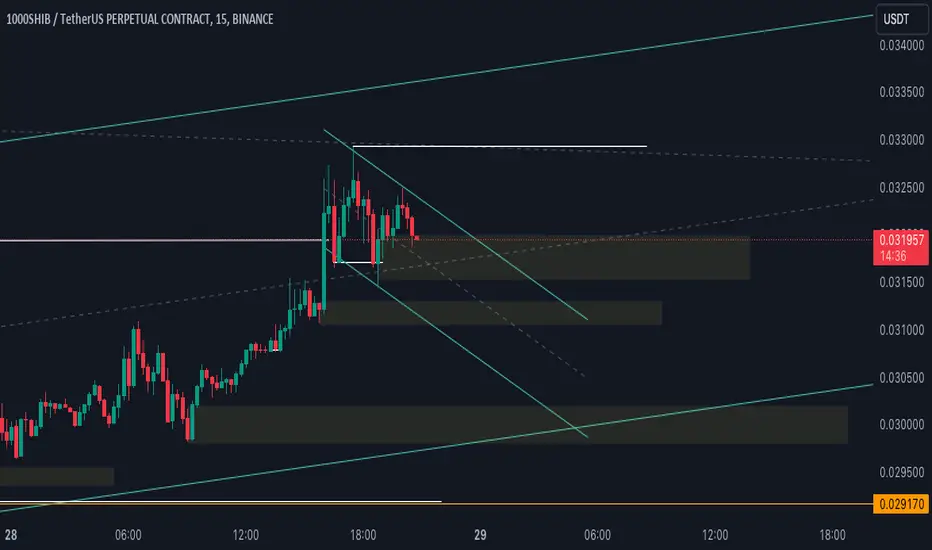
LONG #1000SHIBUSDT price growth with updating of the local maximLONG #1000SHIBUSDT from $0.028991
15m TF. The 1000SHIB instrument has a growing movement pattern. Increased trading activity and volatility indicate that there are participants in the market who are interested in the coin. Despite this, the price does not fall, which indicates the predominance of demand over supply. Consolidation is taking place near the round level of 0.029, and I expect the price to rise with a further update of the local maximum

Shib reaction TargetsYou can see the yellow rectangle boxes where the shib would mostly react from.
Note : 15 mins Time frame Only
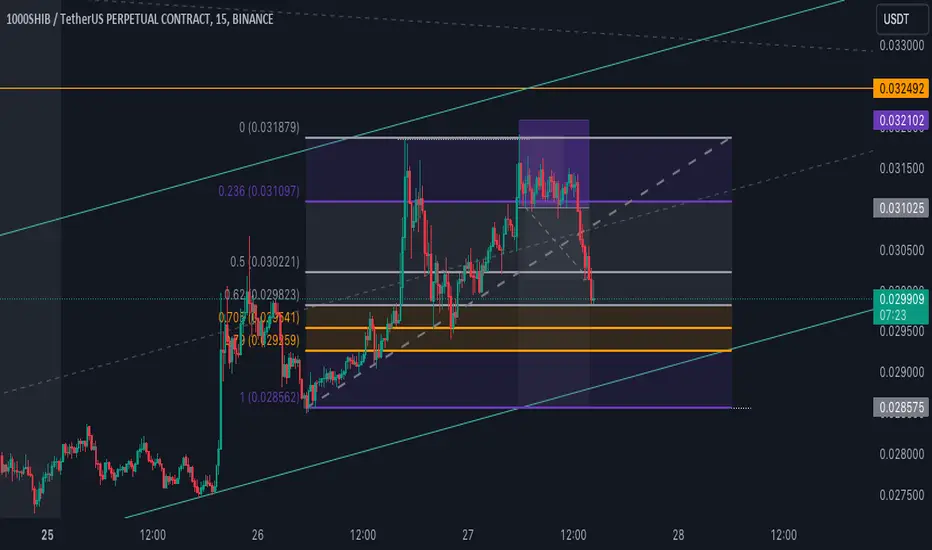
SHIB NEXT POSSIBLE MOVE ACCORDING TO FIB "SHIB NEXT POSSIBLE MOVE ACCORDING TO FIB" appears to be a statement regarding the cryptocurrency Shiba Inu (SHIB) and its potential future price movement based on Fibonacci retracement levels.
Next Possible Move: This suggests a forecast or prediction about the future direction of SHIB's price. In financial markets, analysts often try to anticipate the next move of an asset based on various factors such as technical analysis, market sentiment, and fundamental indicators.
According to Fib: "Fib" likely refers to Fibonacci retracement levels, which are a popular tool used in technical analysis to identify potential levels of support and resistance in a price trend. Fibonacci retracement levels are based on the Fibonacci sequence and ratios (such as 23.6%, 38.2%, 50%, 61.8%, and 100%), which are believed to be significant in predicting potential reversal points in price movements.
Elaborating further, if someone is saying "SHIB next possible move according to Fib," they may be analyzing SHIB's price chart using Fibonacci retracement levels to determine potential support or resistance levels. For example, if SHIB has been in an uptrend and is currently experiencing a pullback, analysts might use Fibonacci retracement levels to identify key levels where the price could find support and potentially resume its upward movement, or conversely, encounter resistance and reverse its trend.
It's important to note that while Fibonacci retracement levels can be useful tools for technical analysis, they are not foolproof predictors of future price movements. Market conditions, news events, investor sentiment, and other factors can also influence the price of an asset. Therefore, any analysis based on Fibonacci retracement levels should be considered alongside other forms of analysis and risk management strategies.
#SHIB possible breakoutIf we see a daily candle above the white trendline we can see a good rally for #SHIB
I'm looking at easy 25% without leverage.
This is only IF the price breakout from the trendline.
DYOR and stay safe! Follow if you enjoy my ideas. Thanks!
SHIBA UPDATE - BULLISH CONTINATION AFTER THIS RETRACEMENTMEXC:SHIBAUSDT almost time to reenter for bullish continuation on the macro timeframe. See previous analysis for context
PREVIOUS ANALYSIS
OTHER ANALYSIS

SHIB LONG TRADE FOR ATHAfter this upwards move i am more confident about future longs
I won't be suprised if price at first clear lows where my SL is and them rocket up.
At green doted bars i place my long orders. If the correction moves keep goin slowly like this, i am very sure about this position.
If someone want to join this train, green doted bars are pretty safe and high RR zones
Minimal tp is marked with my position
Optimal TP is recent height
Main TP is ATH ;)