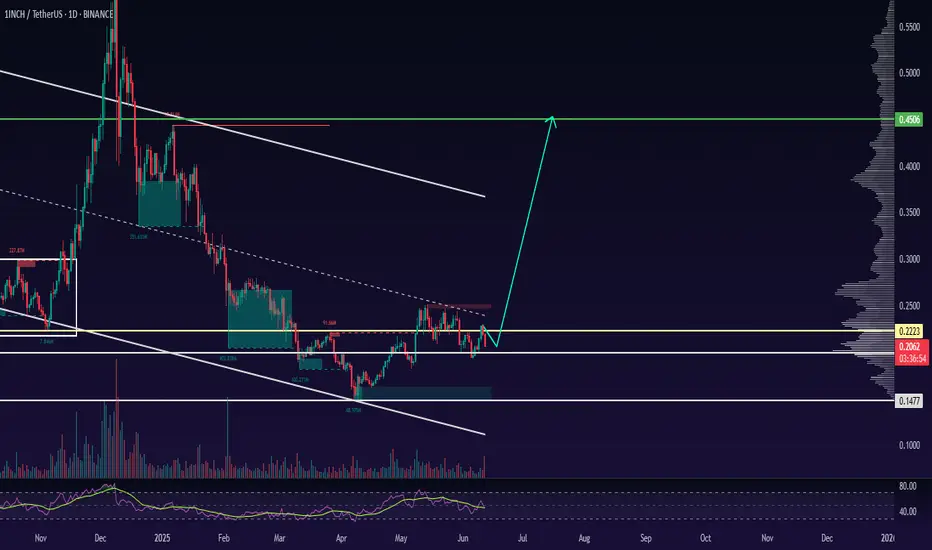
1INCH 1D. Showing Signs of Accumulation. 06/12/25BINANCE:1INCHUSDT There's growing media and social media attention around the 1INCH project, which could be a bullish sentiment trigger.
Currently, the price is trading within a descending channel and has recently bounced from the lower boundary, signaling a potential long entry or spot accumulat
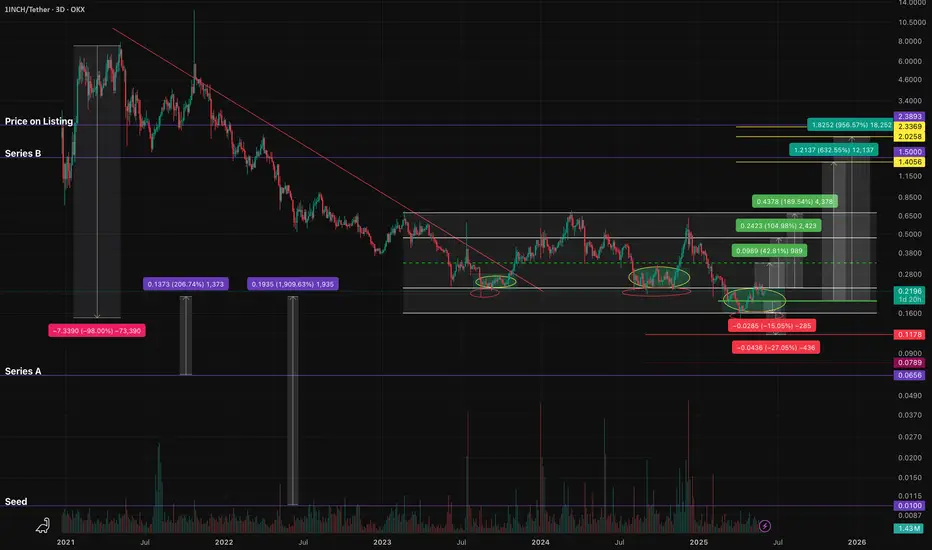
1INCHUSDT - fear zone, return to the channel, growth potential1inch - is a decentralized exchange (DEX) aggregator that combines multiple DEXs into a single platform, aiming to provide users with the most efficient routes for swaps across all platforms.
📍 CoinMarketCap : #160
📍 Twitter(X) : 1.3M
The coin has already been listed on exchanges during the dist
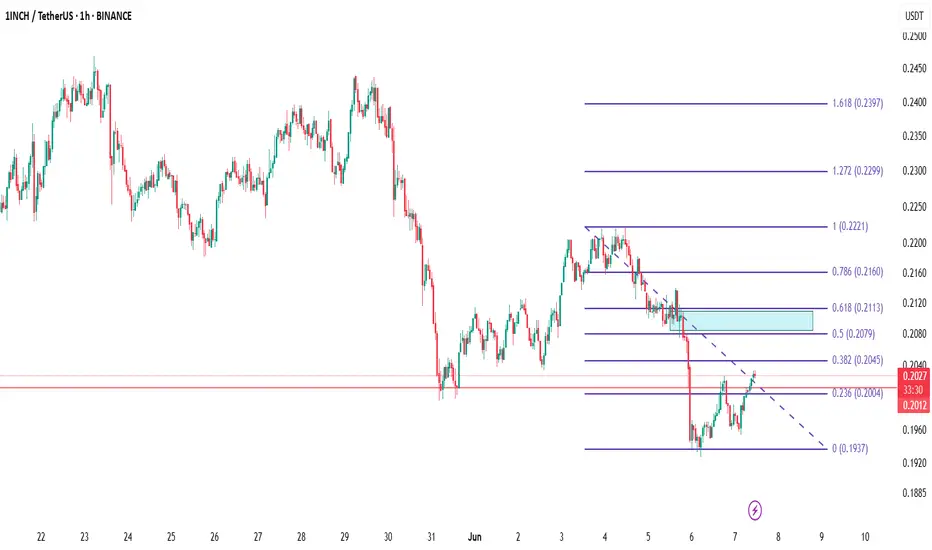
1inch🔍 1INCHUSDT Analysis – 1H Timeframe
After a sharp drop, 1INCH is now retracing toward the 0.5 – 0.618 Fibonacci zone (0.208–0.211) which aligns with a clear supply area (🔵 shaded region). Price is approaching this zone after bouncing off the 0.193 low.
🧱 This area could act as a strong resistance
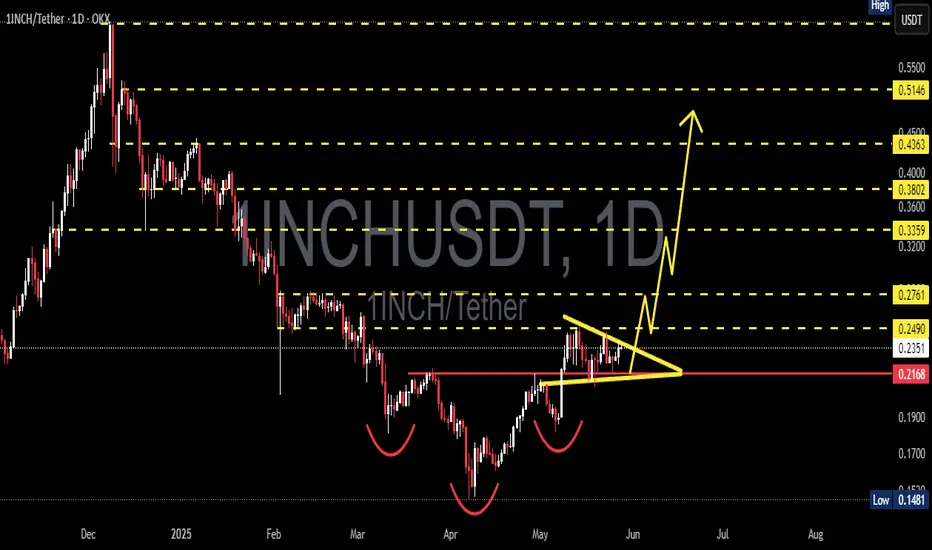
1INCHUSDT 1D Analysis 1INCH ~ 1D Analysis
#1INCH Buy gradually within this pattern with a short-term target of at least 10%++ and a long-term target of $0.63+
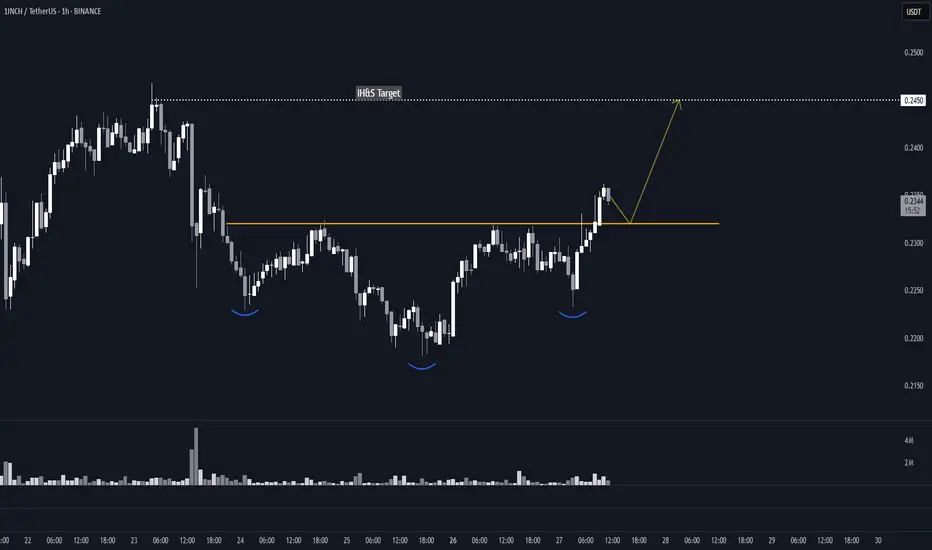
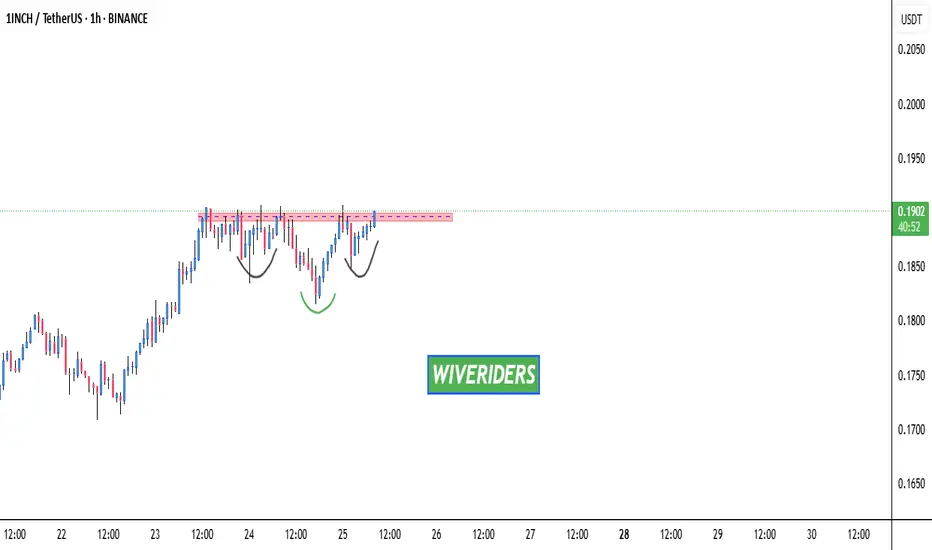
1INCH Inverse Head & Shoulders (1H)BINANCE:1INCHUSDT completed an Inverse Head & Shoulders pattern, clearly visible on the hourly timeframe.
Key Levels
• Left Shoulder: $0.223
• Head: $0.218
• Right Shoulder: $0.223
• Neckline: $0.232
• Measured Target: $0.245 (aligned with local high)
Status
Breakout has already occurred, act
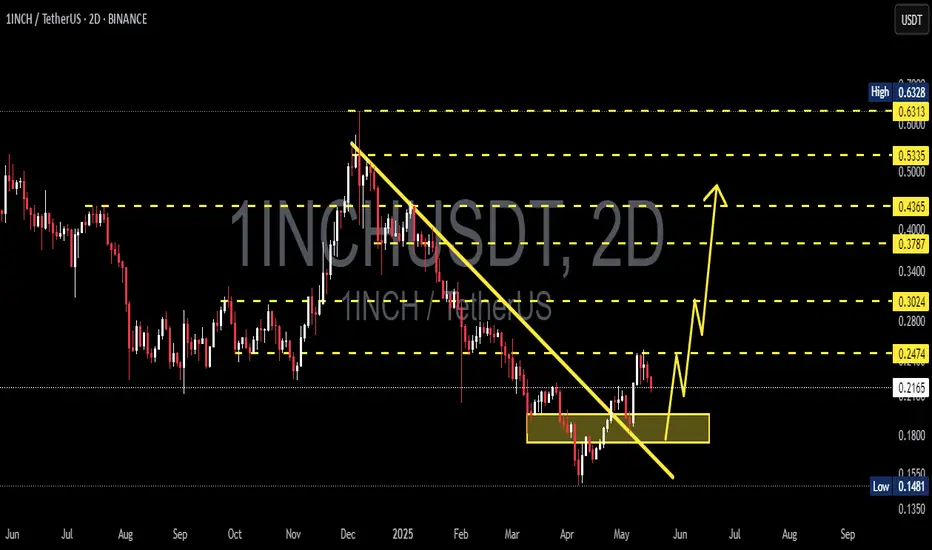
1INCHUSDT 2D Analysis 1INCH ~ 2D Analysis
#1INCH Buy on retest of this support block with short term target of at least 15%+ from here.
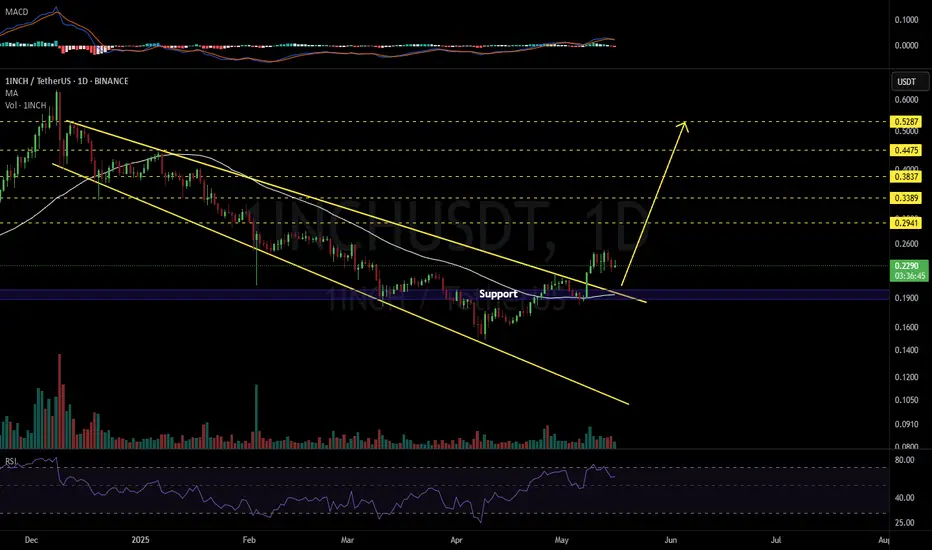
1INCHUSDT 1D#1INCH has broken the descending broadening wedge pattern to the upside on the daily chart. Buy it here and near its support. Targets are:
🎯 $0.2941
🎯 $0.3389
🎯 $0.3837
🎯 $0.4475
🎯 $0.5287
⚠️ Use a tight stop-loss.
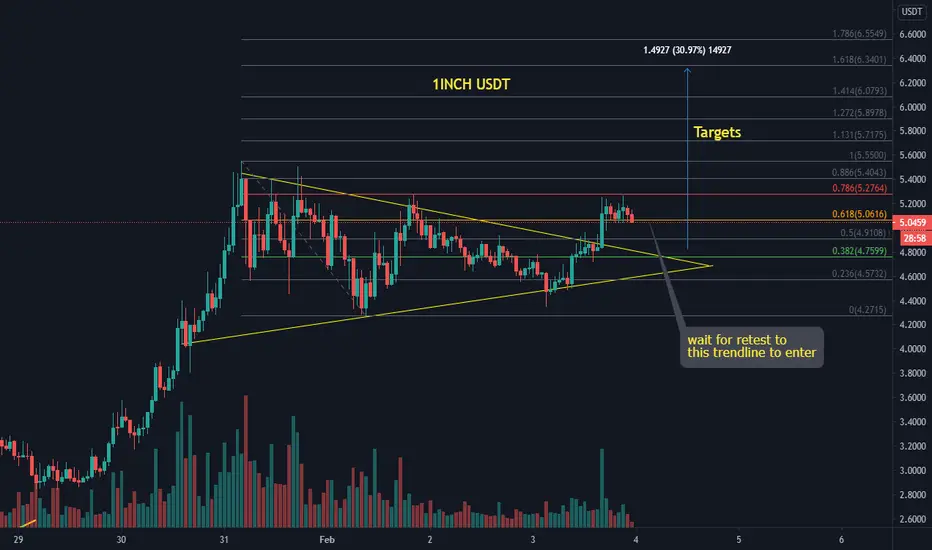
1INCH USDT Bull Pennant, BULLISHBINANCE:1INCHUSDT
1INCH USDT Bull Pennant, BULLISH
TARGETS are fib levels as shown in the chart
1INCH Update – Bullish Inverted H&S!🚨 CRYPTOCAP:1INCH Update – Bullish Inverted H&S! 🚀
👀 CRYPTOCAP:1INCH has formed bullish inverted head and shoulder patterns. Watch for breakout red resistance zone.
🔑 We are waiting for a breakout above the red resistance zone to confirm the bullish inverted head and shoulders pattern.
Ke
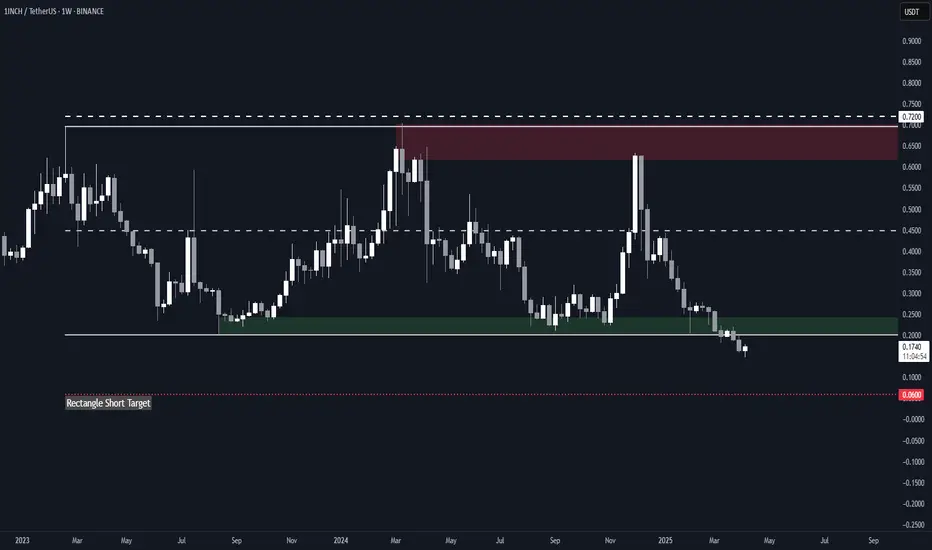
1INCH Rectangle Downside BreakoutLast week, BINANCE:1INCHUSDT fully confirmed a downside breakout from a multi-year rectangle.
If $0.20 isn't reclaimed soon, there is a good chance that the token will head to the $0.06 rectangle target.
Worth watching it, as a failed retest of $0.20 could offer a very good short opportunity, whi
See all ideas
Summarizing what the indicators are suggesting.
Oscillators
Neutral
SellBuy
Strong sellStrong buy
Strong sellSellNeutralBuyStrong buy
Oscillators
Neutral
SellBuy
Strong sellStrong buy
Strong sellSellNeutralBuyStrong buy
Summary
Neutral
SellBuy
Strong sellStrong buy
Strong sellSellNeutralBuyStrong buy
Summary
Neutral
SellBuy
Strong sellStrong buy
Strong sellSellNeutralBuyStrong buy
Summary
Neutral
SellBuy
Strong sellStrong buy
Strong sellSellNeutralBuyStrong buy
Moving Averages
Neutral
SellBuy
Strong sellStrong buy
Strong sellSellNeutralBuyStrong buy
Moving Averages
Neutral
SellBuy
Strong sellStrong buy
Strong sellSellNeutralBuyStrong buy
Displays a symbol's price movements over previous years to identify recurring trends.