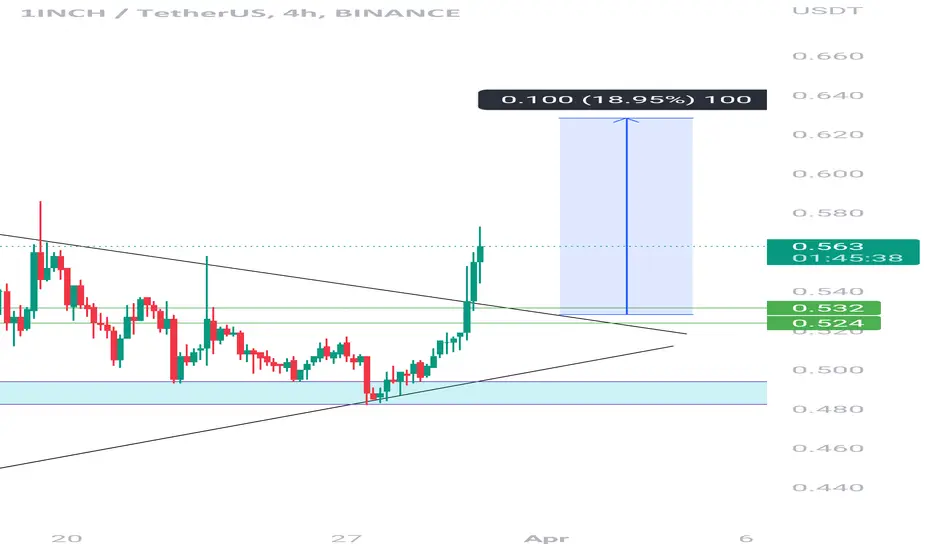
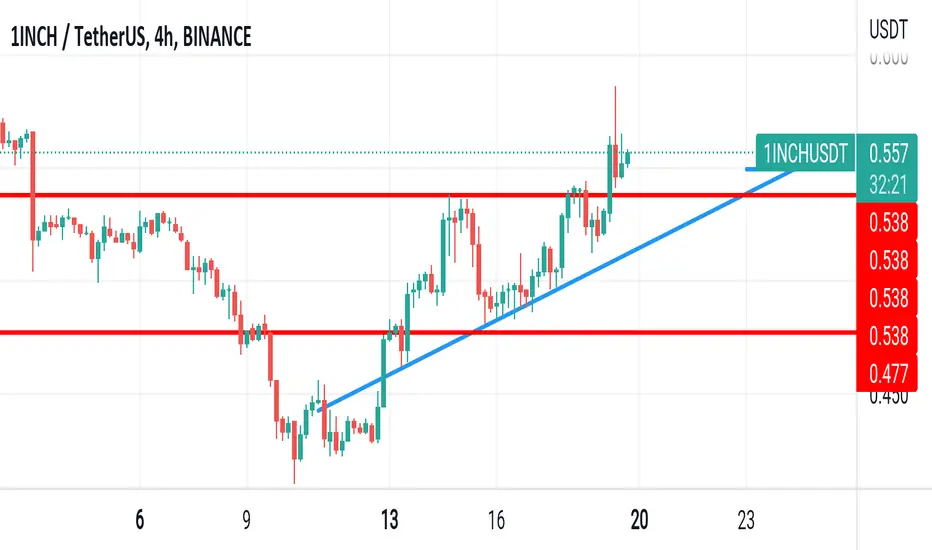
1INCH/USDT - 1inch: Resistance_Breakout_Confirmation◳◱ A Resistance Breakout and Confirmation has been detected on the CRYPTOCAP:1INCH / CRYPTOCAP:USDT chart. The price has broken above a key resistance level and has been confirmed by a strong candle, indicating a potential bullish trend. The next resistance key levels are located at 0.563 | 0.593 | 0.657, and the major support zones can be found at 0.499 | 0.465 | 0.401. Consider entering a trade at the current price zone of 0.565 and targeting higher levels.
◰◲ General info :
▣ Name: 1inch
▣ Rank: 97
▣ Exchanges: Binance, Kucoin, Bybit, Huobipro, Gateio, Mexc
▣ Category/Sector: Financial - Decentralized Exchanges
▣ Overview: The 1inch Network unites three separate decentralized protocols, aggregating liquidity from a variety of decentralized exchanges to facilitate cost-efficient transactions.
Its native token, the 1inch token (1INCH) serves two primary purposes: As a governance token granting voting rights towards the 1inch DAO and as a utility token, where it is used as a connector to achieve high-efficiency routing in the 1inch Liquidity Protocol. It will also be used in the tokenomics of all future protocols developed by the 1inch Network.
◰◲ Technical Metrics :
▣ Mrkt Price: 0.565 ₮
▣ 24HVol: 2,790,670.602 ₮
▣ 24H Chng: 4.63%
▣ 7-Days Chng: 6.72%
▣ 1-Month Chng: 14.98%
▣ 3-Months Chng: 17.08%
◲◰ Pivot Points - Levels :
◥ Resistance: 0.563 | 0.593 | 0.657
◢ Support: 0.499 | 0.465 | 0.401
◱◳ Indicators recommendation :
▣ Oscillators: BUY
▣ Moving Averages: STRONG_BUY
◰◲ Technical Indicators Summary : STRONG_BUY
◲◰ Sharpe Ratios :
▣ Last 30D: 1.46
▣ Last 90D: 1.17
▣ Last 1-Y: -0.82
▣ Last 3-Y: 0.55
◲◰ Volatility :
▣ Last 30D: 0.73
▣ Last 90D: 0.78
▣ Last 1-Y: 0.85
▣ Last 3-Y: 1.73
◳◰ Market Sentiment Index :
▣ News sentiment score is N/A
▣ Twitter sentiment score is 0.53 - Bullish
▣ Reddit sentiment score is 0.84 - V. Bullish
▣ In-depth 1INCHUSDT technical analysis on Tradingview TA page
▣ What do you think of this analysis? Share your insights and let's discuss in the comments below. Your like, follow and support would be greatly appreciated!
◲ Disclaimer
Please note that the information and publications provided are for informational purposes only and should not be construed as financial, investment, trading, or any other type of advice or recommendation. We encourage you to conduct your own research and consult with a qualified professional before making any financial decisions. The use of the information provided is solely at your own risk.
▣ Welcome to the home of charting big: TradingView
Benefit from a ton of financial analysis features, instruments and data. Have a look around, and if you do choose to go with an upgraded plan, you'll get up to $30.
Discover it here - affiliate link -
1INCHUSDT trade ideas
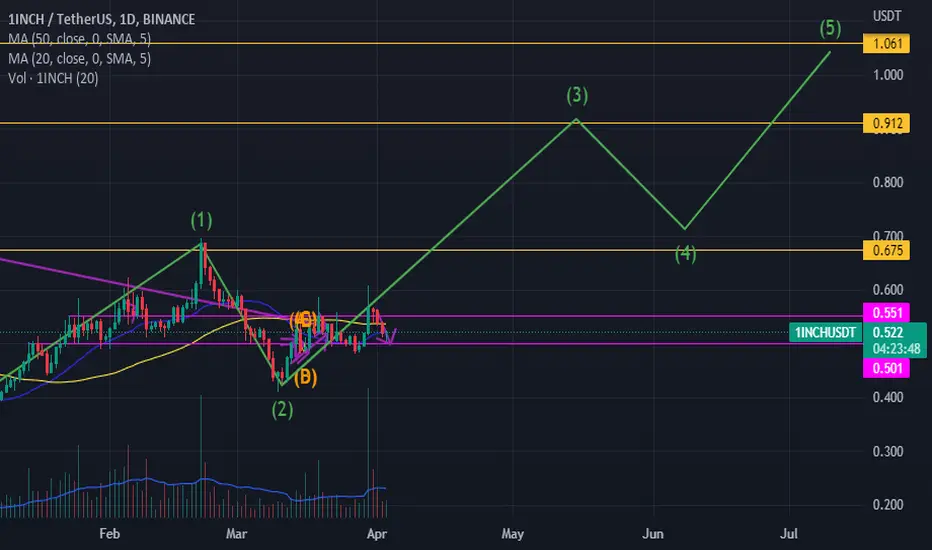
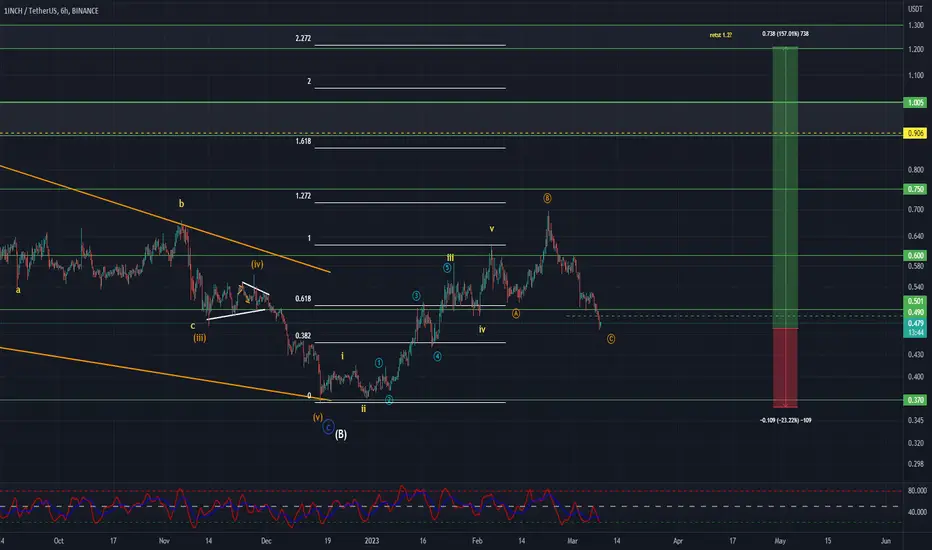
1INCHUSDT Elliott Waves AnalysisHello friends.
Please support my work by clicking the LIKE button👍(If you liked). Also i will appreciate for ur activity. Thank you!
Everything on the chart. (update)
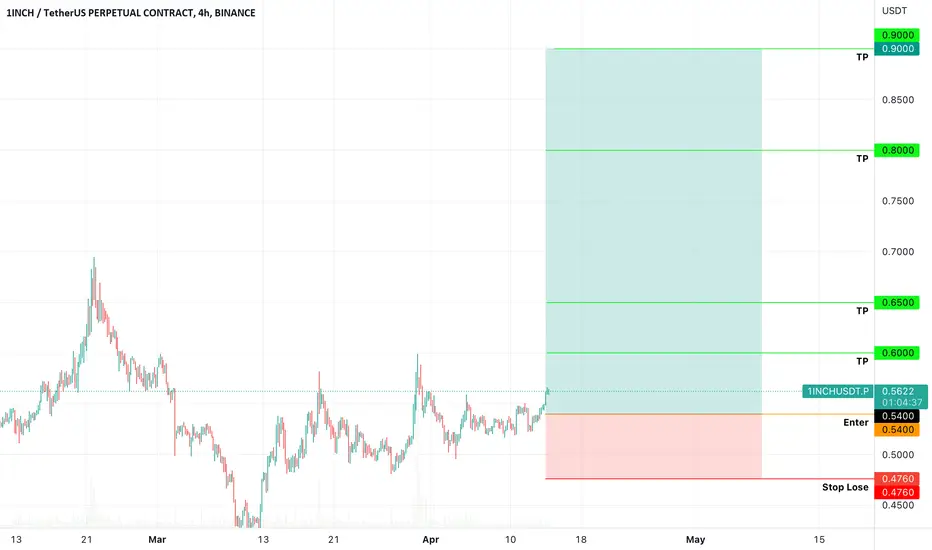
Nothing has changed from my last analysis, everything according plan, minimal target zone ~0.9, and maybe 1.2 will depends on structure.
Entry: market and lower (im in pos from 0.49)
Targets: 0.7 - 0.85 and maybe 1.2(not sure about last)
after first target reached move ur stop to breakeven
Stop: ~0.4 (depending of ur risk). ALWAYS follow ur RM .
RR: 1 to 7
risk is justified
Good luck everyone!
Follow me on TRADINGView, if you don't want to miss my next analysis or signals.
It's not financial advice.
Dont Forget, always make your own research before to trade my ideas!
Open to any questions and suggestions
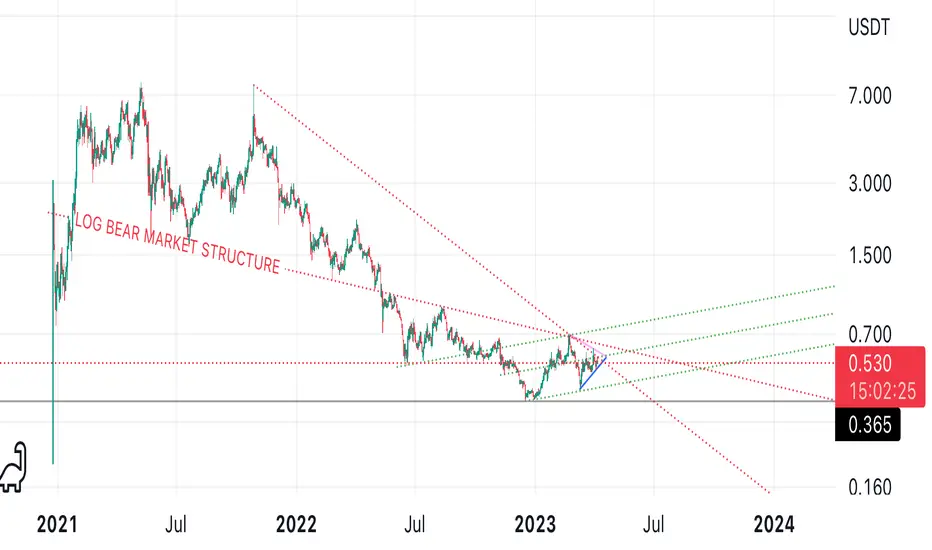
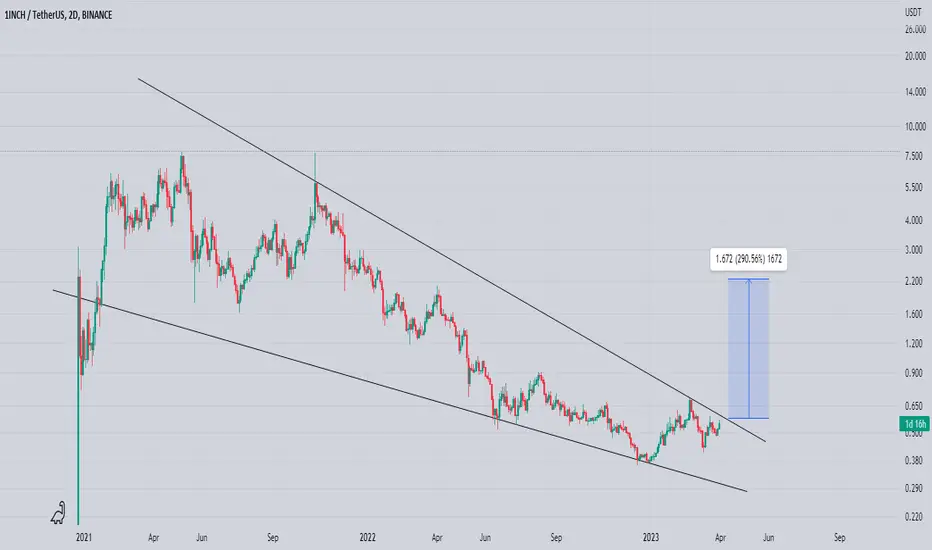
1INCH Technical AnalysisLogarithmic chart showing 1INCH's ~95% decline from all time highs and which trend lines are at play in the current market structure .

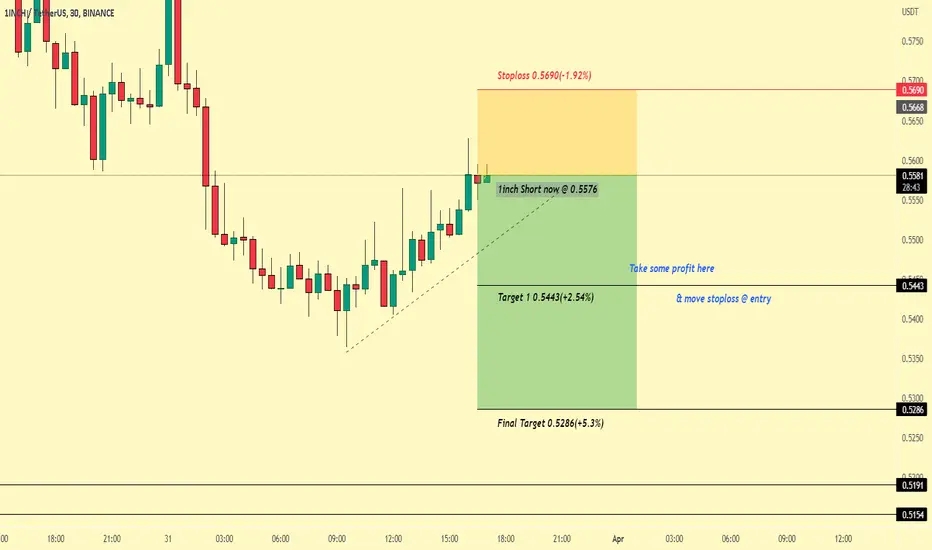
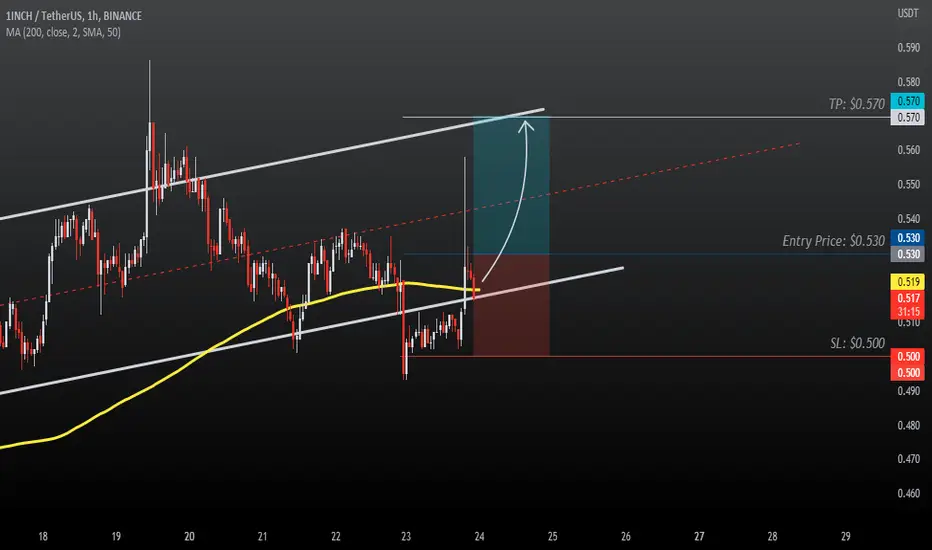
Short 1inchHello Traders!
Welcome back to another trade with analyst Aadil1000x.
This is time to short 1inch from here. There is a strong reversal pattern at the top.
1inch Short now @ 0.5576
Stoploss 0.5690(-1.92%)
Target 1 0.5443(+2.54%)
Final Target 0.5286(+5.3%)
Don't forget to hit the like button and follow to stay connected.
1inch is ready for bullish move 1inchusdt
Breakout has been confirmed, we have to wait for retest. If we see buying activity on retest, then we will take entry.
Also Chart is looking Ultra Bullish on Higher Time-frame, 100-200% Bullish Move can be expected in coming weeks.
Remember: We only give ldea's from our
experience and knowledge, it does not
mean that it will be 100% correct, the
market is always unpredictable, anything
can happen anytime.
Always trade with your own research and
knowledge. If You Are Satisfied With Our
Work Then Join.
1INCHUSDT IdeaBINANCE:1INCHUSDT
⚠️🚨 Risk warning, disclaimer: the above is a personal market judgment and analysis based on published information and historical chart data on The trading view,
And only some of these analyzes are my actual real trades.
I hope Traders consider I am Not responsible for your trades and investment decision.
✅ Please write any advice or suggestions.
Dear friends, request any cryptocurrency pair, currencies pair for forex, and any index that you want to be analyzed.
1INCH FALLING WEDGE PATTERN1INCH on the way to o.8-0.91 regain. need daily close above 0.65 and we move
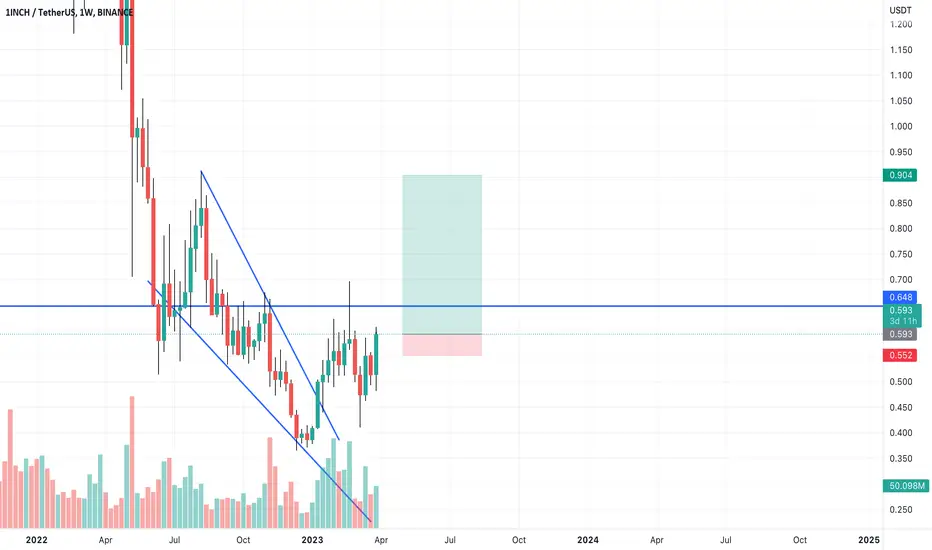
1inch Looks Promising For Midterm Looking Good For Breakout
Formed Falling Wedge In 2day Timeframe Expecting Massive Breakout Soon Incase Of Breakout Expecting 200 to 220% bullish Move In coming Weeks
Ascending traingle Ascending traingle formed and breakout on horizontal resistance so a Bullish entry
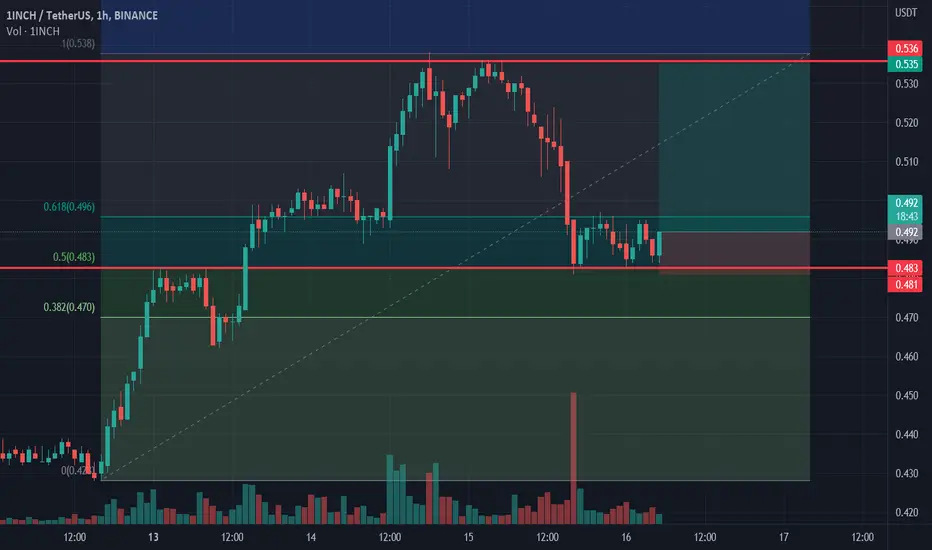
1inch:Two Possible Trading Scenarios -0.54 It is a Crucial Area1 inch:Two Possible Trading Scenarios -0.54 It is a Crucial Area
Today I explained the possible scenarios related to 1 inch.
The price needs to rise above 0.54 in order to rise further and reach other targets.
As long as the price will develop below 0.54, then we can see the price moving lower again in the coming days.
The bullish optimism is not as high as with BTC and ETH.
Thank you and Good Luck!

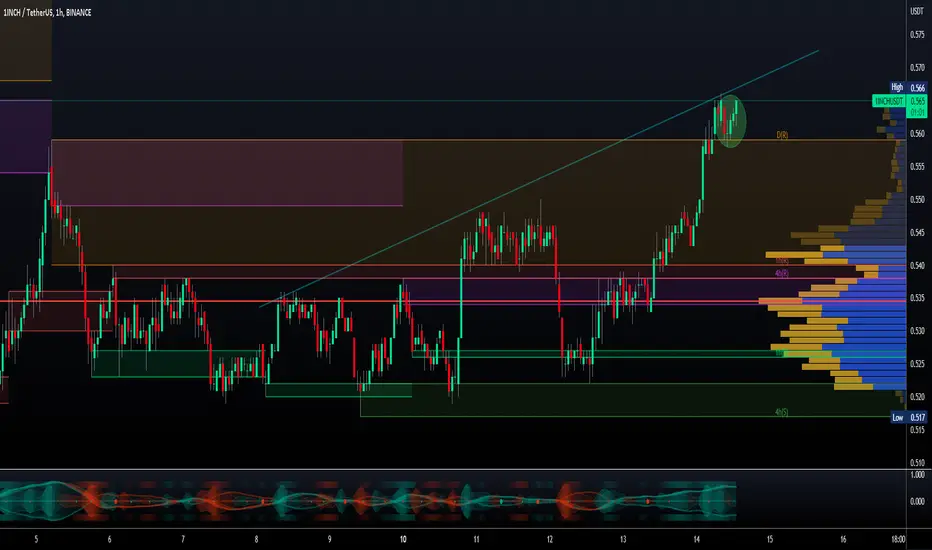
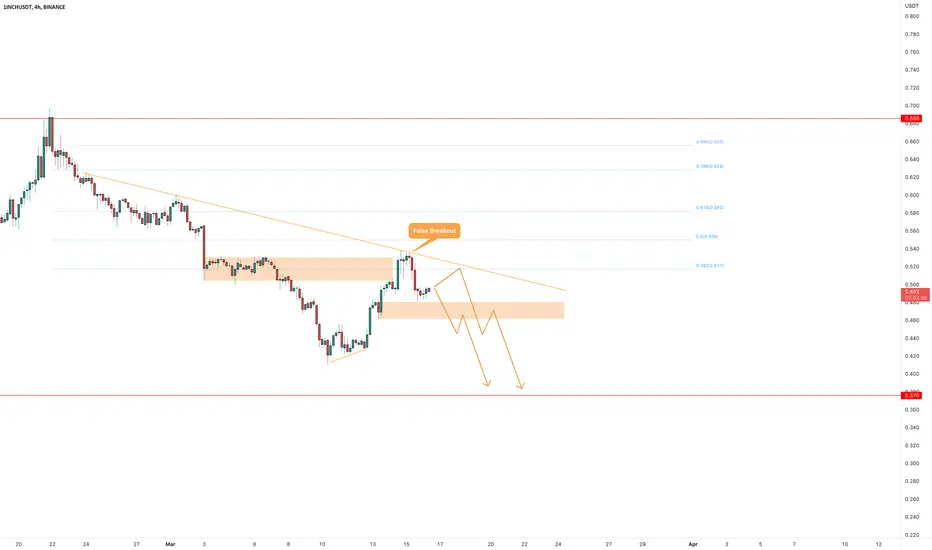
1INCHUSDT is testing the key level1INCHUSDT is currently testing a support level after experiencing a false breakout around the $0.55 area. Traders should keep a close eye on the price and monitor whether it holds the support level.
If the support level fails to hold, according to Plancton's rules, traders may want to consider opening a new short position. This would allow traders to benefit from a potential drop in price if the support level breaks down.
–––––
Follow the Shrimp 🦐
Keep in mind.
🟣 Purple structure -> Monthly structure.
🔴 Red structure -> Weekly structure.
🔵 Blue structure -> Daily structure.
🟡 Yellow structure -> 4h structure.
⚫️ Black structure -> <= 1h structure.
Follow the Shrimp 🦐
1INCH longA correction to major bullish trend stopped around Fibonacci 0.5 level. A continuation of ascending trend to 1 Fibonacci level is expected to happen.
Demand Zone Active on Ranging Market 🦄 Multi-timeframe Technical Analysis:
D1 Bounced off strongly from key support level that holds the uptrend within the ranging market. This happens to be a Demand Zone.
H4 Ichimoku Kumo Breakout destroying downtrend structure signaling the start of a potential reversal to the upside. Please proceed with caution as market on weekly chart is ranging mode.
Key Areas
Key Support area: 0.411 - 0.436 (Potential Entries)
Key Resistance area: 0.666 - 0.705(Potential Targets)
Please make sure to check brokers slippage along with trading fees for you to accommodate if the trading signal is useful for you or not.
Do not risk entire portfolio on a single trade. Remember market is king!
Stay healthy and happy trading!
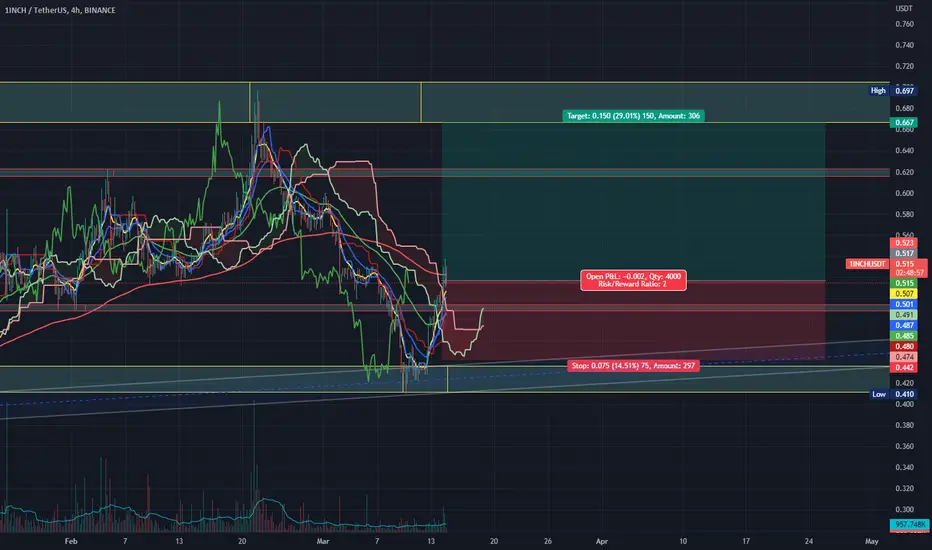
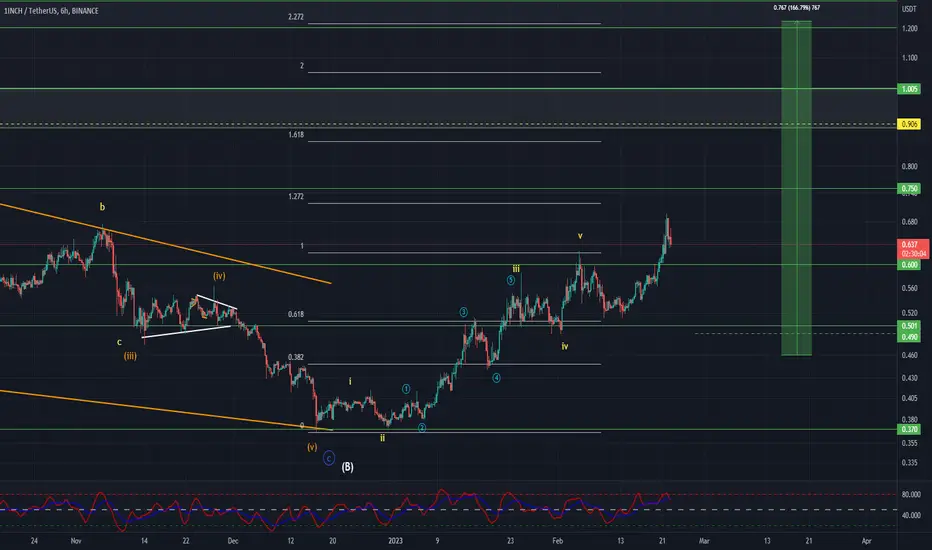
1INCHUSDT Elliott Waves AnalysisHello friends.
Please support my work by clicking the LIKE button👍(If you liked). Also i will appreciate for ur activity. Thank you!
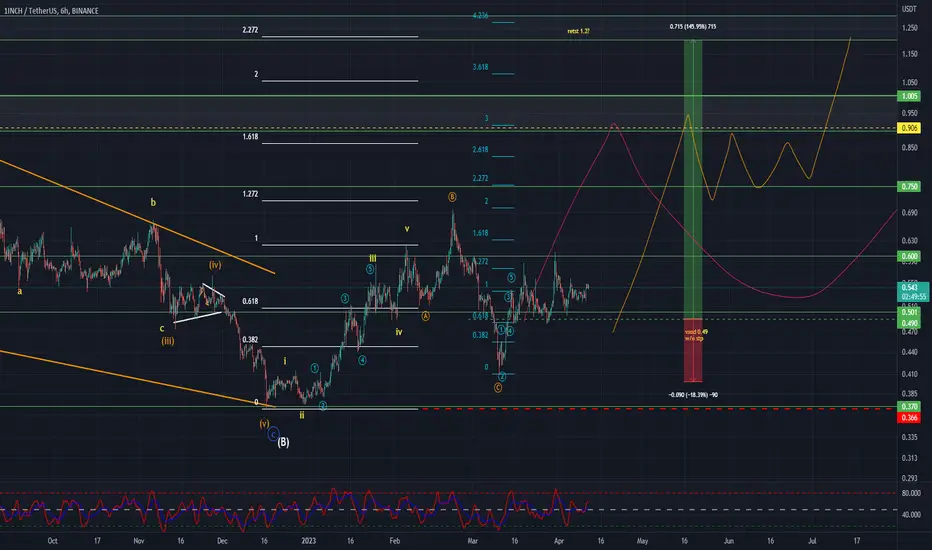
Everything on the chart.
On last trade on 1inch was gotten first target and rest of pos closed in breakeven,
we can reenter coz right now structure looks like a correction, flat(3-3-5).
Entry: market and lower
Targets: 0.7 - 0.85 and maybe 1.2(not sure about last)
after first target reached move ur stop to breakeven
Stop: ~0.36 (depending of ur risk). ALWAYS follow ur RM .
RR: 1 to 6
risk is justified
Good luck everyone!
Follow me on TRADINGView, if you don't want to miss my next analysis or signals.
It's not financial advice.
Dont Forget, always make your own research before to trade my ideas!
Open to any questions and suggestions
1INCHUSDT Elliott Waves AnalysisHello friends.
Please support my work by clicking the LIKE button👍(If you liked). Also i will appreciate for ur activity. Thank you!
Everything on the chart. (update)
Nothing has changed, everything is relevant.
First target was already reached on 0.65, stop in breakeven(0.46)
Next targets 0.9 and ~1.2
Good luck everyone!
Follow me on TRADINGView, if you don't want to miss my next analysis or signals.
It's not financial advice.
Dont Forget, always make your own research before to trade my ideas!
Open to any questions and suggestions.
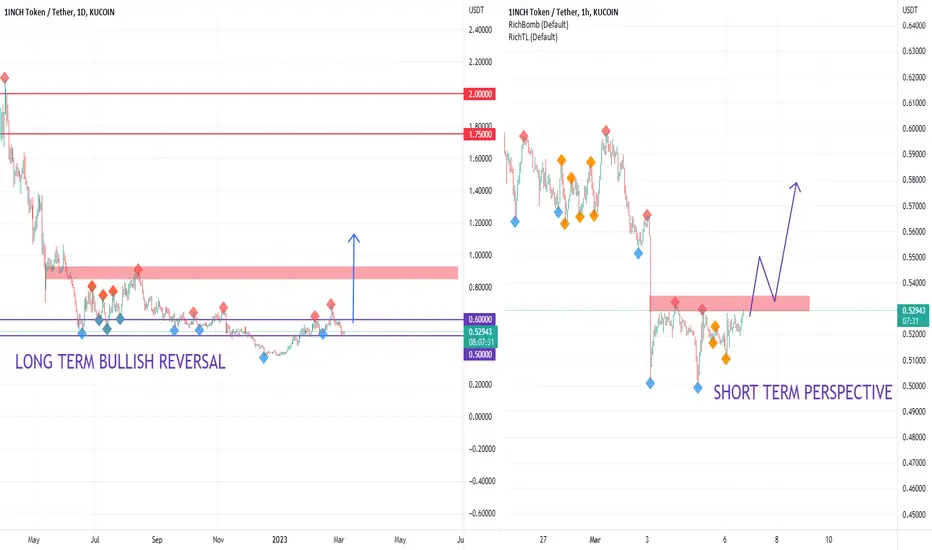
1 INCH LONG- AND SHORT-TERM PERSPECTIVE Hello Traders and everyone, I am Hadi Karaali, Known as SNIPERS_FX
If you like the idea, do not forget to support with a like and follow.
1 INCH FROM 2 DIFFERENT PERSPECTIVES
As we can see price is around a strong support zone, where we are interested in looking for new longs.
From a long-term perspective and for the bulls to kick in we need a break above the marked major swing high, then a further movement higher would be expected.
From a short-term perspective and since we are around a support zone,
We need a break above the marked major swing high marked on the chart, until that happens price is still bearish, and price can still dive more inside our support before reversal.
If you like this kind of analysis don't forget to like and follow
And as usual follow your trading plan and manage your risk.
Be patient and good luck!
1INCH Bearish triangleThe coin has formed a cascade of local levels, which is confirmed by a lot of touches and has accumulated a lot of liquidity. The movement along the downward slope to the cascade is clearly visible, thanks to the activity of the limit seller who wants to withdraw liquidit

1INCH long1INCH bounced off the support level. A correction to major bullish trend stopped around Fibonacci 0.5 level. A continuation of ascending trend to 1 Fibonacci level is expected to happen.

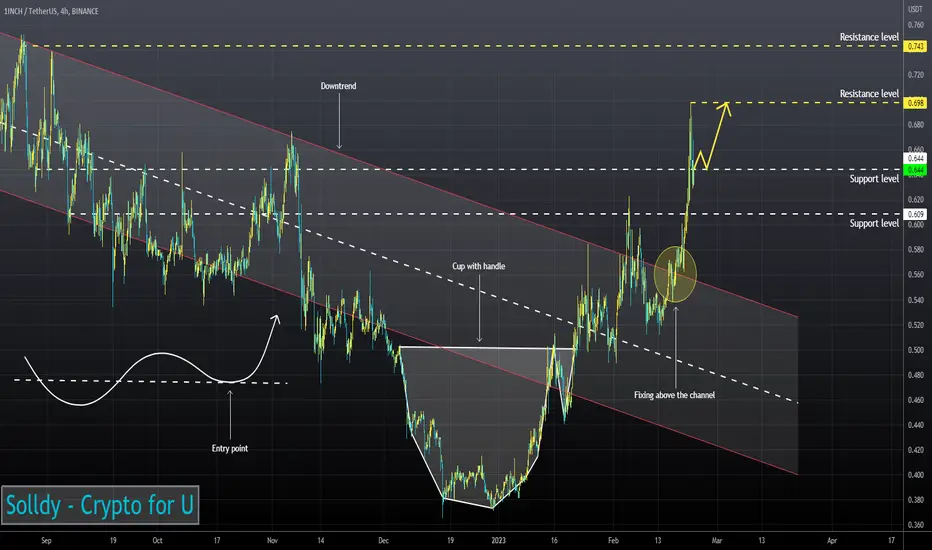
1INCHUSD ❕ fixed above the channelTrading volumes have increased and indicate that the market is interested in further price growth.
The RSI chart is in the buyers zone on 4H Timeframes and near neutral values on 1H and 30m Timeframes.
I believe that the asset will continue to grow after fixing above the support level.