1INCHUSDTHello Crypto Lovers,
Mars Signals team wishes you high profits.
This is a 4-hour-time frame analysis for 1INCHUSDT
There are R2 and R1 as our resistance areas which both contain the disability of the price to rise. And S1 is a support area with its well support of price. Thus, we have the price fluctuating below R1 area and our expectation would be a rise to touch the mentioned area. Then via receiving some falling signs, the short position of our chart is activated and a decline will happen to S1 or more lower amounts. Even it is less probable that the price rises over R1 and experiences more rise. Please be careful about any piece of detail and information for your trades.
Warning: This is just a suggestion and we do not guarantee profits. We advise you to analyze the chart before opening any positions.
Wish you luck
1INCHUSDT trade ideas

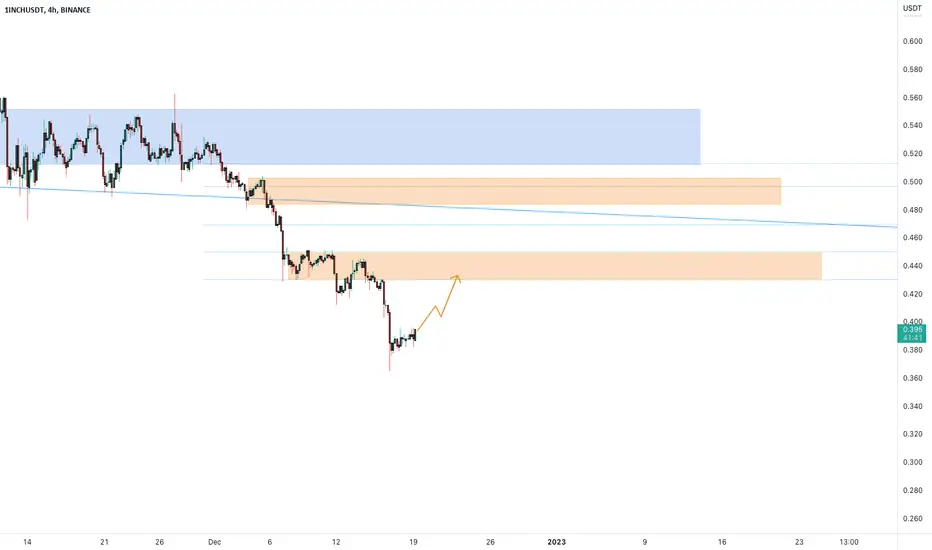
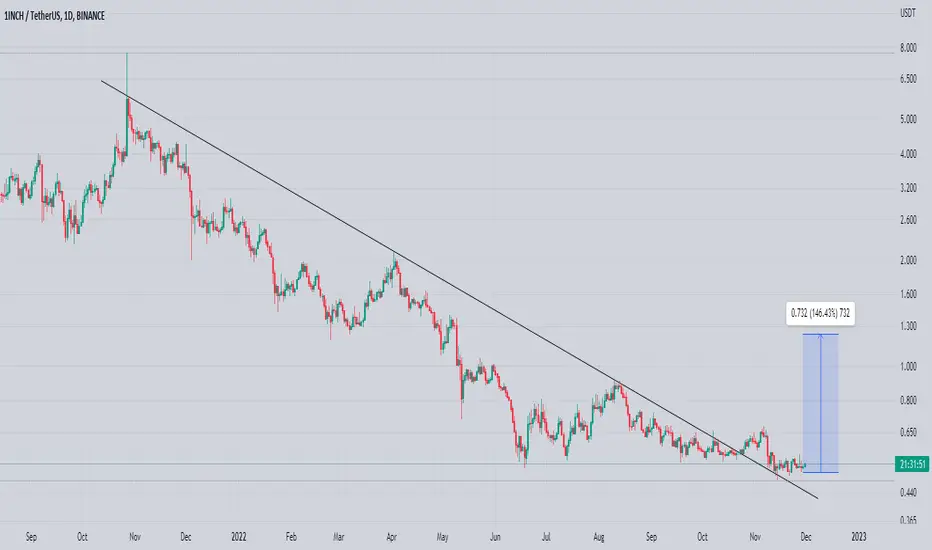
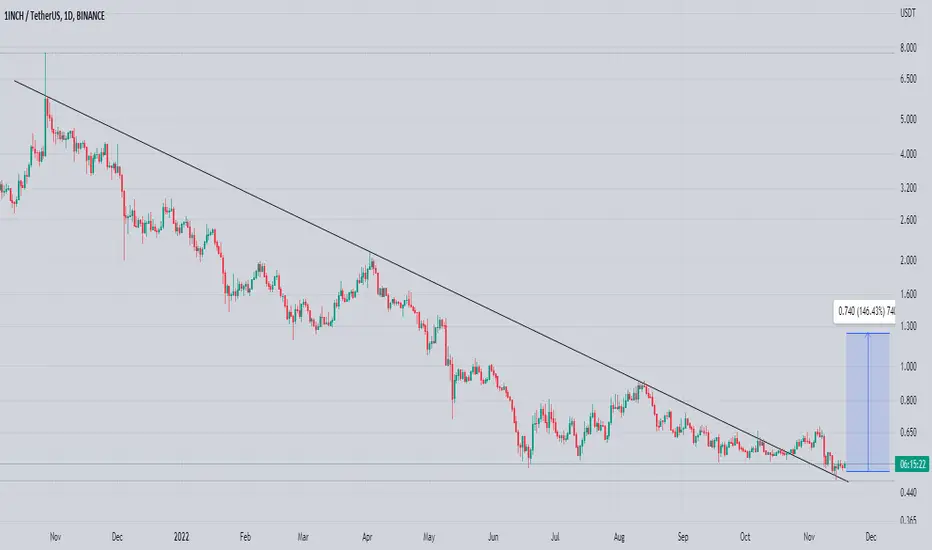
1INCHUSDT pullback?The price lost a crucial support on the daily timeframe.
Now the market is melting and it's creating new lower lows.
How to approach it?
The price could have a pullback until the 0.382 Fibonacci level, so According to Plancton's strategy , we can set a nice order
–––––
Keep in mind.
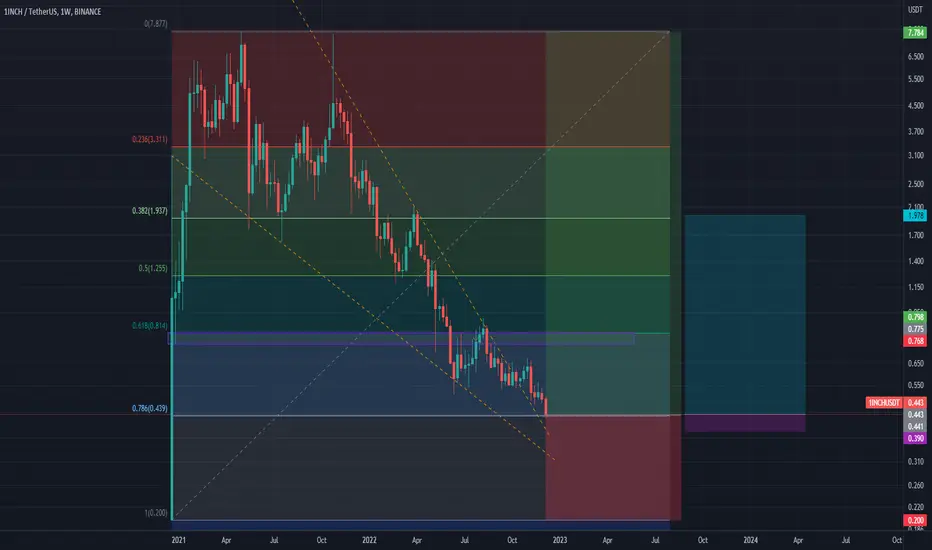
🟣 Purple structure -> Monthly structure.
🔴 Red structure -> Weekly structure.
🔵 Blue structure -> Daily structure.
🟡 Yellow structure -> 4h structure.
⚫️ black structure -> <= 1h structure.
–––––
Follow the Shrimp 🦐
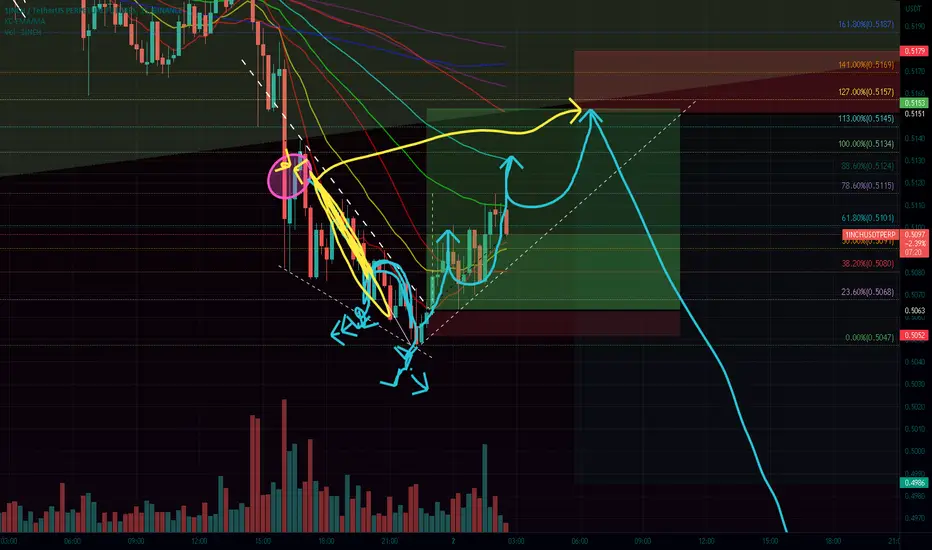
1INCH AN GO UPI hope you are fine
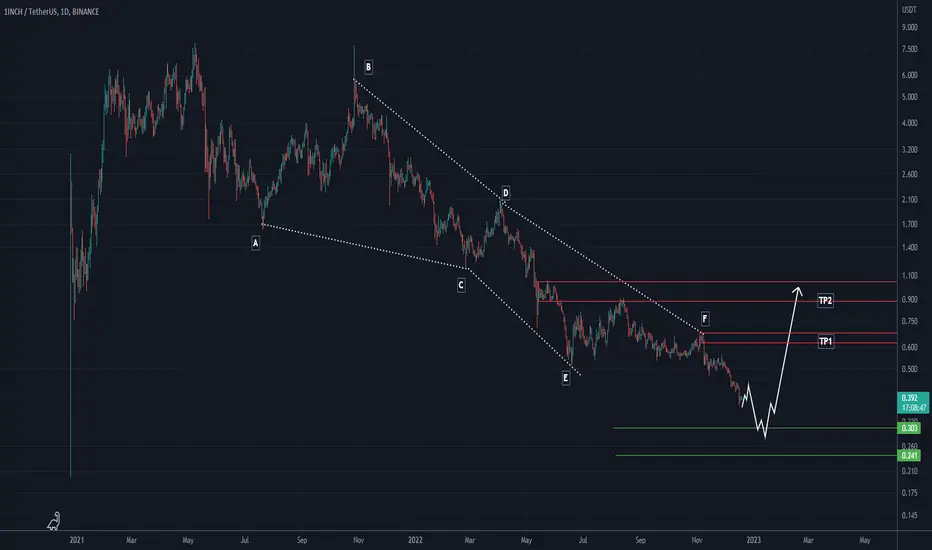
I have identified a diametric in large time frames, which I think we are in the last corrective wave of this diametric. After the g wave, we can see a valuable upward wave. The green area is suitable for returns, but note that we need confirmation or a trigger to buy
Comment if you have any questions
Thank You
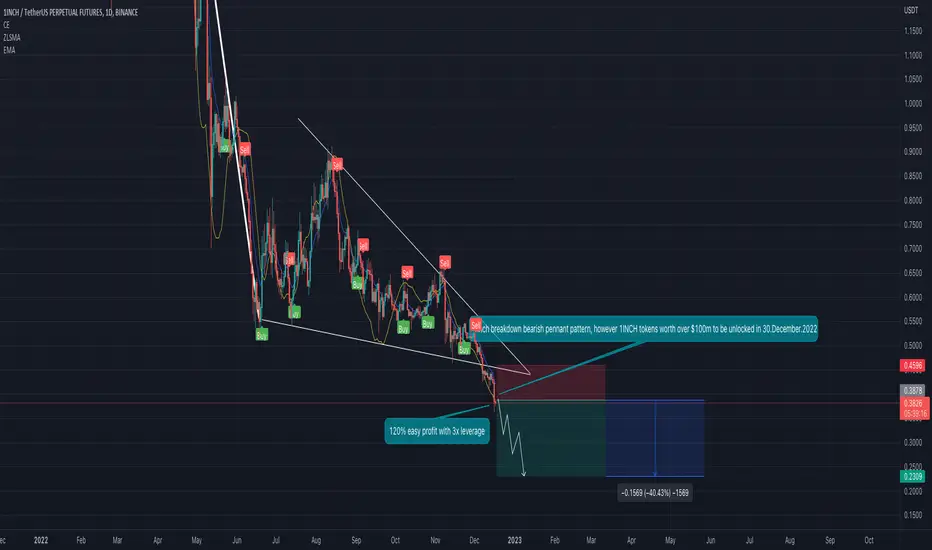
1inch/USD Update. 1inch breakdown bearish pennant pattern, however 1INCH tokens worth over $100m to be unlocked in 30.December.2022
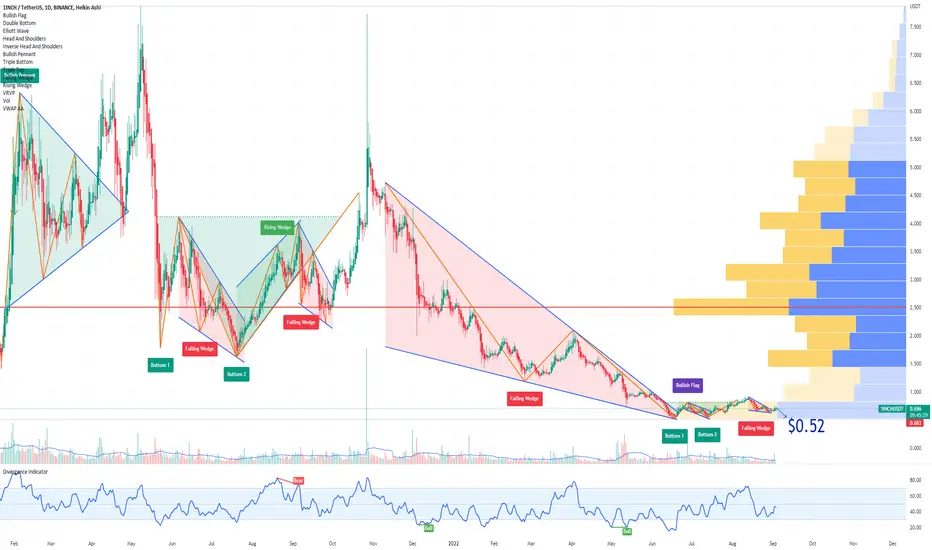
1INCH Price PredictionGrayscale expressed concerns over the potential impact on the Ethereum Merge, especially on tokens that run natively on Ethereum:
The Merge may lead to a fork that might have unexpected and unfavorable outcomes and a scenario where stablecoins and tokens locked in smart contracts might not be redeemable.
Token and stablecoin holders might panic and start liquidating their holdings.
In this context, price target for 1INCH is $0.52.
Looking forward to read your opinion about it.
1inch Global Long1inch is going to have an Unlock of 14% Total Supply. Surely it is bearish . BUT! In condition of mega bearish sentiment and obviously oversold zone - it can lead to the next few scenarios :
1. Pump&Dump (Pump till 30th December and then - DUMP to cut SL under 0.786 zone 0.44)
2. Dump&Pump ( Dump till 30th December and then - PUMP on bearish sentiment.)
3. Consolidation in 0.4-0.45 and then - Pump and global reverse .
My global vision is a new ATH in 10-30$ ( looks like i am too positive , but the team is pretty good and the market cap is only 300,000,000$ )
I don't see any of this terrible scenarios with BTC under 12-10k and 1inch under 0.2 BECAUSE of mega Bearish Sentiment and the fact that 1inch foundation is working hard all this bear market long,
"Buy When There's Blood In The Streets, Even If The Blood Is Your Own"
Futures Setup :
Entry : 0.4 - 0.45
SL : 0.39 - 0.2
Take :
0.66 - 0.88 - 1.3 - 2 ( For SL 0.39 )
0.88 - 2 - 4 - 8 - 16 - 30 ( For SL 0.2 )
1INCH. It makes no sense to have an inch anymore.Unlocks soon happen and the founders of the protocol will start buying gifts for their wives and getting used to leading a luxurious life, because in their opinion they have done something "great". Just check the tweet and never invest your money in 1inch. Be safe.

No support or resistance remain for 1InchHello trading view community, should you like this analysis please support with like and comment your idea below this analysis. Thank you.
Never risk more than you can afford to lose.
Always DYOR.
I have posted the following analysis on april approximately eight months ago,
tradingview.sweetlogin.com/proxy-s3
just as I analyzed it then it crashed deeply. Since the market has not yet chose its trend and kept on siding, but sooner or later we may witness a new crash on Bitcoin, so 1Inch will not be an exception.
Rumors about 1Inch:
until December 30, the team will release 222,187,500 coins, which is equivalent to more than $100 million. In terms of distribution, there is no exact release date. The 1inch Foundation is giving away coins on demand until December 30th, not on this specific day.
Now all the tokens are unlocked, some on Binance, some on wallets, which have already been tracked by a team of analysts from lookonchain.
If one hasn’t realized the scale yet, after the unlock, the 1INCH emission increased by 36%. 1inch is already down 6% today.
in spite of above rumors but 1Inch is in a downtrend pitch fork and it shows that crash may continue up to $0.30
Large volumes appeared. I expect a rebound from the support leveThe price has been in a downward movement for a long time. Large volumes appeared. Got a reaction from the level. An oblique level in the resistance was formed. I expect a rebound from the support and movement towards the boundaries of the inclined level. Goal - 0.477$

1inchusdtAs shown in the chart you can scroll back to November 13th 1inch had made a double bottom (one from november, the other one is an hour ago)
Bullish candle stick + doblebottom + broken the upper trend line in daily time frame which will give us a 50-125% in spot trading
And for future i recommend 5x with stoploss at 0.470
1INCH’s time for reversal.It looks like we are having a retest on this slow moving coin.
After the breakout the retest is needed for more pumping.
If the market does not crash we will see fast climbing for 1inch.
Type: Scalp
Risk: Moderate
Target: 50%-250%

SHORT TO LONG TO SHORT :) A nice example of connecting patterns on different sized candles
On the 4H candles we can observe a triangle, after breaking through which we started to form a falling wedge on a smaller timeframe (15m). While the wedge was broken, a lesser-known dragon pattern was formed (I'm just starting to study it .. thanks to @sylviasylvia .. ) whose last target is located on the retest of the triangle, where there should be a second chance to enter the short .. BINANCE:1INCHUSDT
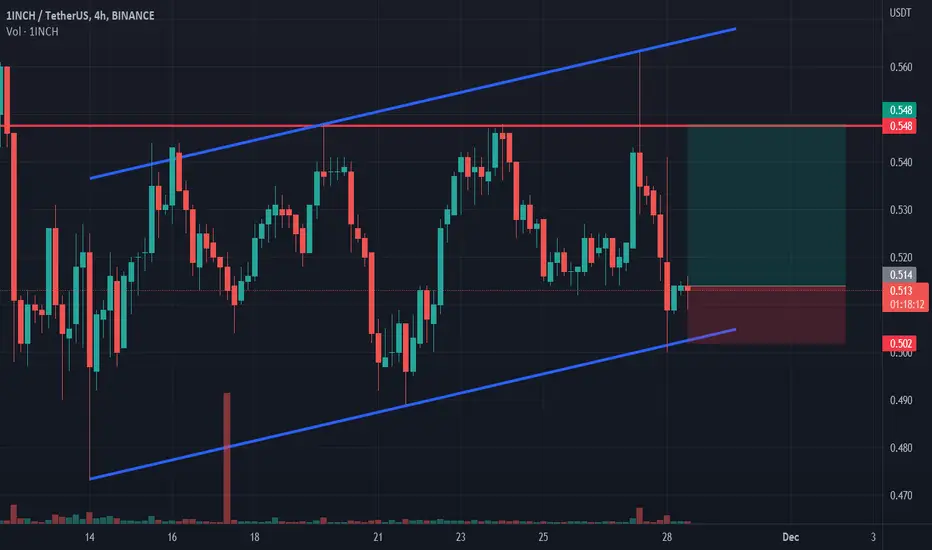
1INCH long1INCH bounced off the lower boundary of ascending channel. Bullish movement to resistance level at 0.548 is possible.
1INCH USDT | falling wedge on daily frame!Hello traders,
I see a good opportunity but full of risk due to the market instability.
1Inche is forming a falling wedge on daily frame that may has a great targets up to 50% up.
how to trade falling wedge pattern?
you must know that, the falling wedge can either be a reversal or continuation signal.
As a reversal signal, it is formed at a bottom of a downtrend, indicating that an uptrend would come next.
As a continuation signal, it is formed during an uptrend, implying that the upward price action would resume. Unlike the rising wedge, the falling wedge is a bullish chart pattern.
A good upside target would be the height of the wedge formation.
#1INCH/USDT
🟢Entry price: 0.52 to 0.48
🎯Targets:
|> 0.575 (Sell 40%)
|> 0.638 (Sell 30%)
|> 0.712 (Sell 20%)
|> 0.786 (Sell 10%)
🔴Stop-loss: 0.47 (1D candle Close under it)
➡️Recommended risk: 0.25%
➡️Recommended Position Size : 6.25%
stay safe and trade safe
thank you!

Triangle pattern!1INCH has been trading below the primary resistance level of $0.550 - $0.559 and forming a triangle pattern. The price is also rejected from the resistance with the confluence with the resistance line and is expected to drop slightly. A breakout of the triangle will decide the next impulsive direction. Until that, hold to any entry.

1INCH/USDT might took trend reversal.1INCH/USDT might took trend reversal.
I am short with sell stop about 10 PIPS.

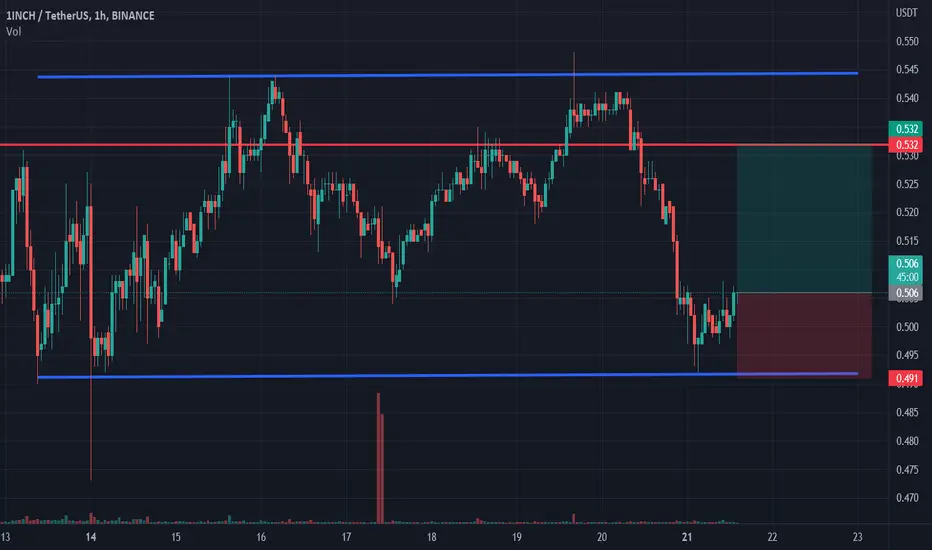
1INCH long1INCH bounced off the lower boundary of horizontal channel. Bullish movement to resistance level at 0.532 is possible.
1inch/UsdtHi everyone.
Please support my work by clicking the LIKE button (If you liked).
Everything on the chart.
Follow me on TRADING View, if you don't want to miss my next analysis or signals.
It's not financial advice.
Do not Forget, always make your own research before to trade my ideas!
Good luck everyone Thank you!
!INCHtrendline breakout has already done retest in process
incase of successful retest expecting 140 to 150% bulish move
not a financial advice

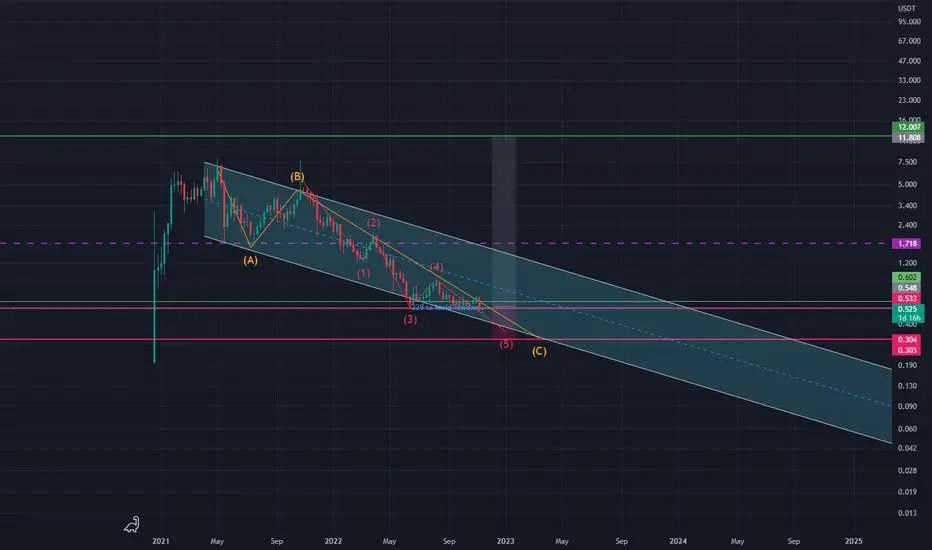
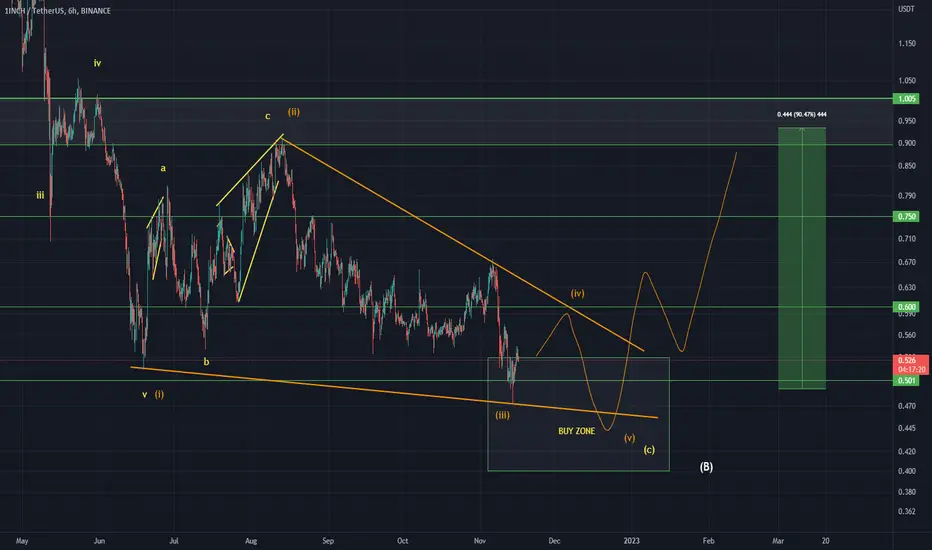
1INCHUSDT Elliott Waves AnalysisHello friends.
Please support my work by clicking the LIKE button👍(If you liked). Also i will appreciate for ur activity. Thank you!
Everything on the chart.
Entry: market and lower (0.53-0.4)
Targets: 0.65 - 0.75 and zone 0.9-1$
after first target reached move ur stop to breakeven
Stop: (depending of ur risk). ALWAYS follow ur RM .
risk is justified
Good luck everyone!
Follow me on TRADINGView, if you don't want to miss my next analysis or signals.
It's not financial advice.
Dont Forget, always make your own research before to trade my ideas!
Open to any questions and suggestions.
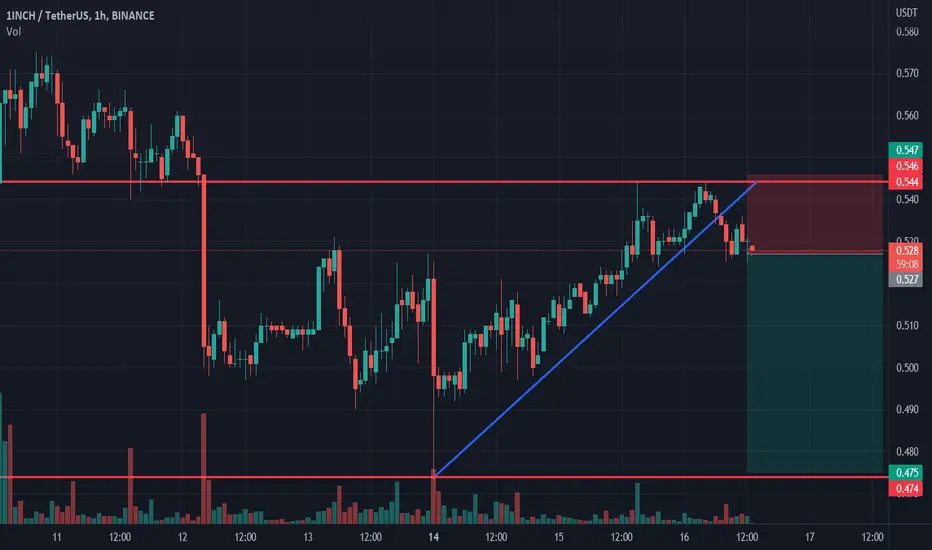
1INCH short1INCH bounced down off the resistance level. Asset broke trough the ascending trendline. Bearish movement to support level at 0.475 is expected to happen.