1inch price movement predictionPrice Prediction for 2022
not financial advice
this is for entertainment purposes only
always DYOR
1INCHUSDT trade ideas

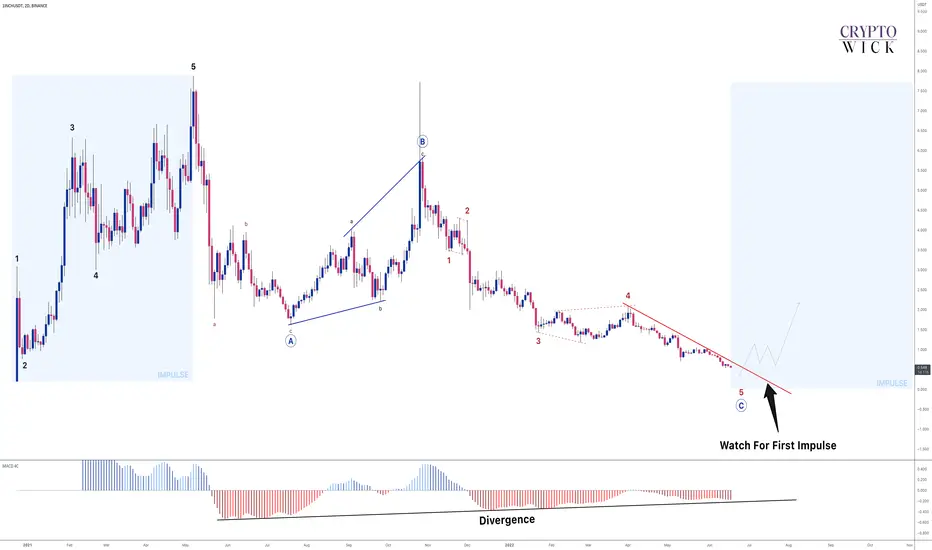
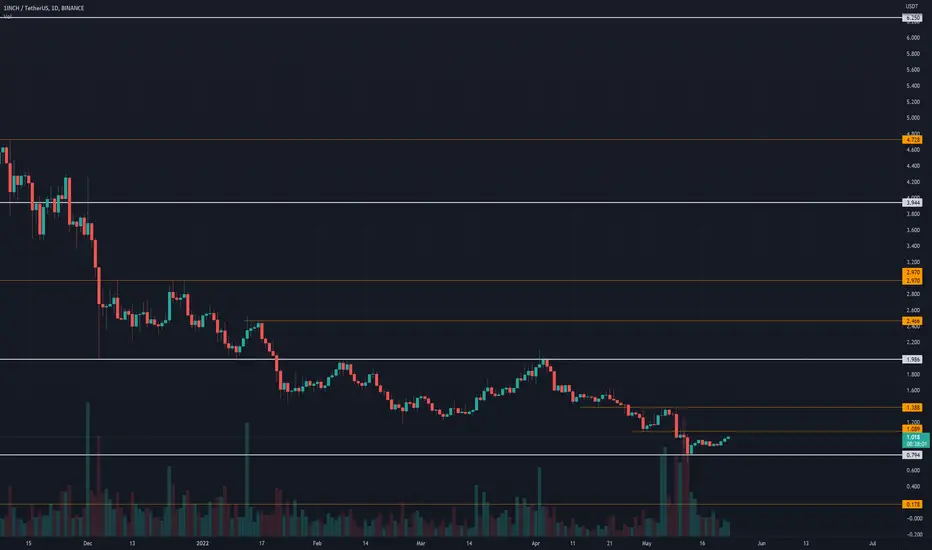
1INCH - Watch For First Impulse ⚡️After the massive impulse in the first half of 2021, we have been correcting ever since. We are approaching the bottom and price is making a really nice descending correction.
We are watching for the first impulse to break the red trendline to confirm that the bullish reversal has begun. We can see that we've also got divergence at play indicating a reversal is coming.
Trade Idea:
- Watch for the first bullish price action
- enter with stops below the lows
- Targets: 5.500, 7.500, 10, 12.500
Goodluck and as always, trade safe!
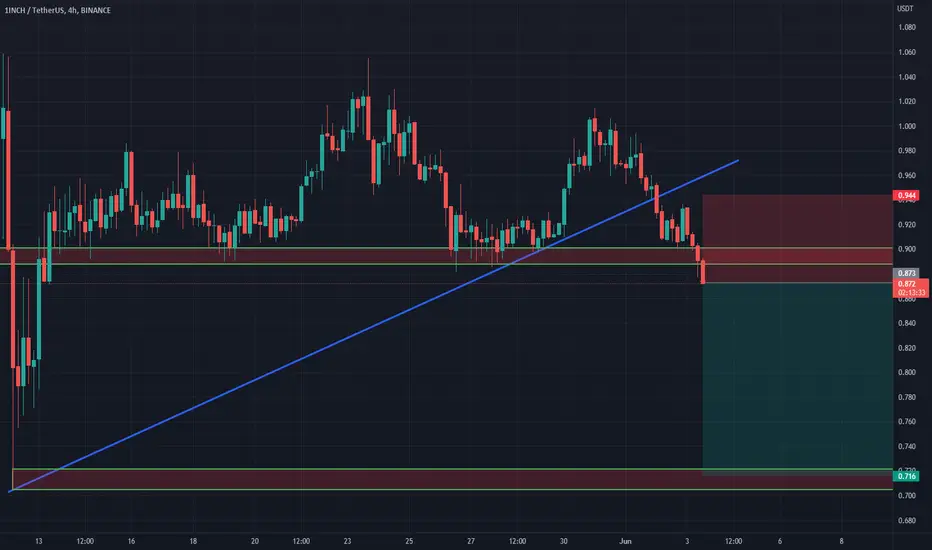
1INCHUSDT is testing the support
The price is creating equal lows on the daily timeframe on 0.9$.
The market creates a demand zone on 0.75$ where the price could get new liquidity in order to create a reversal trade
How to approach it?
IF the price is going to lose the support, According to Plancton's strategy , we can set a nice order
–––––
Keep in mind.
🟣 Purple structure -> Monthly structure.
🔴 Red structure -> Weekly structure.
🔵 Blue structure -> Daily structure.
🟡 Yellow structure -> 4h structure.
–––––
Follow the Shrimp 🦐

1inch long$1inch broke through the resistance level. Bullish movement to resistance at 0,691$ is likely to happen.


DEXs n other alts begging to start a small bag_ cost averg any1its tricky due to the market needing to drop down a bit and re establish lower support as that neck of a trading block in every alt to eth n btc needs some trade action and solid organic support over time not days or a few weeks (see market cap in crypto doubling almost tripled in 1 month as BTC ran from 18k to 30k_this is the neck or naked trading block that needs some attention)
when this crypto trend begins upward again after new support established. DEXs will hold way more power then last years run. the market is I like to think a bit wiser esp with inflated eth gas prices. Layer 2 is stiching up the cross chain movements within and off chain as well as reducing trade and minting fees. These dexs like Optimism,io launching their token (UNIswaps Layer Two project blessed by Vitalek) also SEE OTHER DEXs LIKE SUSHI SNX PANCAKEswap n others Like LOOPring ZKS even centralized CRO Voyager or VGX CHSB i meant the money needs to get on n off etc n play some how rite. also like some heavy DeFi or what ever we call it now players like AAVE YFI CRV LEND MKR then other blockchain ETH like projects ADA (this walled garden will specialize in KYC and third world blockchain infostructure development_ see Occam.fi or OCC n Cardwallet for deep market cap ADA eco sytem projects) DOT little brother and Asain located ETH n Fantom AVAX SOL n maybe a bit just a touch of MATIC BNB tokens for BSC Then we have on n off ramp or and cross chain specialized projects FOR ME ONE WINNER AS OF NOW _ COSMOS ATOM token then anything BTC or lightning network cuz thats where all the main crypto liquidity is. See DODO i could go on n on but just get in where u fit in and dont spread to thin until full time est uptrend in crypto is back

long 1inch1inch bounced off the support level. Bullish movement to resistance level at 0,034$ is possible.
1INCH putting in a bottomI was gonna put a long position on this chart, but for a stop loss you guys can be reasonable. In terms of targets, I think the overhead diagonal resistance is one to watch but I think that price could very much sail through this resistance and to one of the overhead price action historical price resistance or fib level.
I know bitcoin is looking wobbly and we aren't sure if we are going to get another leg up from the recent up swing right away or not, but the 1INCH/BTC chart looks really good and looks like it has bottomed, and looks nice a flat, with a break to the upside on the 1hour chart with ichimoku.
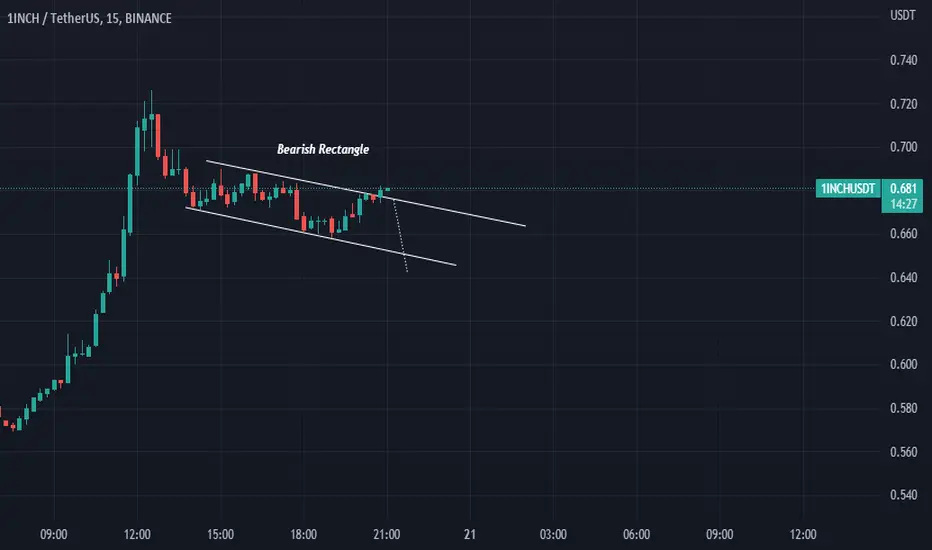
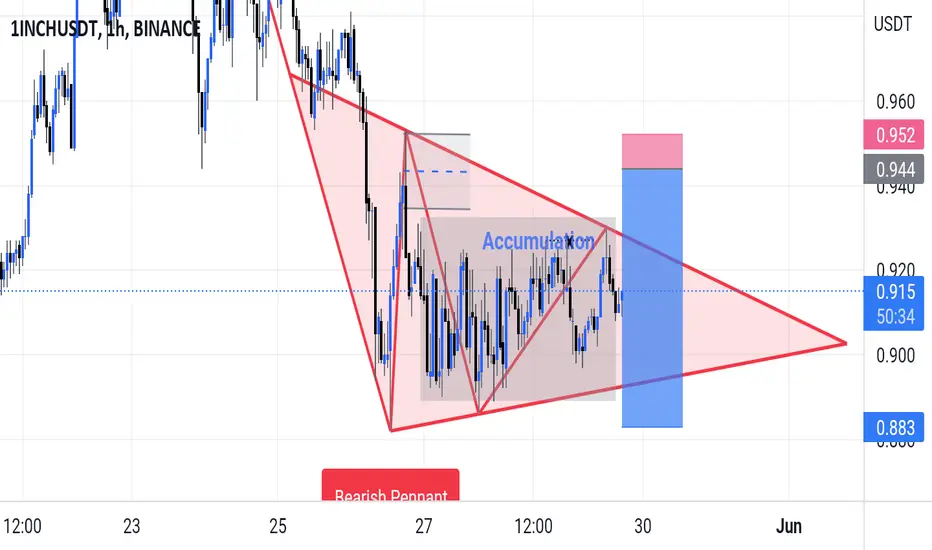
About to breakout to the downside. Showing a bearish flag Bias bearish pennant
About to breakout to the downside. Showing a bearish flag
1INCHUSDT Short Hello , This is like Bitcoin we broke and trend line had pulbak on it with good candles se open sell possession
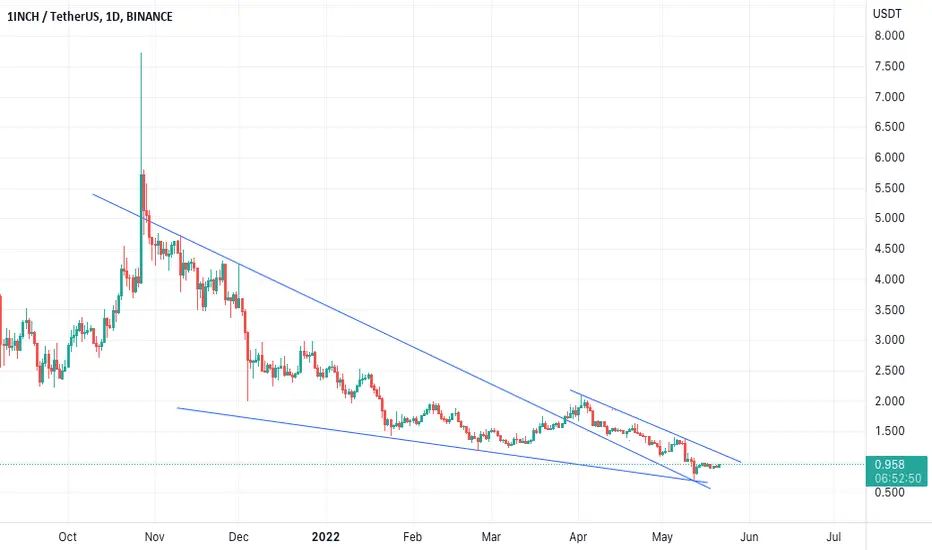
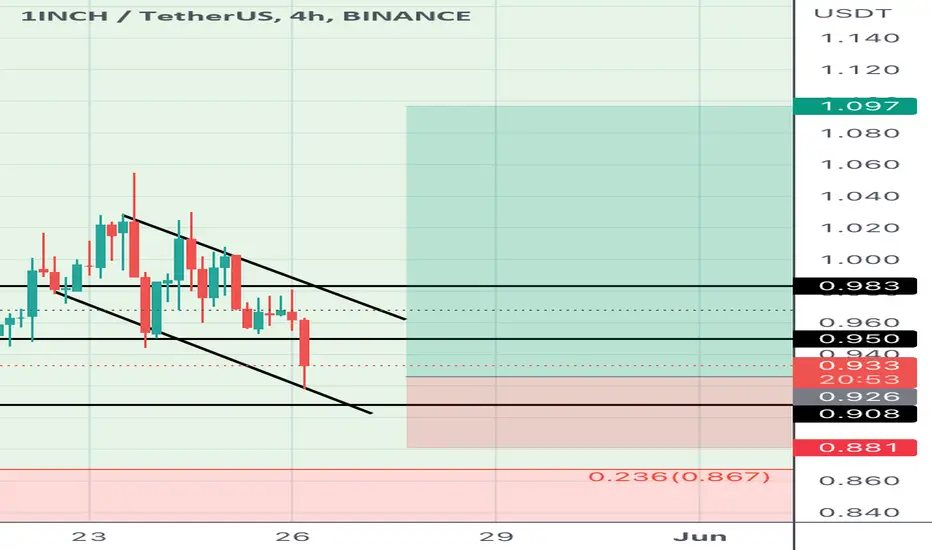
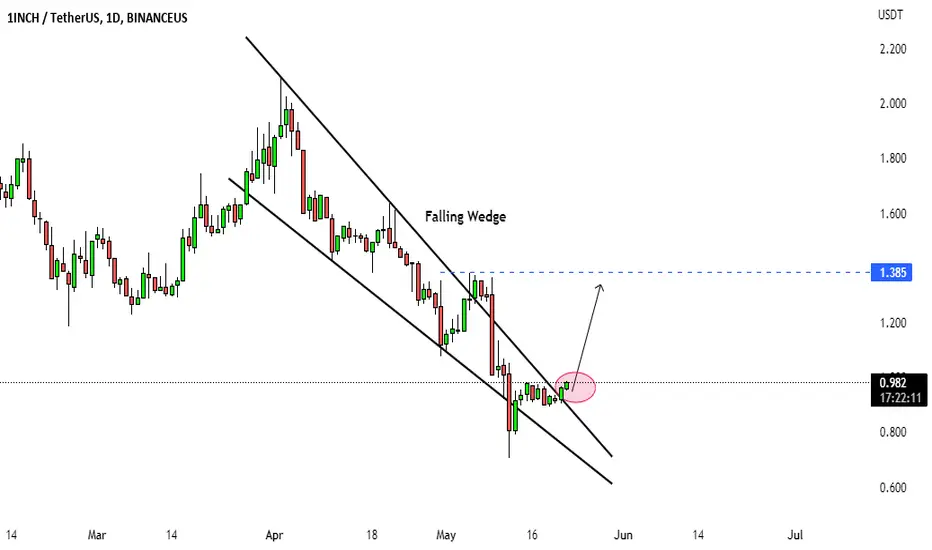
1Inch Falling Wedge Reversal Back to the Support IdentifiedI have spotted this interesting falling wedge on 1inch and here the price is still respecting the adjusted upper boundary formed. The support highlighted is important here as we may see another dip back towards the support.

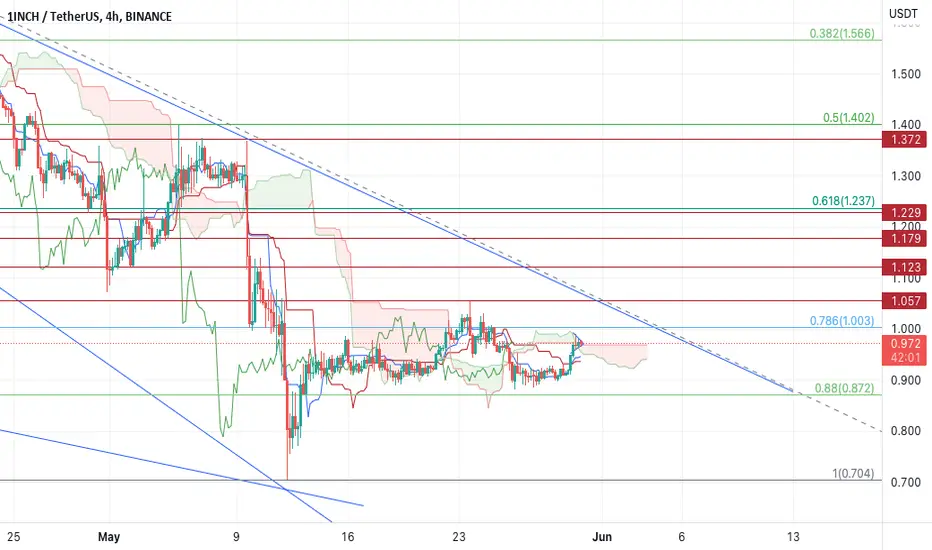
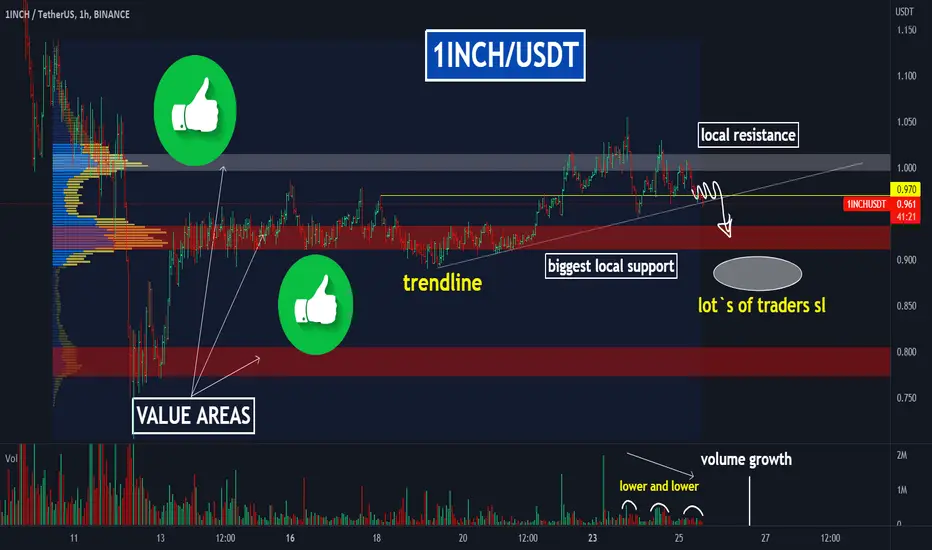
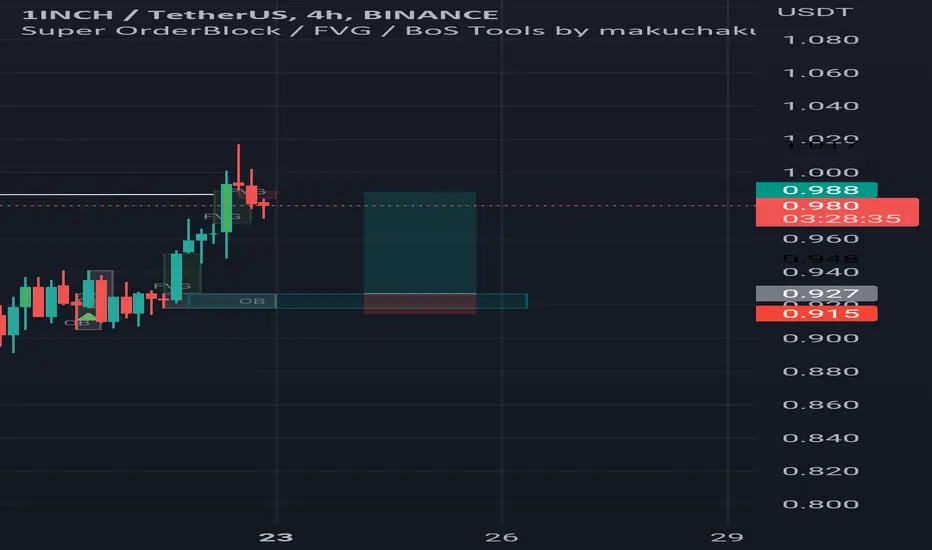
🎯1INCH: 2 main targets for possible trade! Nice local short!1Inch continues its consolidation along with Bitcoin and the entire crypto market. After the local growth, you can see the weakness in the price of this alcoin, which we can take advantage of.
The key points on the chart:
at the test of the key level of $0.97 and the local trend line volumes decrease (example on the volume indicator). This indicates the absence of the buyer and the price can fall to the marked targets.
The main areas:
$0,99-1,01 - local resistance
$0,91-0,94 - local support, first and the main target for short trade . Below this area can be lot`s of long traders syop losses, so the shakeouts of this are is highly possible. In this way the big player accumulates long postition.
$0,77-0,80 - local support, second target with low possibility to happen, but this is the large value area on the horizontal volumes.
💻Friends, press the "like"👍 button, write comments and share with your friends - it will be the best THANK YOU.
P.S. Personally, I open an entry if the price shows it according to my strategy.
Always do your analysis before making a trade.
Long 1inchI really like these prices and she has just wicked into key demand zone I expect she holds and is a nice dip to long
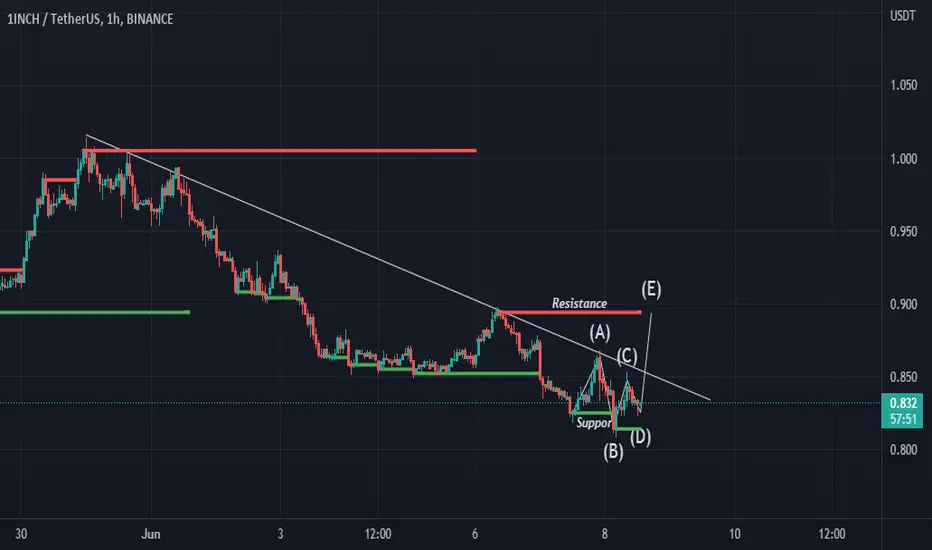
1INCHUSDT market structureSupport is an area in which demand overcomes supply, limiting downward price movement.
Resistance is an area in which supply overcomes demand, limiting upward price movement.
1INCHUSDT H1If the market breaks trendline then we will enter sell trade. If the market forms a bullish candle after taking rejection from the trendline, then we will take a buy trade.

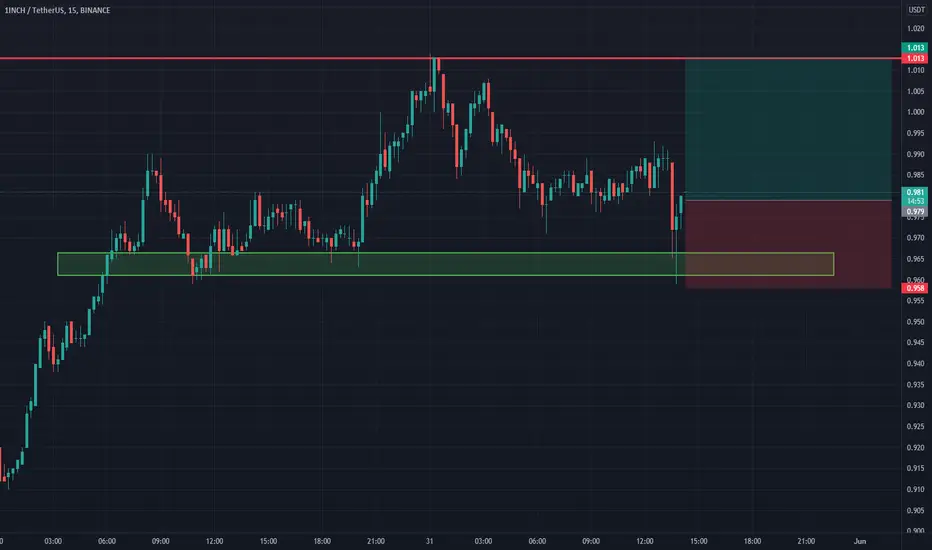
1INCH trading plan 15min and 5min MACD both showed signals to short (shorting from 0.998)(short term)

1Inch Falling Wedge for a ReversalThis Breakout formed on this falling wedge is promising for a minor pull back for a decent correction here. A well managed long position can be helpful for a decent profitable trade.
drawing lines on 1INCHwas just in the middle of drawing some lines on the 1INCH/USDT chart, and simply thoroughly enjoyed the synchronicity on this chart...