1inch/usdt long Attention: this isn't financial advice we are just trying to help people on their own vision.
1INCHUSDT trade ideas
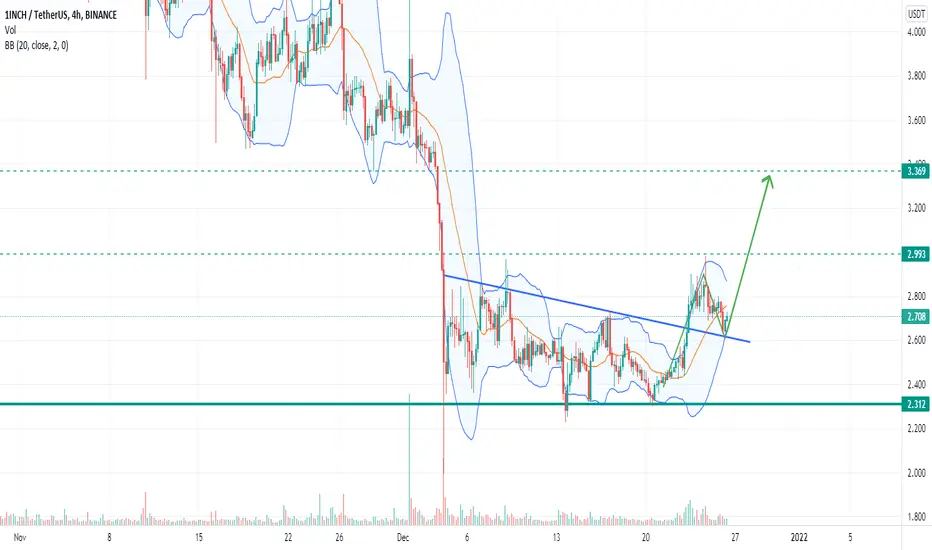
The Setup Is BullishThe Price Is About To Breakout The Descending Channel In Near Future ,1inch Will Explode Soon
You Wont See These Cheap Prices Is Near Future📥 Finally 1INCH Breakout The Trend Line
🔥 1INCH Is One Of The Strongest DEFI Project ,The Setup Is Extremely Bullish ,Next Short Term Target Is 3.5$

1inch Network (1INCH) Buy Zone1inch Network (1INCH) Buy Zone
--------------------
BIAS
Mid-Term : Bullish
RISK : Medium
We can clearly see a symmetrical triangle formed o the 4H chart for 1inch Network, which has confirmed a breakout and multiple retests.
--------------------
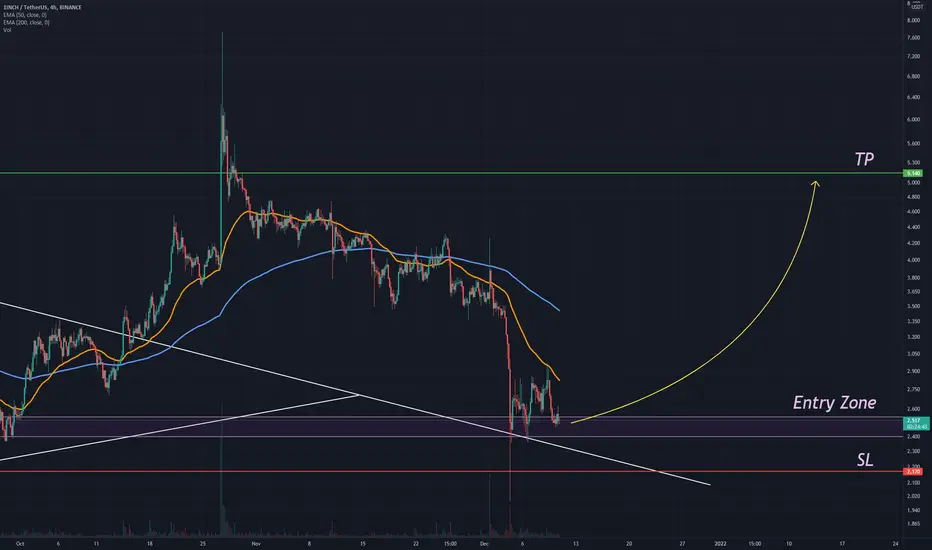
$1INCH/USDT SPOT SETUP
Entry Price : 2.4 - 2.54
TP 1 : 2.655
TP 2 : 2.75
TP 3 : 2.92
TP 4 : 3.3
TP 5 : 3.6
TP 6 : 3.95
TP 7 : 4.6
TP 8 : 5.14
Stop Loss : 2.17
--------------------
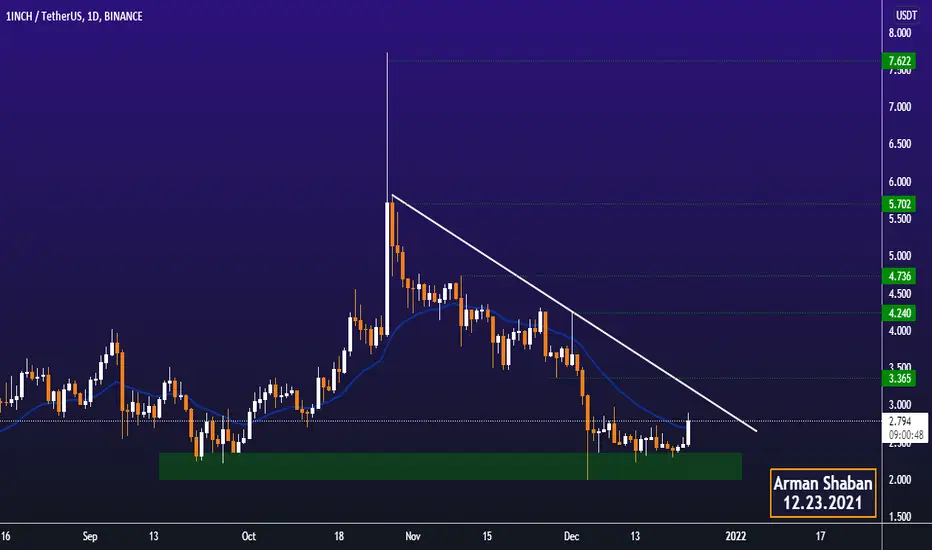
1INCHUSDT Daily TA : 12.23.21 : $1INCHAs we can see, the price is in an important range and recommended to keep an eye on it ... 😉
Follow our other analysis & Feel free to ask any questions you have, we are here to help.
⚠️ This Analysis will be updated ...
👤 Arman Shaban : @ArmanShabanTrading
📅 23.DEC.2021
⚠️(DYOR)
❤️ If you apperciate my work , Please like and comment , It Keeps me motivated to do better ❤️
1INCHUSDTHello Crypto Lovers,
Mars Signals team wishes you high profits.
We are in a daily time frame.
As you can see, the price has reached the ceiling of its channel and is challenging its resistance.
Those who are on profit, can save it and re-enter the trade if it stabilizes above the line. But probably the price may have a correction.
Warning: This is just a suggestion and we do not guarantee profits. We advise you analyze the chart before opening any position.
Wish you luck
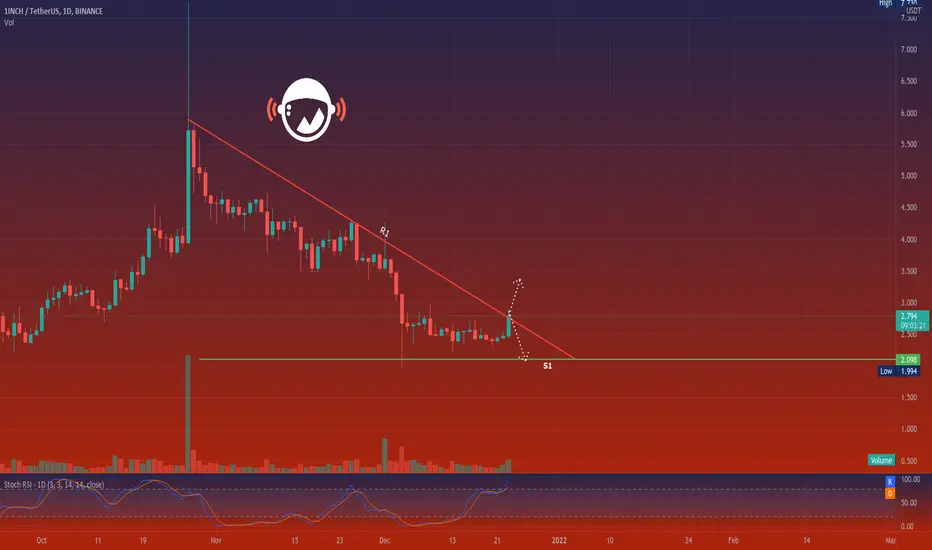
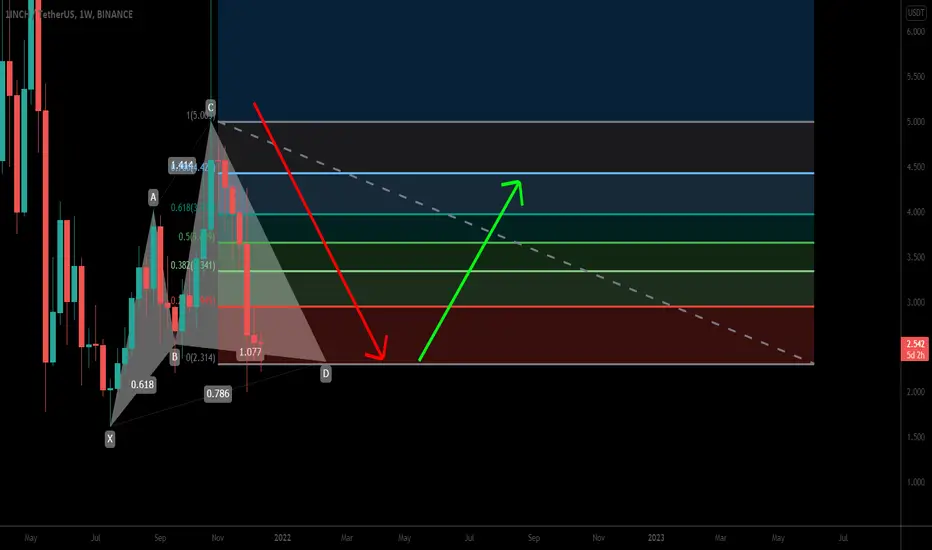
1 INCH is hitting the bottomRecently I've been looking for metaverse projects so I haven't covered much DeFi, however 1INCH is bottoming if it hasn't already bottomed (and not just 1INCH, new signals will follow).
I assumed the worst case scenario which is that bottom of possible retracement was that of last July's dump, in that case current price is currently passing below 0.786 Fib and hitting a strong support area (purple rectangle) which has already worked in the past with volumes similar or bigger of the current one. Assuming price plummets through this area next stop is 1 Fib line. However various indicators presents bullish DIV although here I show you only the SMI.
If you wanna enter 1INCH I think this is the moment at which you've to pay attention (and looking at my signals :D ), keep an eye on price, if we don't go below that support zone you can buy at this level. If we go below wait until we touch 1 Fib retracement's line. If we do go down split your buys because once we touch the lower support you never know if there's a capitulation behind the corner.
Good Luck
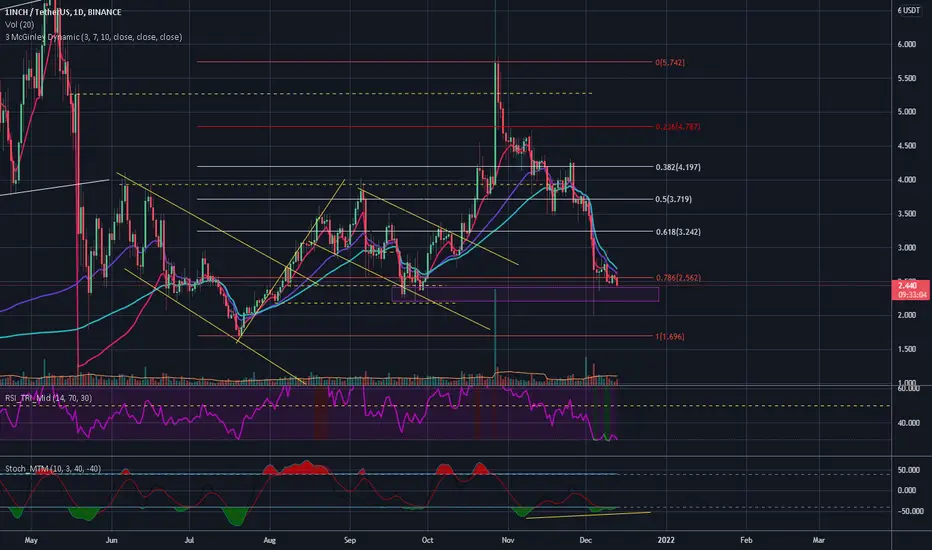
1INCHUSDT DailyPlotting Fibs Retracement Exercise
2 Confluences area of Fib Retracement
50% & 61.80%
23.60% & 23.60%
The possible pattern forming is Cup and Handle.
1inch LONG - BUY Opportunity Risk warning, disclaimer: the above is a personal market judgment based on published information and historical chart data on Tradingview, all analysis is only subjective. Hope investors consider, I am not responsible for your investment decision. Thank you.
Good luck!

TOP StrategyHave a good trading week, folks🔥
There is an analysis update of 1INCH/USDT pair.
It seems like falling wedge formation.
There was a strong bearish sentiment.
According to Elliott Waves theory all the waves are done and now price is heading to the breakout.
So follow the chart and look for the breakout carefully.
_____________________________________________________
If you enjoy my FREE Technical Analysis , support the idea with a big LIKE👍 and don't forget to SUBSCRIBE my channel, you won't miss anything!
Feel free to leave comments✉️
And always remember: "we don't predict, we react".

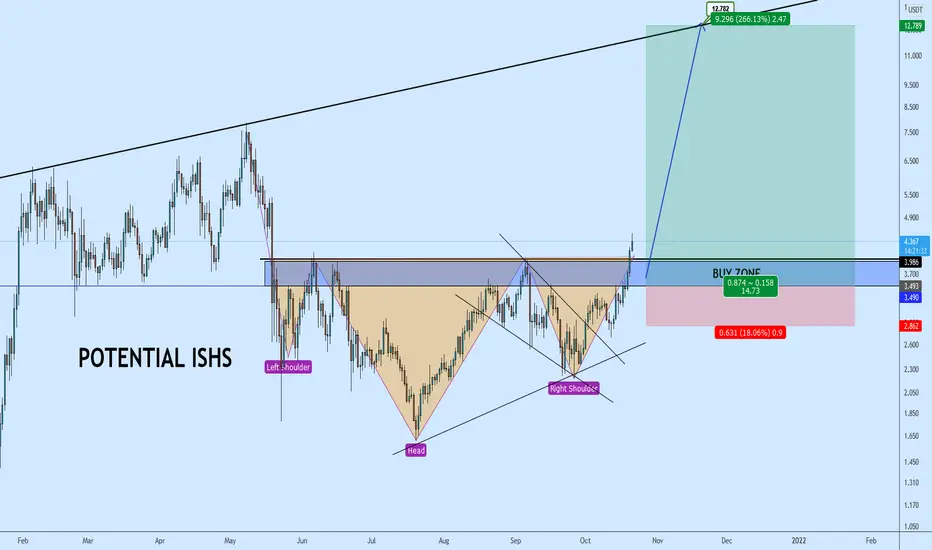
1inchusdt Buy opportunity
Spotted a breakout ISHS pattern here with target looking awesome.
Make sure to follow the suggested BUY zone on the chart and always respect the given stop level.
We would appreciate your support by dropping your likes on our posts and follow us for more important market updates.
Thank you
1inch (1INCH) current BUY opportunity (LONG)Ey frens! 1inch (1INCH) stepping in another small bull cycle with nothing but uptrend possible although with two resistances to fight. First at $4, second around $5.5 a piece.

1INCH to 2INCHChart looks good.
Added some here. 20% to break out of descending channel.
If it breaks, long way to go. Very nice project as well, good for a long hold if the market allows it.

New Impulsive Movement Started 📥 The 1INCH Finally Breakout The Trend Line ,We Expect The Price Will Breakout The 2.6$ Resistance Soon ,Next Targets Are 2.66$, 2.9$ And 3.5$ ,The Setup Is Extremely Bullish

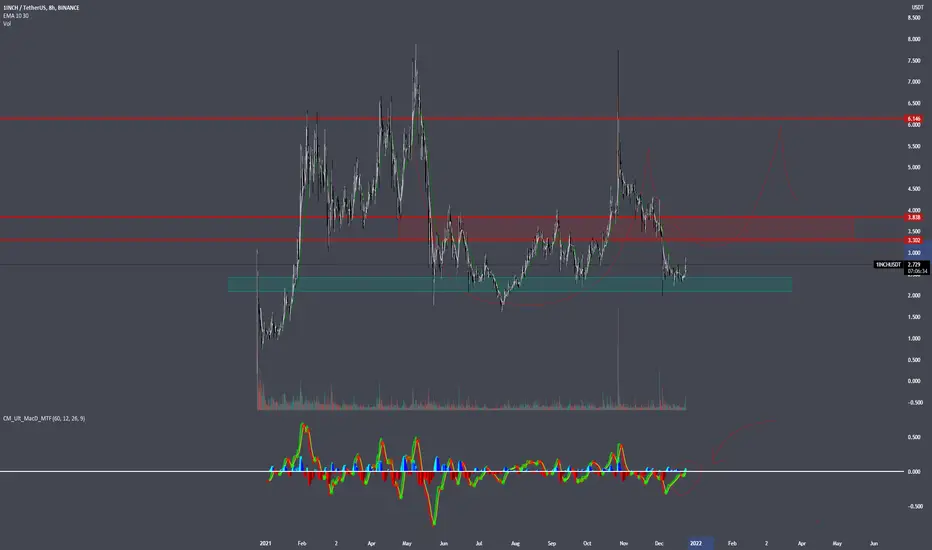
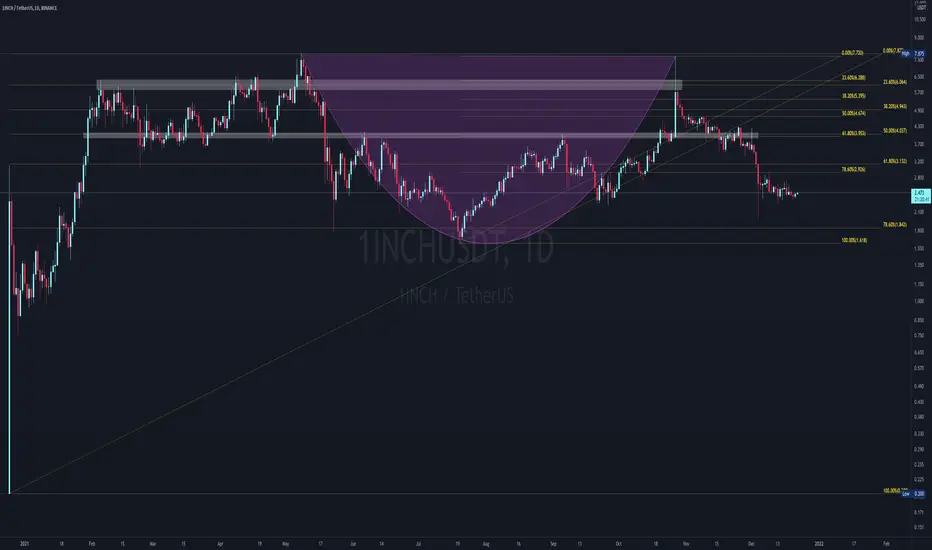
1INCH PERSONAL ANALYSIS IN THE LONG TERMChart shows common supports and resistances based on the price action and the Fibonacci. The total evaluation for the token is neutral-bearish. The coin itself has no established lower highs which means that the sentiment is not a confident long-term investment since buyers are no longer interested in making accumulation phases above the red zone. For each oversold indication in the Relative Strength Index, the retracement ends up in the strong support within the Red Zone and did not form any lower highs, but for every Overbought indication entails that people are interested to buy it IF the momentum keeps going further which, again, is a warning for a potential retracement.
The recommended strategy for the coin is to long it from designated buy orders using partial portfolios DURING a bull market (confirmed both in smaller and larger timeframes) and when the general market turned bearish, short it from the heavy resistance zone or the 0.618 FIB until to the consolidation range.

1INCH formed another bullish Cypher for upto 114% rallyHi dear friends, hope you are well and welcome to the new trade setup of 1inch token.
Previously we had a nice harmonic trade of 1INCH:
Now again on weekly time frame 1INCH formed bullish Cypher pattern.
1INCH/USDT - 1hHELLO
1INCH/USDT : 1h
Looking for a short if there is a distribution.
Target : HTF OB
ALWAYS USE A SL !

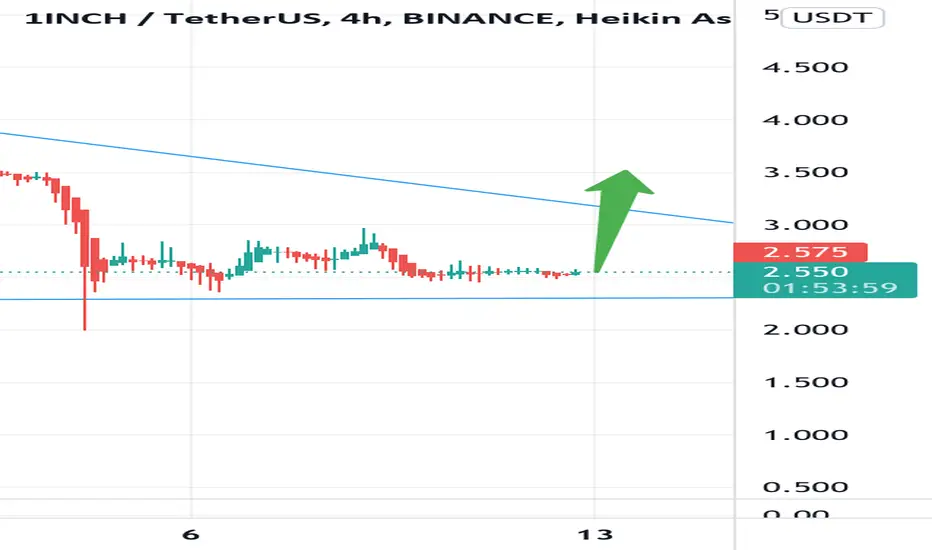
Possible 1inch long1inch idea in the 15m timeframe
SL at 2.51 and tp will be around 2.69 sound about right.
lets see how it will play out!
1inch signal buy for scalp short term1inch
signal buy for scalp
short term
in:2.6
tp:3.4
short term , for scalp

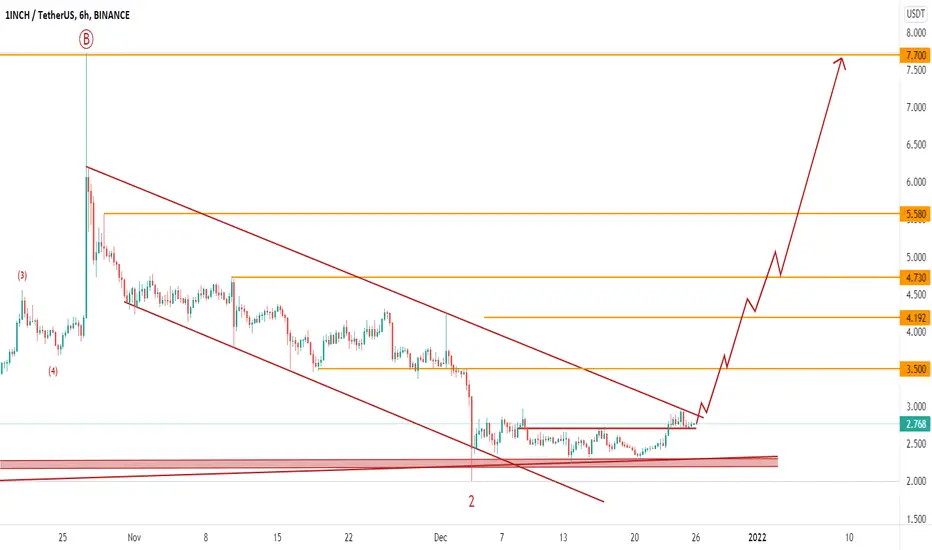
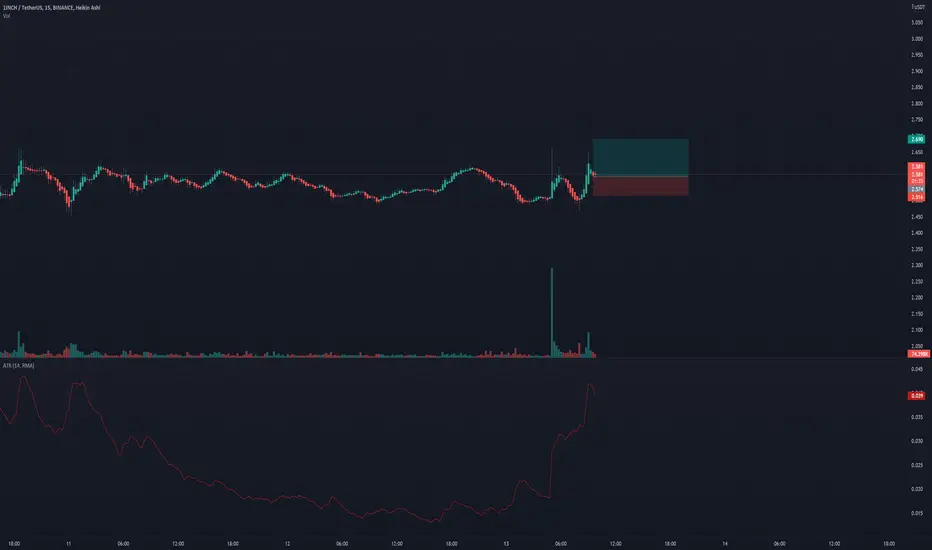
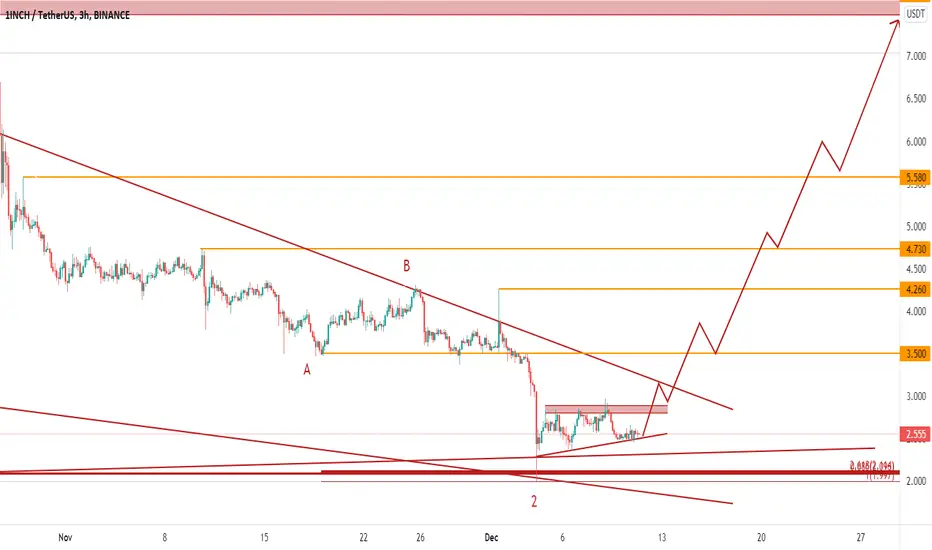
About To Move ,Keep An Eye📥 Again The 1INCH Price Sitting Above The Trend Line ,Expect a Breakout From The Triangle Soon ,Don’t Forget The Short Term Target For 1INCH Is 7.7$
1INCH/USDTlow,mid,high time frames, 1INCH is very OVERSOLD, everytime we have come to the green buy zone we have had really nice pumps, I am personally loading adding at these levels, once we flip the $3.116 Resistance we will have a very explosive pump again imo!
