Apple (AAPL) Shares Jump Following Earnings ReportApple (AAPL) Shares Jump Following Earnings Report
Yesterday, after the close of the regular trading session, Apple released its earnings report, which surpassed analysts’ expectations:
→ Earnings per share: actual = $1.57, forecast = $1.43;
→ Revenue: actual = $94.04 billion, forecast = $89.35 billion.
As a result, AAPL shares surged in the post-market, rising from $207.57 to $212.51.
Media Commentary:
→ The company reported a 13% year-on-year increase in iPhone sales.
→ However, according to Tim Cook, tariffs have already cost the company $800 million and this figure could exceed $1 billion in the next quarter.
Technical Analysis of the Apple (AAPL) Stock Chart
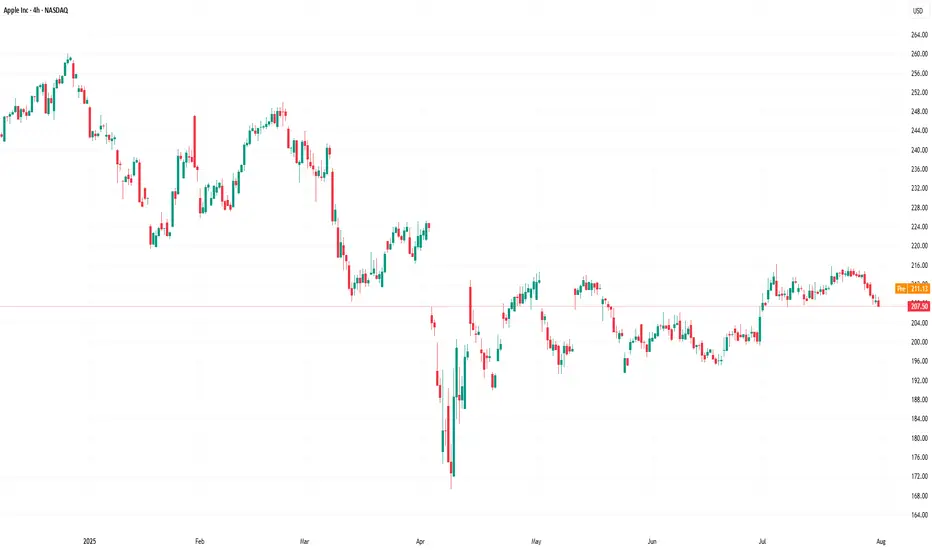
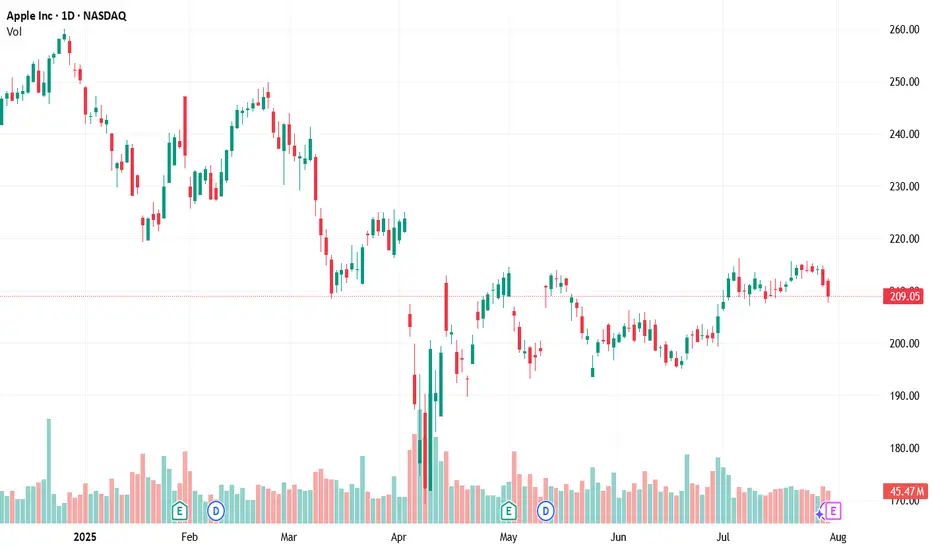
Following the volatility in April 2025, price action has justified the construction of an ascending channel (marked in blue). The $216 level, which has acted as a key reference point since March, remains a significant resistance area, because:
→ It has consistently prevented AAPL from reaching the upper boundary of the channel;
→ Even in the wake of a strong earnings report, the price failed to break through this level in post-market trading.
If the $216 level continues to cap gains in the coming days – despite the positive report – the stock might pull back towards the median line of the blue channel (following the post-market rally). This zone often reflects a balance between supply and demand. While such a retracement would appear technically justified, it may raise concerns among shareholders, particularly when compared to the more aggressive price rallies seen in the shares of other tech giants, such as Microsoft (MSFT), as we discussed yesterday.
From a more pessimistic perspective, peak A may turn out to be yet another lower high within a broader bearish structure that has been forming on the AAPL chart since December 2024, when the stock reached its all-time high around the $260 level.
This article represents the opinion of the Companies operating under the FXOpen brand only. It is not to be construed as an offer, solicitation, or recommendation with respect to products and services provided by the Companies operating under the FXOpen brand, nor is it to be considered financial advice.
AAPL trade ideas
Why Apple Could Be Entering a Structural Correction🍎📉 Why Apple Could Be Entering a Structural Correction ⚠️🔍
After scanning major tech names today, one stock stood out— for all the wrong reasons : NASDAQ:AAPL .
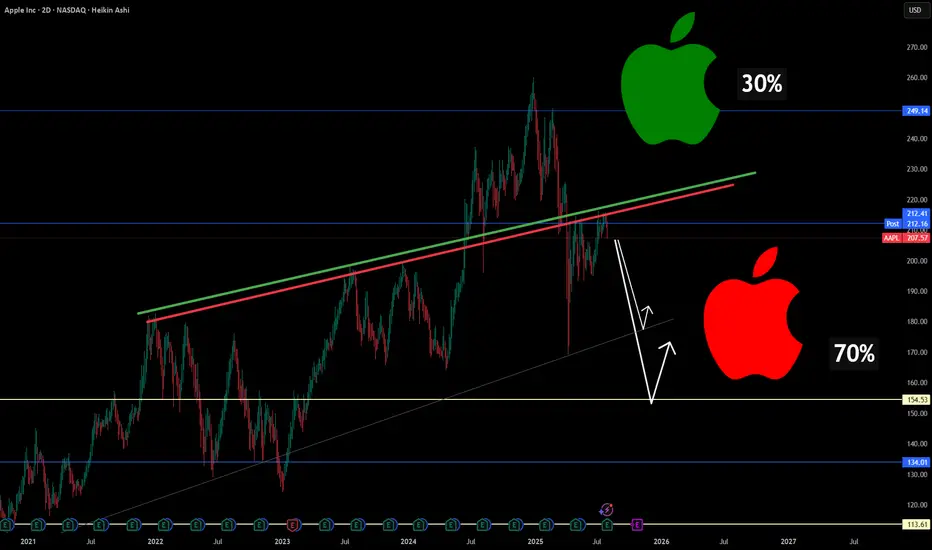
Technically, Apple has broken below long-standing trendline support , and my chart now assigns a 70% probability(roughly guys...roughly and rounded) of further downside vs only 30% upside . But it's not just about the chart...
Here’s the macro storm Apple is walking into:
🧭 1. Trade War Revival
New tariffs on Chinese electronics could cost Apple up to $1.1B/quarter , even as it tries to diversify production. India and Vietnam are promising, but not mature enough to offset risk.
🤖 2. Lagging in the AI Arms Race
While Nvidia, Google, and Microsoft pour $30B+ into AI, Apple is spending less than half that. Analysts weren’t impressed with “Apple Intelligence.” Siri still isn’t leading.
🇨🇳 3. China: Flatlining Growth, Rising Risk
~18% of Apple’s revenue still comes from China. With Huawei resurging and tightening regulations, Apple’s dominance is being chipped away.
🛑 4. Innovation Pipeline: Empty?
There’s no iPhone super-cycle ahead. Vision Pro remains niche. Apple now looks like a mature tech stock without a breakout catalyst —risky when valuation is still premium.
⚖️ 5. Legal Pressure on Both Sides of the Atlantic
The DOJ and EU are targeting Apple’s App Store dominance. If changes are enforced, the service revenue moat weakens.
🔽 Summary: This Isn’t Panic. It’s Repricing.
The market is re-rating Apple based on real structural risks.
Downside levels I’m watching:
📉 177.65 (first support)
📉 154.53 (next key level)
❗️134–113 zone if macro pressure escalates
Chart = structure. Narrative = pressure. Both are aligned.
Let me know your thoughts—still long NASDAQ:AAPL , or hedging this weakness?
One Love,
The FXPROFESSOR 💙
Disclosure: I am happy to be part of the Trade Nation's Influencer program and receive a monthly fee for using their TradingView charts in my analysis. Awesome broker, where the trader really comes first! 🌟🤝📈
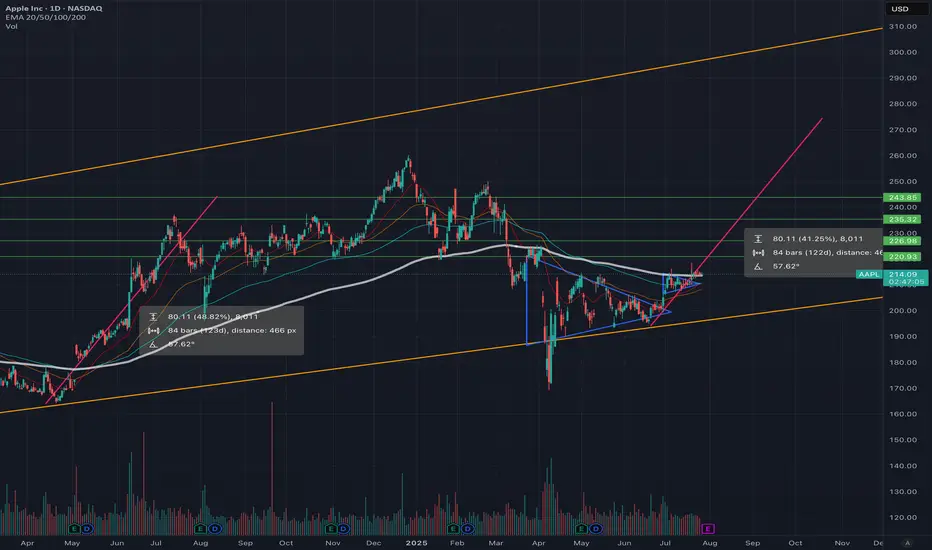
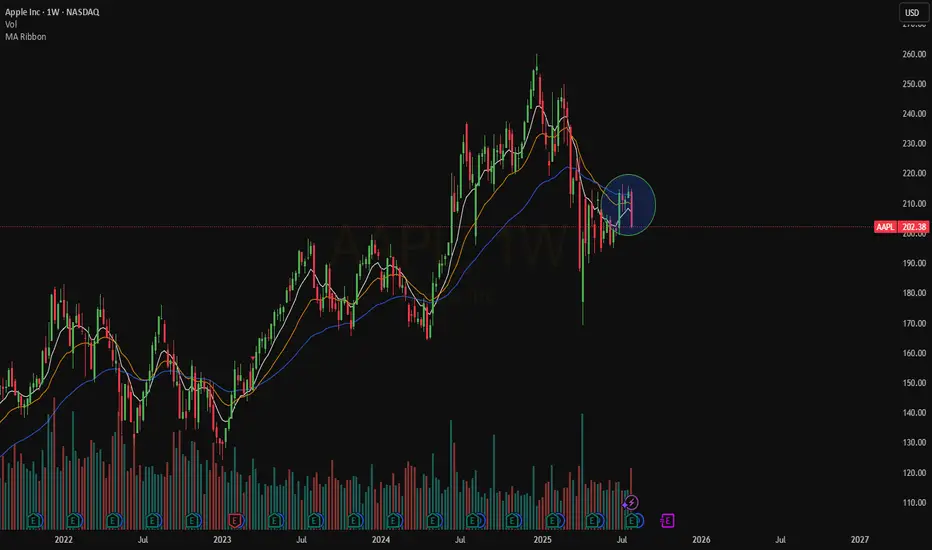
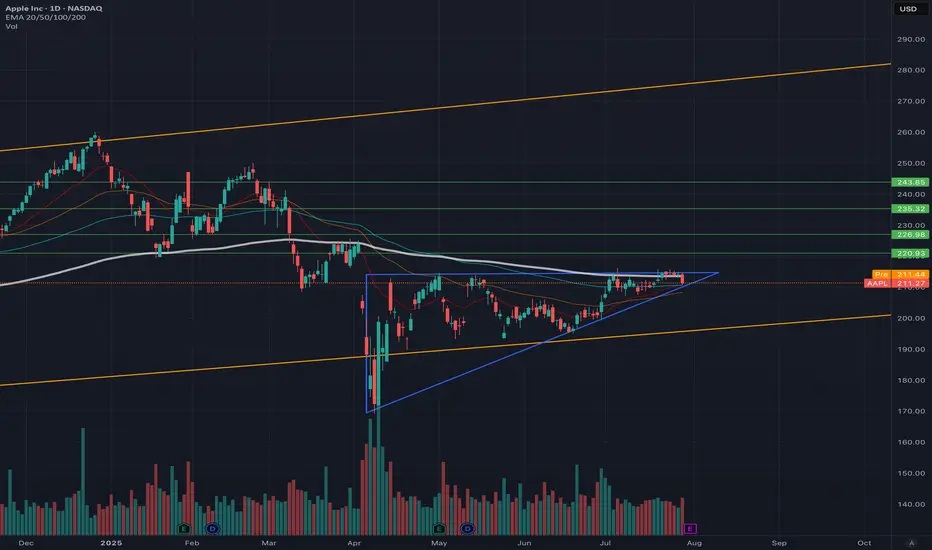
Time to buy? Too much negative press. Buy in Fear- Updated 28/7Apple has been making steady gains since April 8th. Trading volume has been consistently strong, increasing intermittently, with sell pressure exhausted at the 200 USD mark. The price point is now sitting above the 200 daily EMA support, which indicates strong potential for continued upward movement. Apple's earnings are in focus this week, with predictions that they will exceed expectations, but the extent of that exceedance is the question.
Regardless of the competition from Chinese-made phones or Samsung, once you are in the Apple ecosystem, it is rare to leave. Even if buying cycles slow down, Apple often provides innovative solutions to problems that no other provider can. The focus on Apple regarding AI appears slightly biased and carries some elements of fear, uncertainty, and doubt (FUD). It would be foolish to bet against Apple in the long term, even if the necessary technology is obtained through acquisition. With a strong cash position, this should not be an obstacle.
So far, the charts have shown us two positive moves after flag patterns, with resistance just below and around the EMA 200 level, which is now acting as support. The RSI is in the upper regions but is far from overbought, indicating we have a good level of momentum. The accumulation distribution chart also suggests strong support for Apple from institutions. No clear pattern is yet forming on the charts, except for a possible ascending triangle on the weekly, which would be very bullish.
The 50-day EMA is likely to cross the 200 EMA in mid-August, drawing a lot of attention as this would create a Golden Cross. This event would occur just prior to the Apple launch in September, which is rumored to introduce significant updates and advancements. Considering all these factors, I anticipate that Apple will continue its upward momentum for the next six weeks, with some substantial moves followed by pullbacks to support levels. The launch events will likely propel Apple to reach an all-time high (ATH). NFA
Target price is >260
AAPL/SPY ratio + AAPL Weekly Triangle TradeIn this video I cover the weekly Triangle pattern, with explaining my current trade and what moves I am prepared for. I also cover the AAPL/SPY ratio chart and why this may be useful when trading AAPL.

Watching AAPL closely here !!!Not financial advice – just sharing my outlook. 📉📈
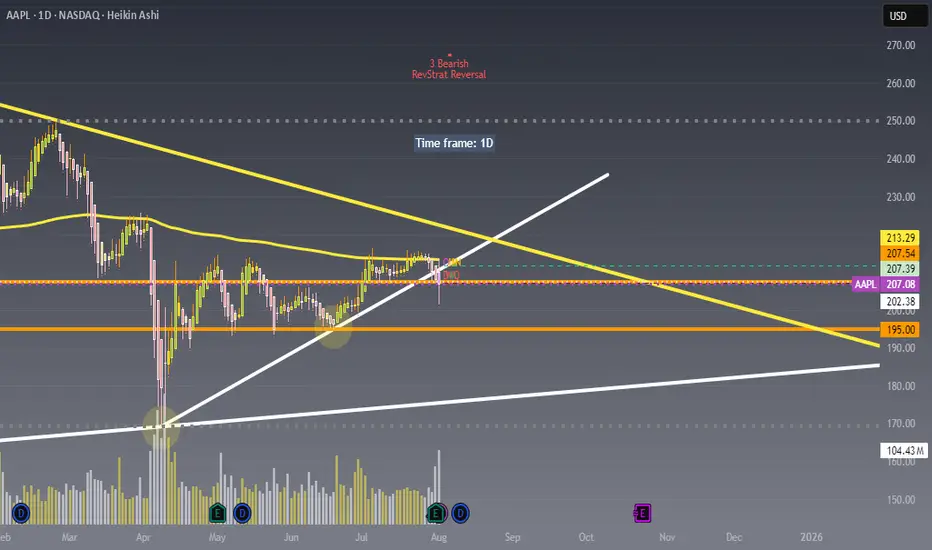
Price is currently rejecting the upper trendline resistance around $213 and struggling to hold above the $207-$208 zone.
Looking for potential puts as long as price remains under this key resistance area.
Will be buying the dip near the $195 or $185 zone where strong demand and trendline support intersect.
Key levels :
Resistance: $213.29 / $207.54
Support: $202.38 / $195.00
Live data chart
A technical analysis summary (moving averages, RSI, MACD, etc.)
A fundamental snapshot of Apple (revenue, EPS, P/E)
Apple - The next major push higher!🍎Apple ( NASDAQ:AAPL ) will head for new highs:
🔎Analysis summary :
Apple has been underperforming markets for a couple of months lately. However technicals still remain very bullish, indicating an inherent and substantial move higher soon. All we need now is bullish confirmation and proper risk management and this setup looks very decent.
📝Levels to watch:
$200, $300
🙏🏻#LONGTERMVISION
Philip - Swing Trader

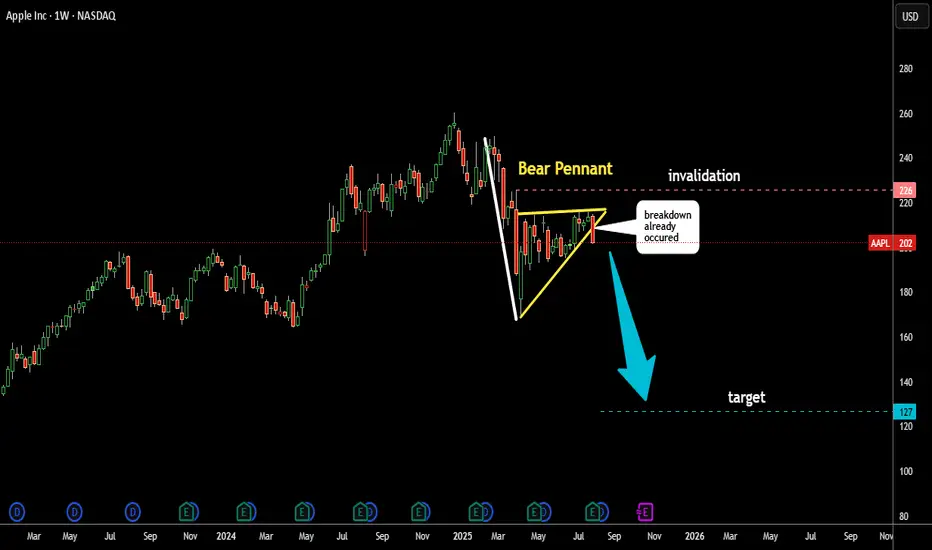
Apple (AAPL): Collapse Is Imminent? Bearish Pennant patternAAPL has already been affected by a Bearish Head & Shoulders reversal pattern earlier this year (see related).
Now, another bearish pattern has formed — a Pennant (highlighted in yellow).
The price has broken below the Pennant’s support, triggering a potential bearish move.
The target is calculated by subtracting the length of the Pole (in white) from the support level of the pattern.
This target is marked with a blue dashed line at $127.
Is Apple melting down again?
I’d love to read your thoughts.
AAPL BUY 1st target $223AAPL is forming a wedge and been lagging for 2 years. I was expecting $182 but we never saw that level, after weeks of $200 range consolidation it's clear this is basing, first target of resistance is $223 then we could be off to the races. I would expect to see this as soon as next week provided #donthecon can stop bullying American companies long enough to focus on important things
Weekly $AAPLNASDAQ:AAPL on the Weekly is still bearish. The price is trading below our EMAs that are even in a bearish order.
We need a stable move above $217 right now.
Not sure will come soon
Since December, Apple LOST 37% of its value (priced in silver).Since December, Apple LOST 37% of its value (priced in silver).
You should NOT be seeing this happen in a bull era for the tech giant.

Apple Stock Falls Despite Strong EarningsApple stock is down more than 4% in the final session of the week, following the company’s earnings release yesterday. Apple reported earnings per share of $1.57, beating expectations of $1.43, while total revenue reached $94.04 billion, surpassing the $89.53 billion forecasted by the market.
However, despite the strong results, the stock is once again facing a notable short-term bearish bias as investor concerns grow. The primary issue is the perception that Apple is falling behind in the race for artificial intelligence, especially compared to its main competitors. In addition, shortly after the earnings announcement, it was noted that the company may face challenges in sustaining growth throughout the remainder of 2025, which has fueled additional downward pressure on the stock.
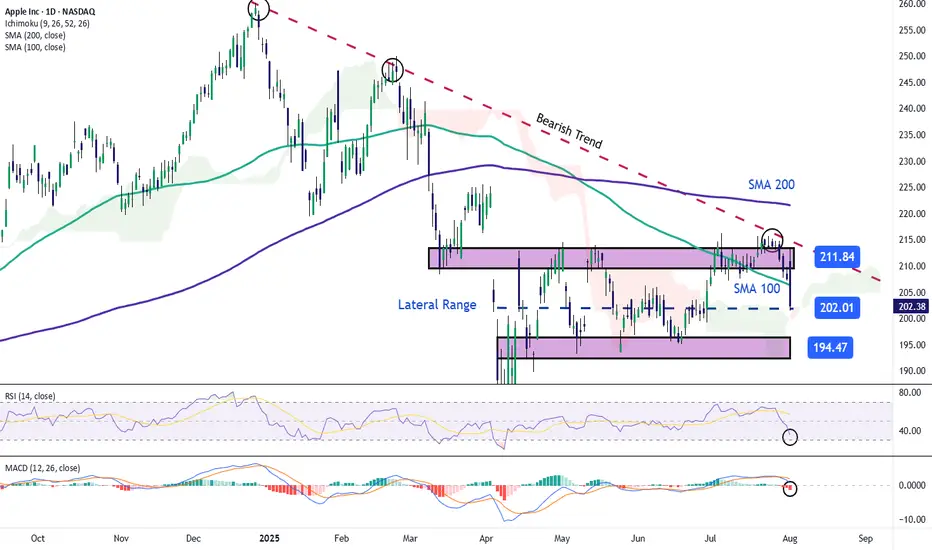
Sideways Range Emerges
In recent weeks, Apple’s price action has consolidated within a clear lateral range, with resistance around $211 and support near $194. So far, price fluctuations have not been strong enough to break this structure, and the latest bearish candlestick has reinforced the validity of the channel. For now, this sideways range remains the most relevant technical formation to watch in the upcoming sessions.
Technical Indicators
RSI:
The RSI line is falling rapidly and is now approaching the oversold zone at the 30 level. If the indicator reaches that threshold, it could suggest a technical imbalance, opening the door to a short-term bullish correction.
MACD:
The MACD histogram has moved into negative territory in recent sessions, suggesting a clear dominance of bearish momentum in the moving average structure. If this persists, selling pressure may continue to build in the near term.
Key Levels to Watch:
$211 – Main Resistance: Upper boundary of the current range. A breakout above this level could trigger a stronger bullish trend.
$200 – Psychological Support: Round number zone, a breakdown here could activate an immediate bearish bias for the next sessions.
$194 – Key Support: Corresponds to recent weekly lows. A move below this level would likely confirm a more extended bearish trend.
Written by Julian Pineda, CFA – Market Analyst
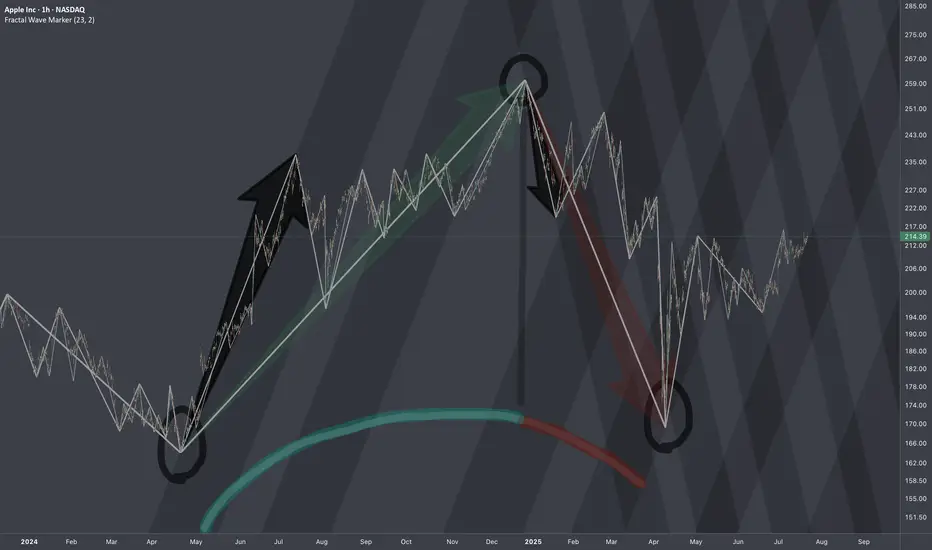
APPLE: Bullish Forecast & Bullish Scenario
The charts are full of distraction, disturbance and are a graveyard of fear and greed which shall not cloud our judgement on the current state of affairs in the APPLE pair price action which suggests a high likelihood of a coming move up.
Disclosure: I am part of Trade Nation's Influencer program and receive a monthly fee for using their TradingView charts in my analysis.
❤️ Please, support our work with like & comment! ❤️

$AAPL: Structure SurgeryResearch Notes
Original Structure:
Altering structure for experimental purposes
Angle of fib channels that rises from cycle low, has been pushed into the past to the top of first major reaction. blue area resembles the change
Reason
The the angle of Fibonacci channels which cover the general decline (from perspective of ATH to end of cycle), are adjusted to the angle of the first bear wave of smaller scale.
Therefore, when it comes to measurements of opposing forces for working out interference pattern, having this symmetric approach of mapping interconnections is fair.
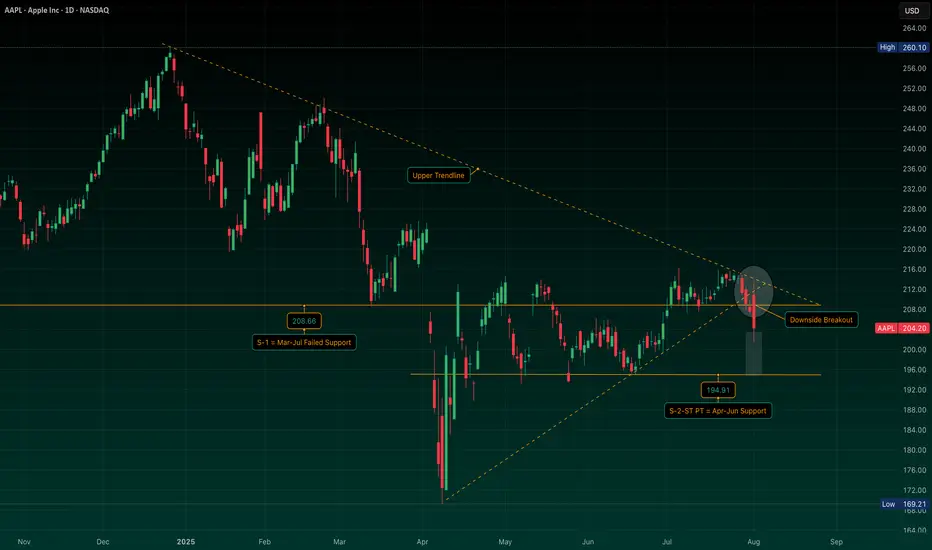
AAPL: Symmetrical Triangle Breakdown with S-2 in FocusAAPL has now broken below a well-defined symmetrical triangle structure, as well as the ~$208 S-1 support area I’ve highlighted.
I’m watching the $194.91 zone (S-2), which served as a key support and pivot earlier this year. If price heads into that area, I’ll be looking for confirmation and stabilization before initiating a position.
If the setup aligns, I plan to trade it via Sep/Oct put sales around the $170/$175 strikes -- targeting levels I’d be comfortable owning if assigned, and collecting premium if not.
Not stepping in early here… just tracking structure, respecting price action, and planning around risk-defined entries. We’ll see how this one plays out. Stay tuned.
$AAPL LongNASDAQ:AAPL sold off hard after earnings and fell outside of the bands and still holding the cloud. Could have a nice bounce here.

AAPL EARNINGS TRADE SIGNAL (JULY 31)
### 🍏 AAPL EARNINGS TRADE SIGNAL (JULY 31) 🚀
📊 **AAPL Call Play** — Earnings Strategy
🧠 Multi-model conviction: **75% Bullish Bias**
---
### 🔍 Fundamental Drivers
✅ TTM Revenue: +5.1%
✅ Gross Margin: 46.6%
✅ 8 straight earnings beats
⚠️ Sector shift: growth → value = caution
📉 TTM EPS Est: \$8.31 (+29.4% growth est.)
🧮 **Score**: 8/10
---
### 💰 Options Flow Breakdown
🔥 IV Rank: 0.70
🔵 Bullish OI @ \$220C = 25,950 contracts
🔻 Skew: Heavy puts @ \$197.5 / \$200
⚠️ Gamma squeeze possible near \$220
📈 **Score**: 8/10
---
### 📉 Technicals
📍 RSI: 39.3 (Oversold)
📉 Trading below 20DMA (\$211.64)
🟥 Low volume pre-earnings = low conviction
📌 Support: \$207.5 | Resistance: \$220
📉 **Score**: 6/10
---
### 🌐 Macro Setup
⚠️ Supply chain pressures
⚠️ Regulatory risk ongoing
🔄 Growth → Value rotation still underway
🌐 **Score**: 5/10
---
### 🧠 Trade Setup (Call Option)
* 🎯 **Strike**: \$220
* 💵 **Entry**: \$0.87
* 📅 **Expiry**: 08/01 (2DTE)
* 📈 **Target**: \$2.61
* 🛑 **Stop**: \$0.43
* ⚖️ **Risk**: 2% of portfolio
* ⏰ **Timing**: Enter before close, report after market
🧮 Expected Move: ±5.0%
🔒 Confidence Level: 75%
---
### ⚙️ Exit Plan
✅ Profit: Exit @ \$2.61
❌ Stop: Exit @ \$0.43
🕒 Time Exit: Force close within 2 hours post-earnings
---
📣 **EARNINGS SCALP PLAY**
— AAPL is oversold w/ strong EPS beat history
— Bullish OI stacking at \$220
— High gamma setup, low IV risk = 💥
\#AAPL #EarningsTrade #CallOption #TradingView #0DTE #OptionsFlow #GammaSqueeze #UnusualOptions #AppleEarnings #SwingTrade #TechStocks

Ascending Triangle APPLE! Could be a big move up soon?!Very short technical idea. Apple could be forming a massive Ascending Triangle Pattern, which would be super bullish for this Magnificent 7 stock. It could also be looking to break soon!
It's a bullish continuation pattern, which usually indicates that an existing upward trend will persist once the pattern is completed.
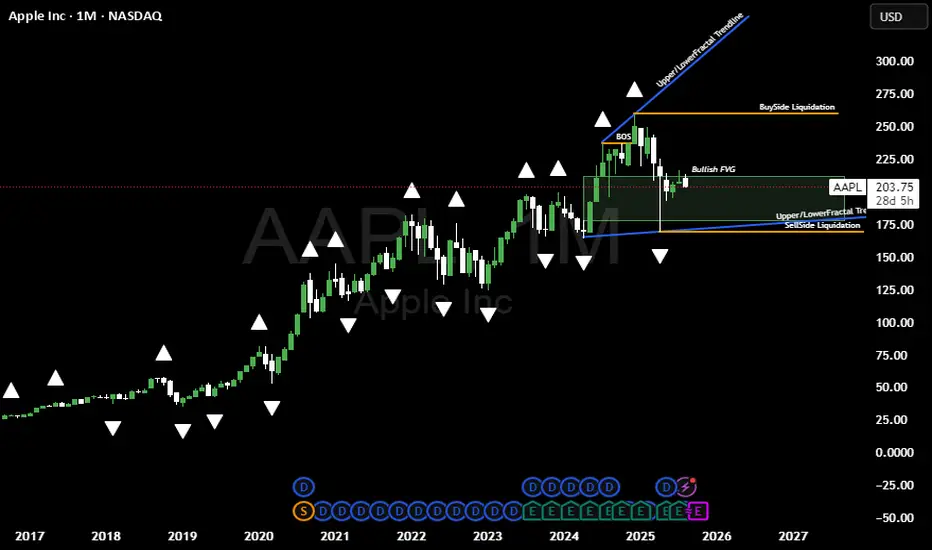
Bullish Idea on APPLNASDAQ:AAPL / Lovley day its been a while, am planing to share my views on the markets atleast once a week from now going forward. Basically on this bias idea above here @LutthMage we are leaning more on long term holding, WITH AN ADVANTAGE OF TAKING SHORT TERM TRADES BASED ON OUR LONG TERM INVESTMENT IDEA WE ARE SURE YOU WILL UNDERSTAND AS TIME GOES BY.
NOW LET THE GAMES BEGIN```
On the chart above we a basically bullish due to 4 reasons
1. The trend is our friend its currently bullish, because AAPL is BREAKING STRUCTURE NO VISIBLE Change of character as of yet
2. We got a widening channel currenly bouncing of the lower level line of the channel.
3. Price is playing around a Bullish FVG
4. APPLE JUST CREATED SELL SIDE LIQUIDITY.
We will keep you posted on the short term trades we execute based on this bullish bias on APPL, ofcourse only if they do appear for now we sit and do the hardest thing to do wich is NOTHING.
AS TIME GOES BY YOU WILL CHARACTERIZE A WASH RINSE AND REPEAT PROCESS FROM US @LutthMage NASDAQ:AAPL

APPL/METAHi every one
You should gradually sell Apple and buy Meta.
From now on, I will call this type of analysis inter-market analysis.

Apple Is Down YTD Ahead of Earnings. What Does Its Chart Say?Apple NASDAQ:AAPL will report earnings Thursday at a time when the tech giant has been struggling more than most other "Magnificent Seven" stocks or higher-end, AI-focused companies. What does fundamental and technical analysis say about AAPL heading into the report?
Let's see:
Apple's Fundamental Analysis
Apple was down 14.4% year to date as of Friday's close, while the S&P 500 was up 8.6%.
Meanwhile, fellow Mag-7 members Nvidia NASDAQ:NVDA and Microsoft NASDAQ:MSFT -- the only publicly traded U.S. companies other than Apple with more than a $3 trillion market cap -- are up 29.2% and 21.9%, respectively.
AAPL has lagged largely because the consumer-electronics giant has dragged its feet on innovation, as well as on the great chase into the world of generative artificial intelligence.
Readers might recall that back in early May, Apple's board increased the firm's dividend payout and authorized a whopping $100 billion share-repurchase program in an attempt to attract investment. But so far, that hasn't seemed to impress Wall Street much.
As for Apple's upcoming fiscal Q3 earnings, the Street is looking for the company to post $1.42 a GAAP EPS of $1.42 on some $89 billion of revenue.
That would represent 1.4% earnings growth and 3.7% better revenues from the $1.40 EPS on $85.8 billion of revenues that the iPhone maker reported in the same period last year.
If this sounds like weak growth, it is. Apple saw 6% year-over-year growth during fiscal Q2 2025, as well as 4.9% in fiscal Q3 2024.
In fact, 20 of the 29 sell-side analysts that I found that cover AAPL lowered their earnings estimates lower for the fiscal Q3 since the period began. (Five have boosted their numbers, while four have made no changes.)
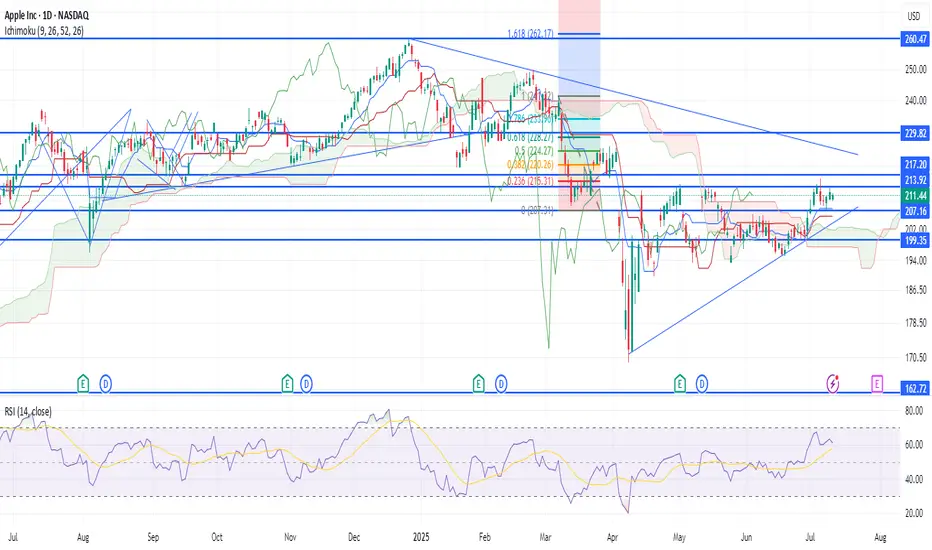
Apple's Technical Analysis
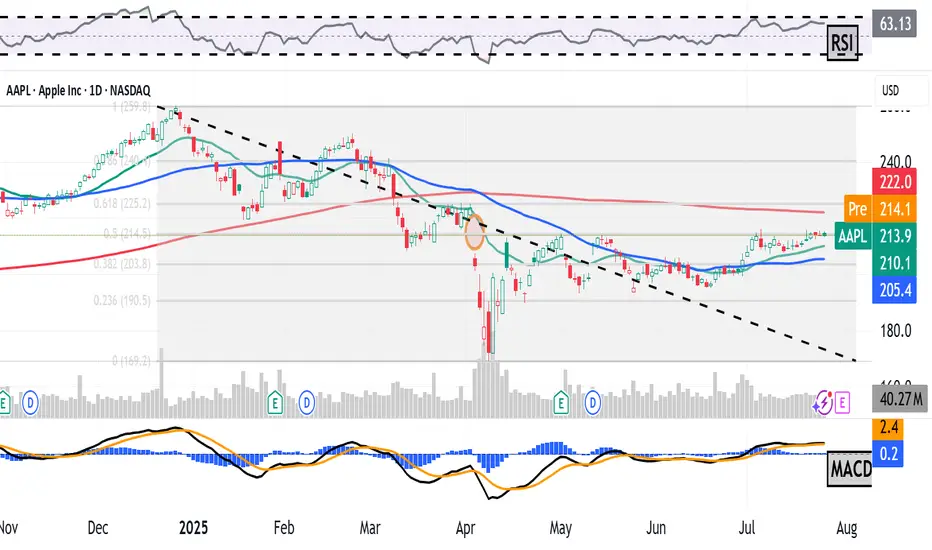
Now let's look at Apple's chart going back to November:
Readers will see that the stock appears to be at a crossroads.
On one hand, Apple developed a "triple-top" pattern of bearish reversal beginning in early May, as marked with red boxes at the above chart's right.
A triple top occurs when a "double-top" pattern fails and a stock retests its resistance from below for a third time.
However, we can see at the chart's extreme right that AAPL has just about reached its resistance level for a fourth time.
What now? Often when someone knocks on a door often enough, that door will open.
Perhaps even more interestingly, we can see that Apple's roughly $215 resistance level (vs. the $213.88 AAPL closed at Friday) appeared at almost precisely the 50% retracement point of the stock's December 2024-April 2025 sell-off.
Note that while they're included with most Fibonacci retracement models, 50% retracements aren't true Fibonacci levels. They are their own thing, but just as technically noteworthy.
All in, Apple now has two potential upside pivots.
One would be the break above the apex of the pattern that's in place. The other would be Apple's 200-day Simple Moving Average (or "SMA," marked with a red line above.)
That creates a potentially bullish set-up. Apple could see support from both its 21-day Exponential Moving Average (or "EMA," denoted with a green line above) and from its 50-day SMA (the blue line above). That's likely where we'll find out if professional managers are willing to defend the stock.
Meanwhile, Apple's Relative Strength Index (or "RSI," marked with a gray line at the chart's top) is robust, but not in a technically overbought state.
Similarly, the stock's daily Moving Average Convergence Divergence indicator (or "MACD," denoted with black and gold lines and blue bars at the chart's bottom), has a bullish look to it, but not overwhelmingly so.
The histogram of Apple's 9-day EMA (the blue bars) is above zero, which is historically a short-term positive signal.
Additionally, both the 12-day EMA (black line) and 26-day EMA (gold line) are above zero, with the black line above the gold line. That's traditionally a short- to medium-term positive signal as well.
Still, it's what happens at that fourth top in the above chart that will likely decide Apple's fate technically.
(Moomoo Technologies Inc. Markets Commentator Stephen “Sarge” Guilfoyle had no position in AAPL at the time of writing this column.)
This article discusses technical analysis, other approaches, including fundamental analysis, may offer very different views. The examples provided are for illustrative purposes only and are not intended to be reflective of the results you can expect to achieve. Specific security charts used are for illustrative purposes only and are not a recommendation, offer to sell, or a solicitation of an offer to buy any security. Past investment performance does not indicate or guarantee future success. Returns will vary, and all investments carry risks, including loss of principal. This content is also not a research report and is not intended to serve as the basis for any investment decision. The information contained in this article does not purport to be a complete description of the securities, markets, or developments referred to in this material. Moomoo and its affiliates make no representation or warranty as to the article's adequacy, completeness, accuracy or timeliness for any particular purpose of the above content. Furthermore, there is no guarantee that any statements, estimates, price targets, opinions or forecasts provided herein will prove to be correct.
Moomoo is a financial information and trading app offered by Moomoo Technologies Inc. In the U.S., investment products and services on Moomoo are offered by Moomoo Financial Inc., Member FINRA/SIPC.
TradingView is an independent third party not affiliated with Moomoo Financial Inc., Moomoo Technologies Inc., or its affiliates. Moomoo Financial Inc. and its affiliates do not endorse, represent or warrant the completeness and accuracy of the data and information available on the TradingView platform and are not responsible for any services provided by the third-party platform.
AAPL LIVE PRICE ACTION JULY 23 2025This is the price action for AAPL. I have discussed indicators as well. Do not blindly trade without understanding the logics. I am long here with stocks only.
NOTE: DO NOT BLINDLY BUY
