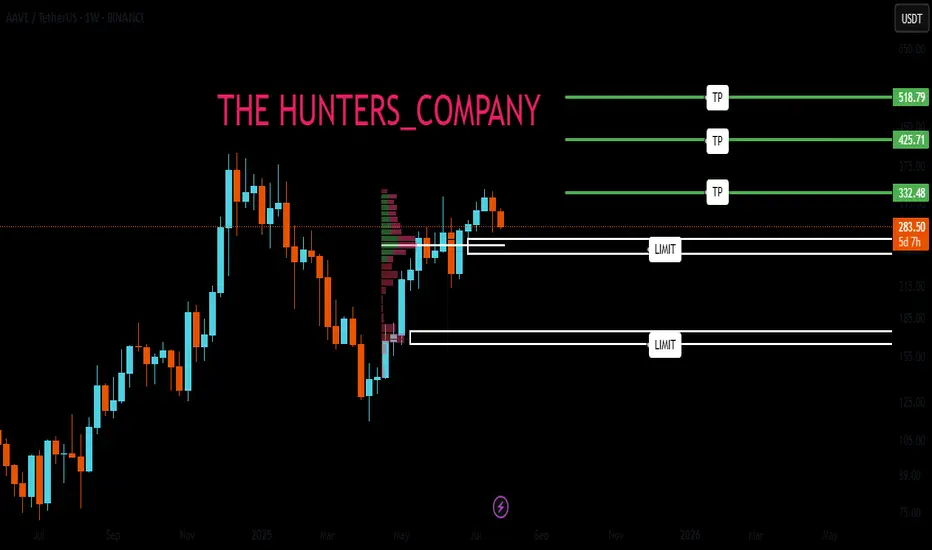
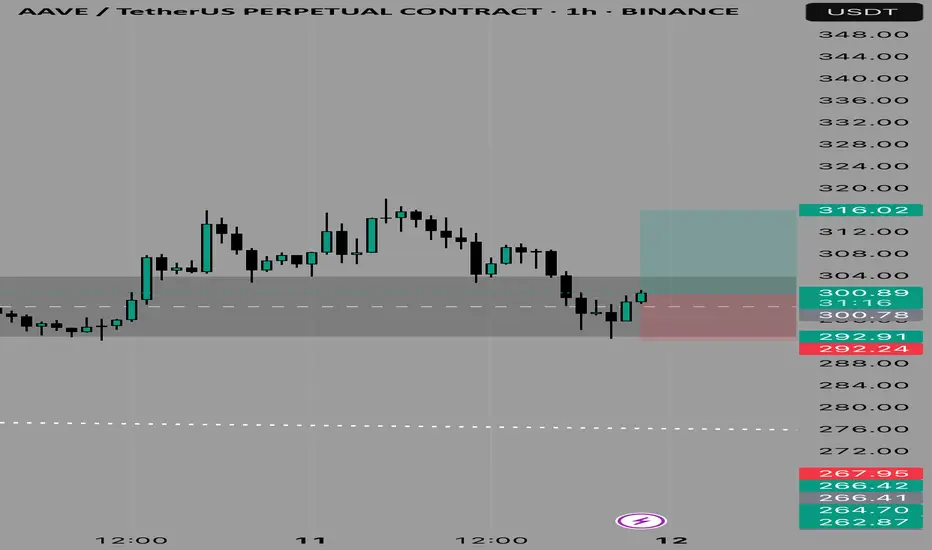
Aave shor to $276 todayAAVE Short Setup (Limit Order) just filled
Entry: $288.89
SL: $293.15+
TP: $276.00
AAVEUSDT trade ideas
AVVE IS TIME TO BUYHello friends🙌
Given the good growth we had, now in a correction there is a good opportunity for the price to reach our high volume range or even lower and we can buy in steps and with risk and capital management.
🔥Follow us for more signals🔥
*Trade safely with us*
TradeCityPro | AAVE Holds Gains as Altseason Optimism Builds👋 Welcome to TradeCity Pro!
In this analysis, I’m going to review the AAVE coin for you. It’s one of the major DeFi coins active in the lending sector and currently ranks number 1 in terms of TVL.
✔️ The token itself has a market cap of $4.58 billion and is ranked 29 on CoinMarketCap.
📅 Daily Timeframe
On the daily timeframe, since our last analysis, the price has increased by over 100%, and the trigger for long or buy positions was activated.
🔄 There was a descending trendline on this coin, and the trigger for its breakout was 148.17. After breaking that level, we could open a long position.
🚀 However, the main trigger was 194.97, and the primary uptrend started with the break of that level, continuing up to a high of 328.9.
📊 The issue with this current uptrend is that, as you can see in the second leg, there is clear weakness, which is not a good sign for the continuation of this trend.
📈 The current top at 328.9 is not far from the previous high, forming a double top-like structure, leading to a strong bearish divergence in the RSI.
💥 If RSI confirms a breakdown below 50, this divergence will become active and a correction toward 222.10 may occur. A break of that level would be the first signal of a potential trend reversal for AAVE.
⭐ On the other hand, if price wants to continue upward, we have a very important resistance at 383.59.
🔍 Breaking this resistance would initiate an uptrend in higher cycles and could even lead to a new ATH for this coin.
💼 I plan to open a long position if the 328.9 resistance is broken, and for spot purchases, I will wait for a breakout of 383.59.As long as the price remains above 279.45, I am not considering any short positions.
📝 Final Thoughts
This analysis reflects our opinions and is not financial advice.
Share your thoughts in the comments, and don’t forget to share this analysis with your friends! ❤️

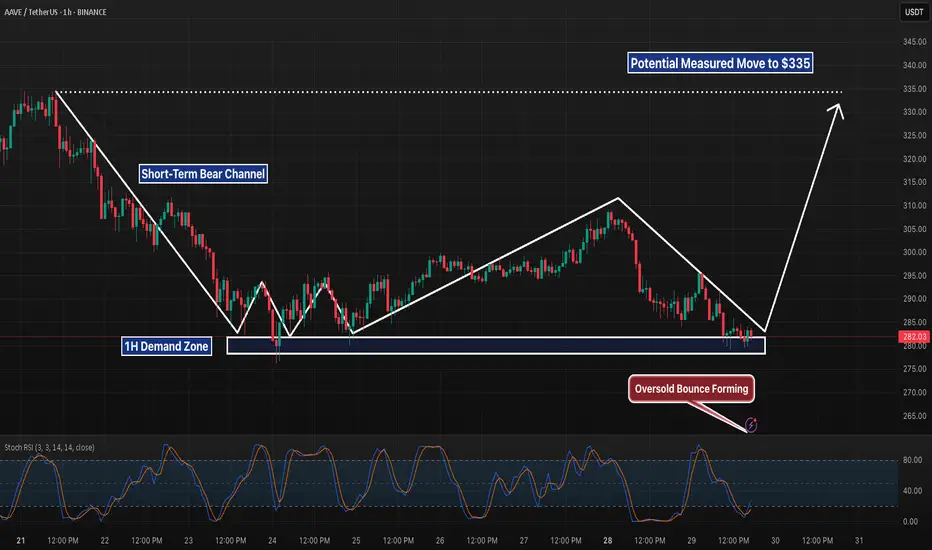
AAVE 1H – Triple Tap Support + Bullish Divergence Incoming?AAVE is painting a compelling reversal setup on the 1H timeframe. After a sharp selloff last week, price has tapped the $278–282 demand zone multiple times — each time printing higher local lows on the Stochastic RSI and showing signs of exhaustion from sellers.
This zone has now been tested three separate times, forming what looks like a triple-bottom structure. During the latest retest, Stochastic RSI is deeply oversold and beginning to curl up — suggesting that momentum may shift in favor of the bulls soon.
We’re also approaching the apex of a descending trendline, meaning compression is reaching its limit. A clean break and reclaim above $290 could be the first real sign of trend reversal, with a potential target near the previous range highs around $335 if momentum follows through.
📊 Why This Setup Matters:
– Strong historical support zone with visible reactions
– Repeated seller failure to break the zone cleanly
– RSI bullish divergence building beneath structure
– Clear invalidation level below support
– Risk-reward skewed in favor of a bounce play
This isn’t confirmation yet — but it’s definitely a chart worth watching closely over the next session. If bulls step in with volume, this could catch momentum fast.
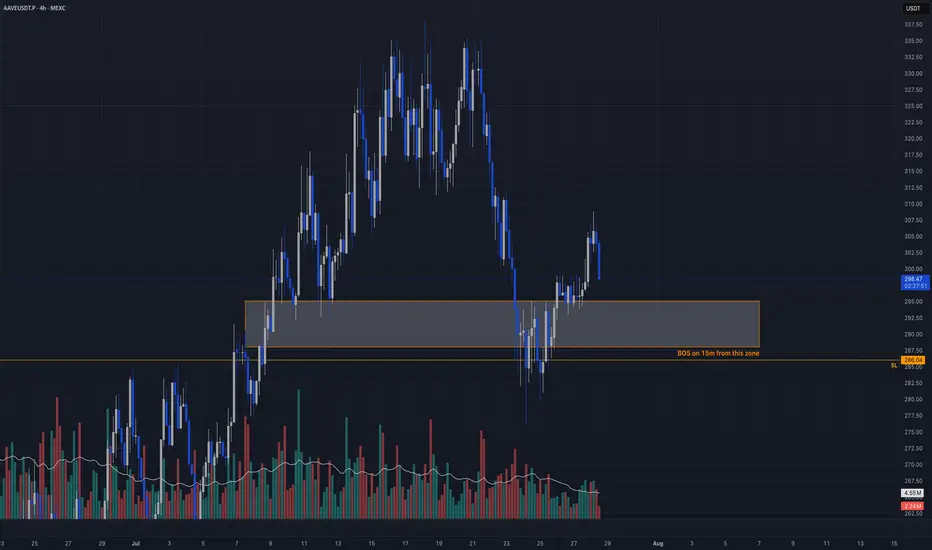
AAVE Reversal + Breaker Block Retest + BOS TriggerCandle Craft fam — we’re watching a sharp reclaim play unfold on AAVEUSDT.P (4H). After a hard drop and sweep of structure, price has returned to a demand zone that’s already printed bullish intent on the lower timeframes.
Now it’s all about precision and confirmation.
⸻
📈 Bias: Long
🧠 Strategy: Reversal + Breaker Block Retest + BOS Trigger
📍 Entry Plan:
▫️ Entry Zone: 288.00 – 294.50 (watch M15 for BOS inside zone)
🛡️ Stop Loss: 286.00
🎯 Take Profits:
• TP1: 305.00
• TP2: 318.00
• TP3: 330.00+
⸻
🧠 Why This Trade?
– BOS confirmed on M15 after reclaim of breaker block
– Price swept structure then bounced — bullish shift
– Demand zone has volume support + previous reaction
– HTF shows reversal potential off strong base
⚠️ Execution note: Wait for M15 confirmation again on re-entry into zone → CHoCH/BOS + volume
⸻
This isn’t the first leg. It’s the reload.
Let structure confirm the story.
—
Candle Craft | Signal. Structure. Execution.
Aave (AAVE): Sellers Taking Over | Looking For Bearish CME FillAave caught our attention with current sell-side dominance, which might lead to a breakdown from the local neckline zone, which then again will lead the price towards the bearish CME gap (to fill it).
What we are looking here is a proper breakdown; after that, we want to see steep movement to lower zones and then a proper MSB to form (which would give us a buy entry)
Swallow Academy

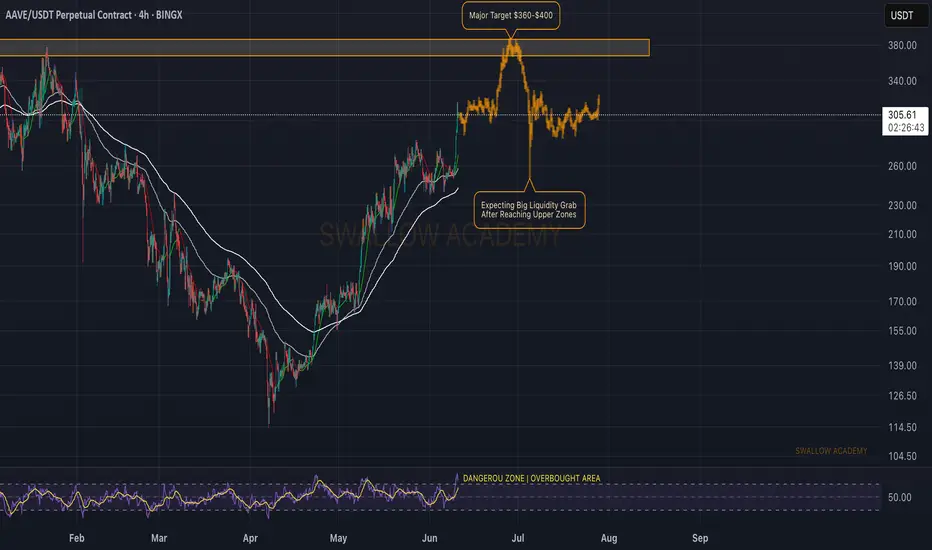
Aave (AAVE): Aiming For $360-$400 Before Bigger Long SqueezeAave coin has had a good upward movement, and now we are inches away from a major resistance zone where we will be expecting to see some kind of big liquidity movement to lower zones.
RSI is overbought so we are already in dangerous zones, but we are pretty sure that before the big dump, we will reach the resistance zone so for now, this is our target area!
Swallow Academy
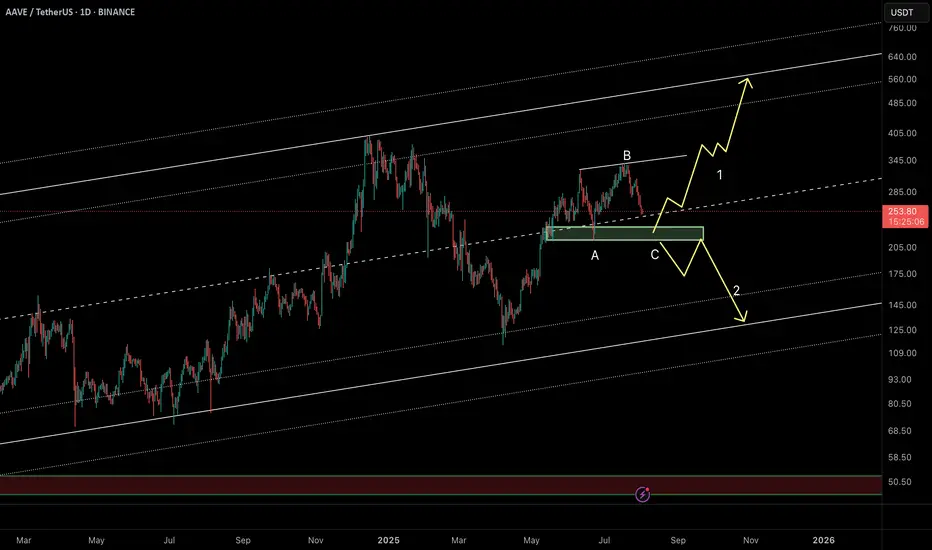
AAVE Daily Chart – Key Buy Zone & Two ScenariosAAVE is currently moving within a well-defined ascending channel on the daily timeframe. The last major bullish leg began from the $120 support and surged nearly +180% to a local high near $330.
Now, after a 25% pullback, price is consolidating around the midline of the channel near $250. More importantly, there’s a strong bullish order block sitting between $220–230, making this a low-risk buy zone with a stop below the order block.
🔸 Scenario 1 (bullish preferred):
Price dips into the $220 OB zone, completes a possible ABC correction, and launches a new bullish leg targeting the channel top above $500.
🔸 Scenario 2 (bearish alternate):
If the $220 order block fails, deeper correction could follow toward the channel bottom near $135.
⏳ This is a critical area to watch for reaction – Smart Money will likely show its hand soon.
🔗 Analysis by CryptoPilot
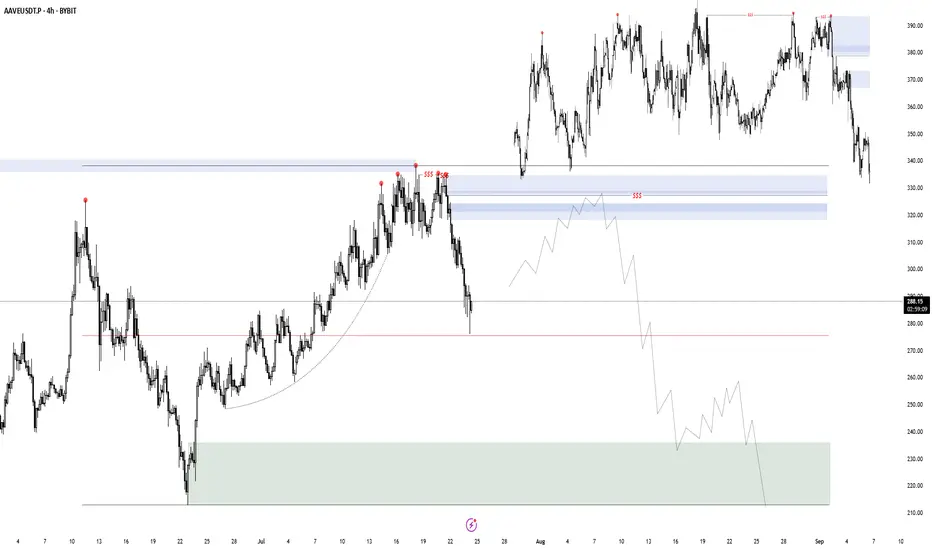
AAVE DistributionI'm looking for a potential model 2 here after mitigating supply and building a good looking top. It would need confluence with BTC.D and USDT.D, since i am more focused on reaccumulations at the moment. My alert is at the POI, i will decide later if i take it or not.
AAVE – Eyeing Reversal From Daily Demand for $400 TargetCurrent Structure:
AAVE recently rejected from 1M S/R at $332.54 and pulled back into a confluence support zone—overlapping 1W order block (OB), 1D OB, and previous resistance now flipped support ($277–$290 zone, marked blue).
Buy Zone:
Watching the blue box area for bullish reversal triggers. This is a high-probability demand zone due to multiple timeframe confluence.
Trigger:
Wait for a bullish reaction/candle confirmation inside the blue zone. Ideal scenario: bullish engulfing, sweep of the low and reclaim, or a strong bounce with rising volume.
Targets:
Primary upside target: retest of the 1M S/R at $332, then continuation toward $400 if momentum sustains.
Invalidation:
If price closes below the 1D OB ($274.84), long setup is invalidated—risk of further downside increases.
AAVE is testing a major support confluence zone, combining weekly and daily order blocks. This area previously acted as resistance and now presents a strong demand zone. If bulls defend this zone and trigger a reversal, there’s a clear runway back to previous highs and potentially $400. This setup offers a favorable risk/reward profile with tight invalidation.

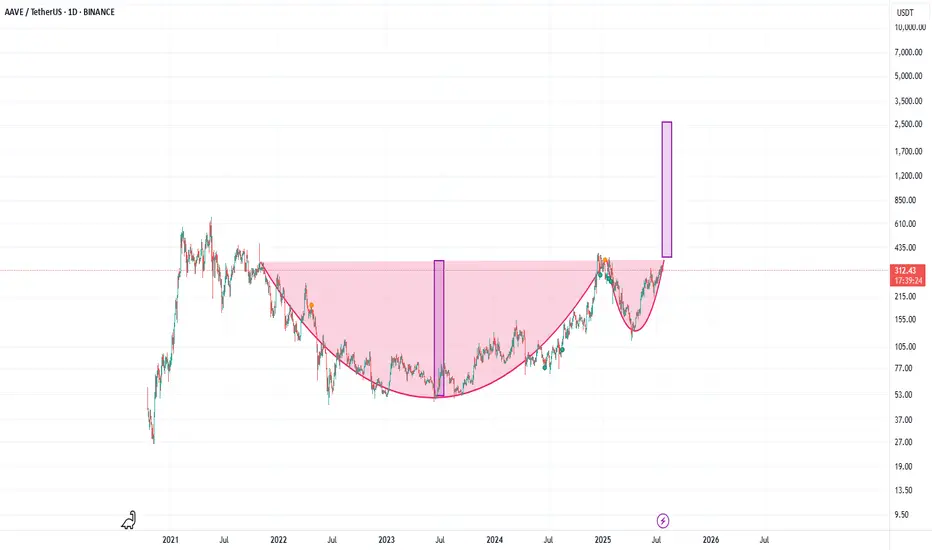
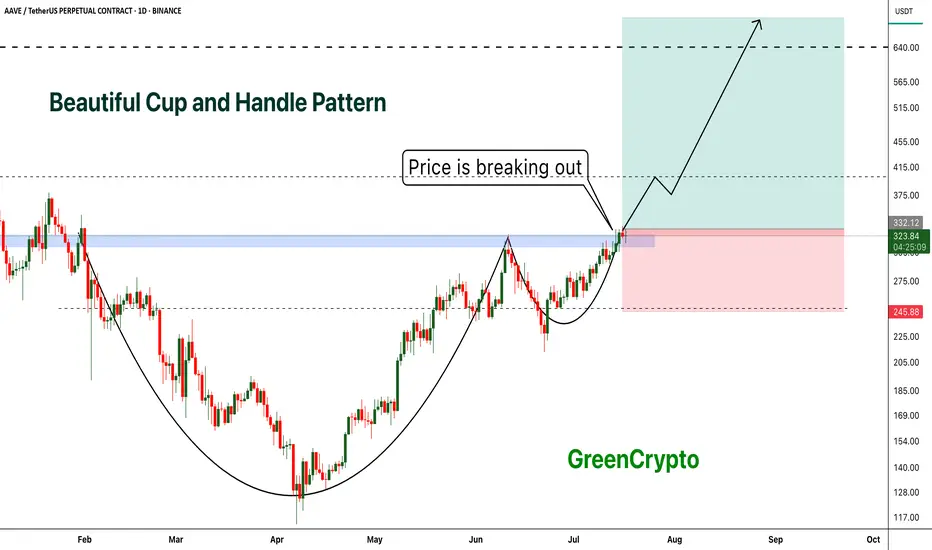
AAVE/USDT — Classic Cup and Handle Pattern AnalysisThis chart highlights a significant and classic bullish pattern: the Cup and Handle.
AAVE SELL SETUP ,Sold From $333AAVE SELL SETUP
Currently $333
Sold From $333
(Trading plan If AAVE
go up to $341 will add more shorts)
Expecting target $323 OR DOWN
In the event of an early exit,
this analysis will be updated.
Its not a Financial advice
AAVE IDEA JUL/18/25Let’s try another one over the weekend.
We’re aiming for that LQ on the HTF, but we’ll catch some partials along the way

AAve scalp long to $338.27Just now opened a scalp long position on aave. I anticipate that the bulls will attempt to make new highs again soon, we're at at good level and structurally market is likely at a LL point on the hr tf, definitely not a good place to short if I was a bear
Sl: $316.72 good invalidation stop
Roughly 2RR trade.

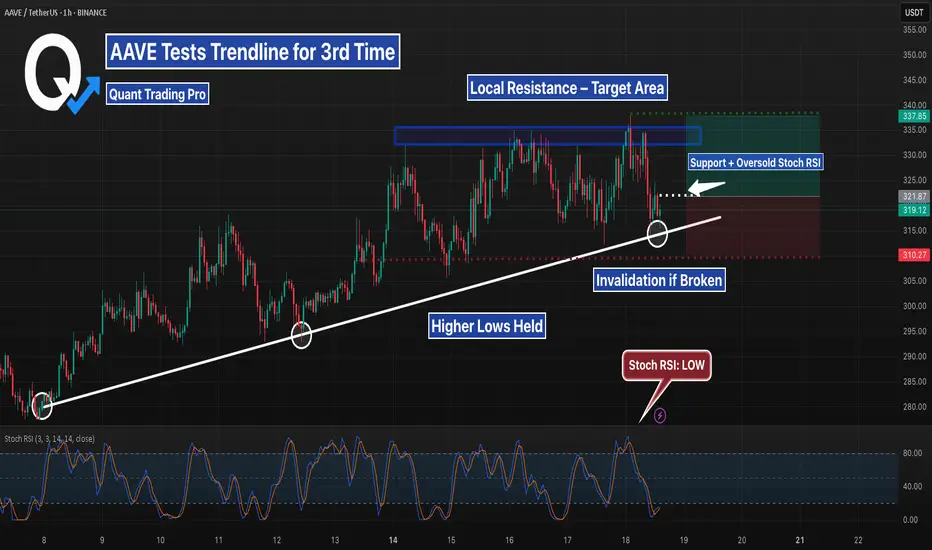
AAVE Bounce or Breakdown — Trendline Test #3AAVE is testing a clean 3-touch trendline that’s held for days. Current confluence with the range low and Stoch RSI reset makes this a textbook long setup — but if the trendline fails, expect quick downside. Risk defined. Eyes on the next candle.
AAVE - Beautiful Cup and Handle Pattern Breakout- AAVE is breaking out from cup and handle pattern finally
- Cup and handle pattern breakout usually results in perfect trend continuation
- A huge long trade opportunity from this
Entry Price: 335 Above
Stop Loss: 245
TP1: 381.89
TP2: 429.16
TP3: 525.94
TP4: 628.78
TP5: 712.89
Max Leverage 5x:
Don't forget to keep stoploss
Cheers
GreenCrypto
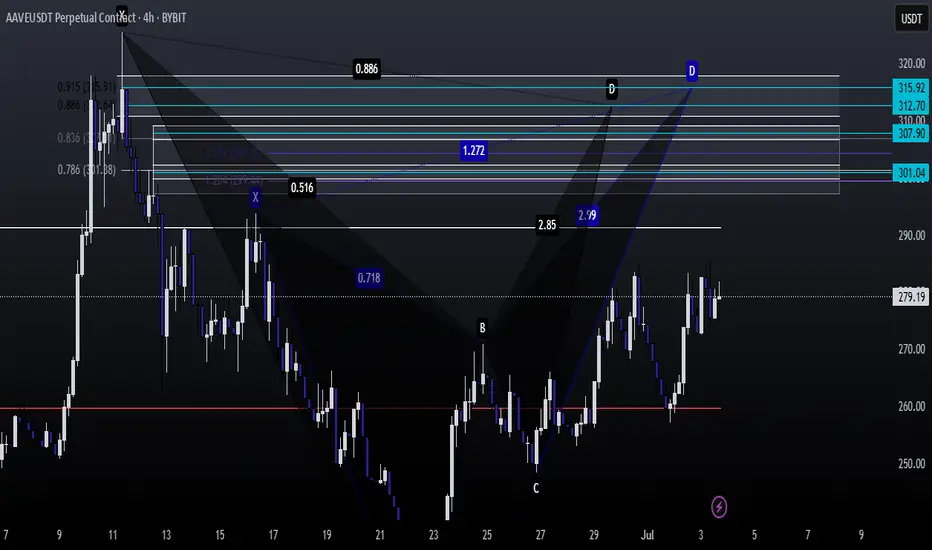
$aave/usdt short zonesth:
intraday short zone: htf + ltf liq + htf 78.6 fib + sh
swing short zone: htf + ltf liq + ote zone + bat & butterfly bearish harmonic
AAVE IDEA JUL11-25So here is a quick one
Let’s see how this OB works in seach of short-term liquidity 💪
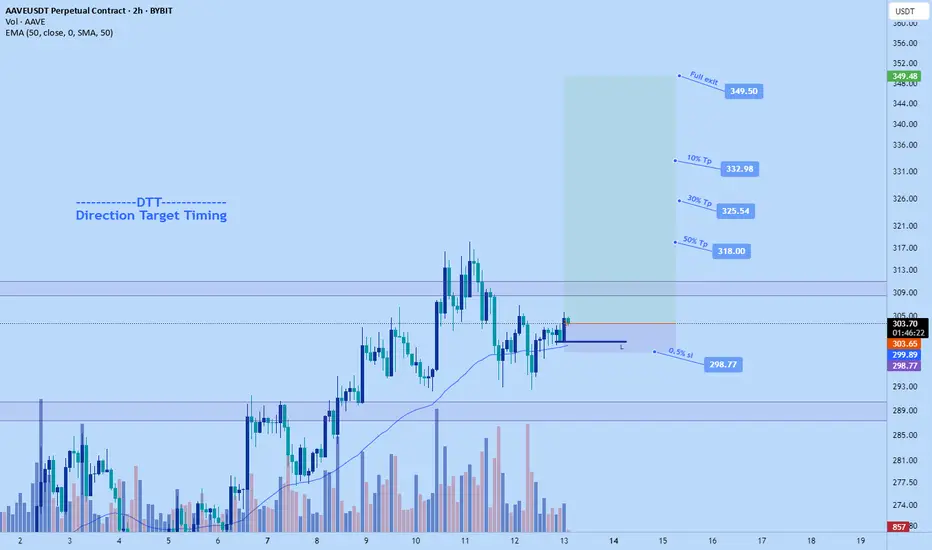
AAve Big long to $350Opened a long on aave a while ago. Setup aligns with my DTT process. Direction, target and timing.
Stop: $298.77 relatively as I anticipated little downside from here, the bulls just claimed the level a whie ago.
Let's see if they can keep it.
Tps on chart. The plan is to scale out along the way given all goes well.
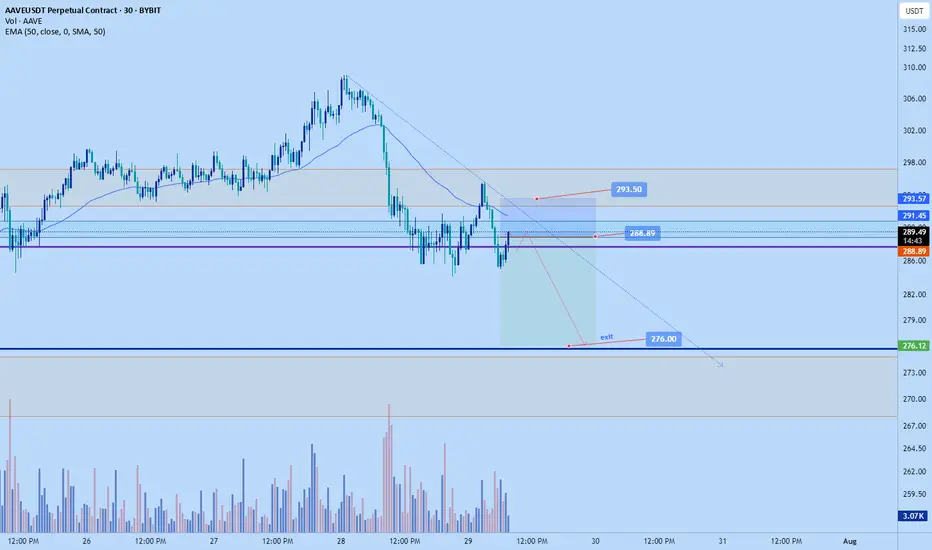
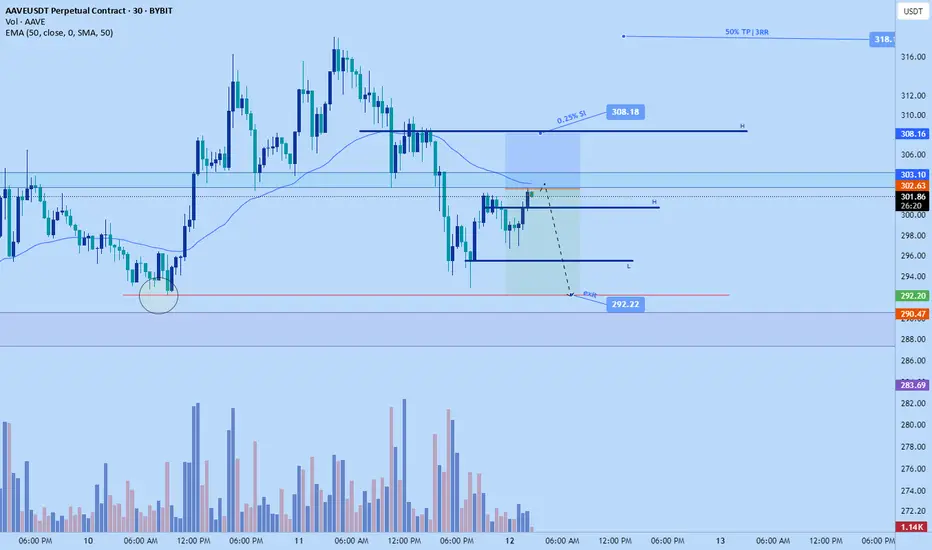
aave scalp shortJust now took a short on aave.
Roughly 2rr.
Stop: $308.18
Tp: $292.22
Time sensitive
AAVE 8 Hour time frame reviewAAVE complete the inverse head and shoulder pattern, currently getting rejected from the neck line. Signs of Sell side liquidity underneath the right shoulder expecting a sweep of this then reverse to attack the neck line
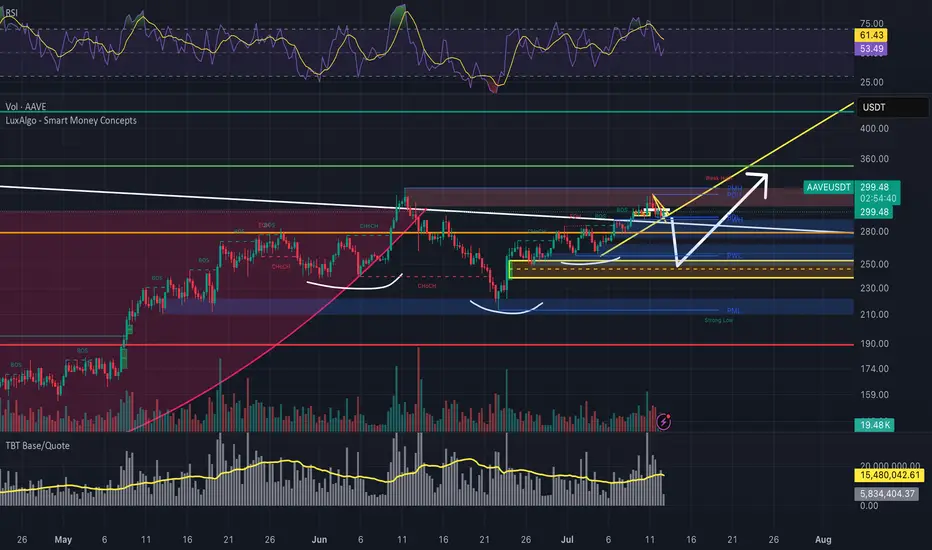
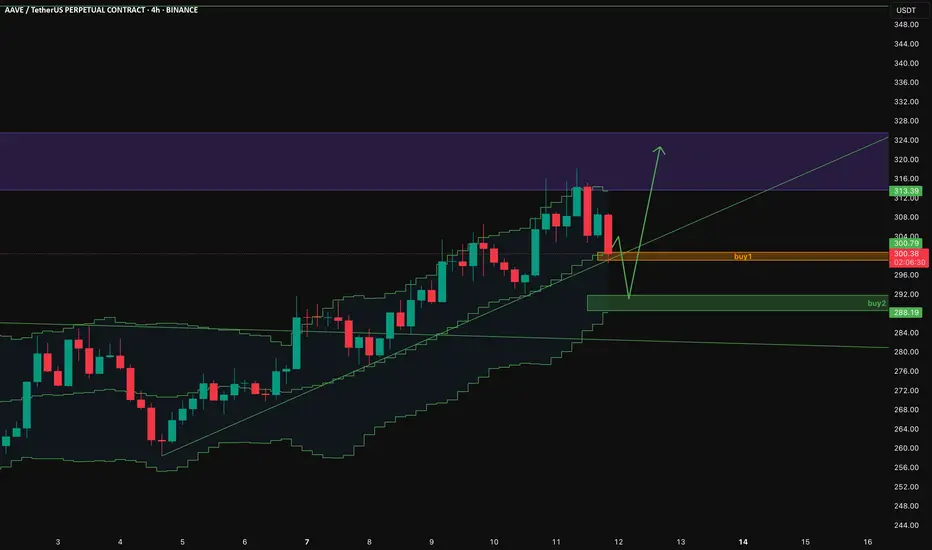
AAVE buy pointsBINANCE:AAVEUSDT OKX:BTCUSDT.P
Would like to see it gets supported in a 4 h level but the 1 h Bollinger band may support it, I have opened an initial position (buy 1) and would like to add a hedge until it reaches my buy 2.
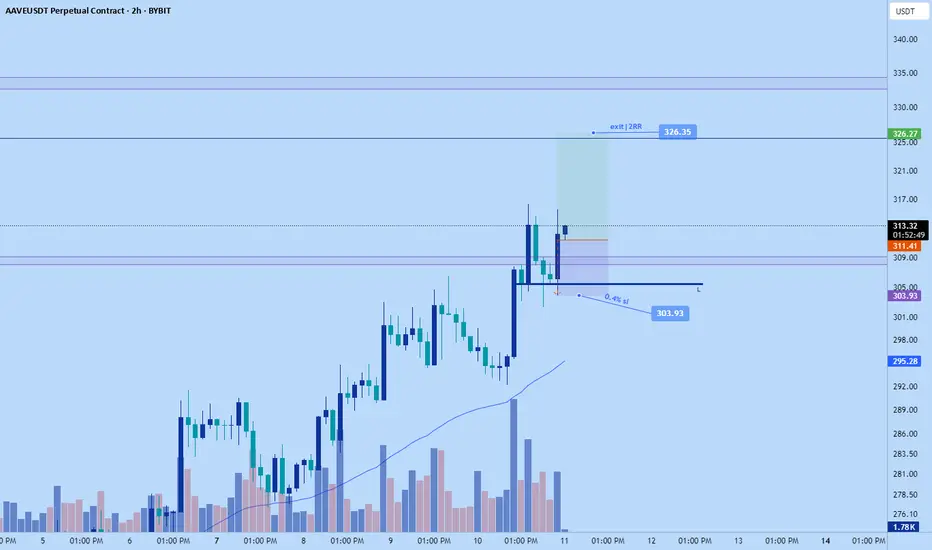
AAve long to $326.35 tonight!Just hopped into aave long. Market looks likely to continue the trend push impulsively a bit more.
Stop: $303.93
Tp: $326.35 area
Roughly 2 RR
Time sensitive scalp