gay graphthe lines are catching the prices!
aave is gaining alot of trust lately and is set to "outperform" as that one guy said
AAVEUSDT trade ideas
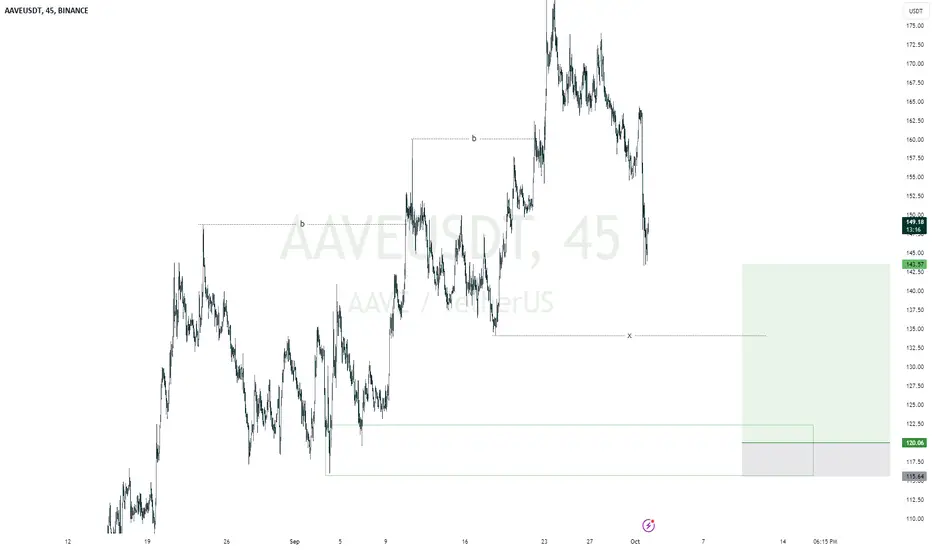
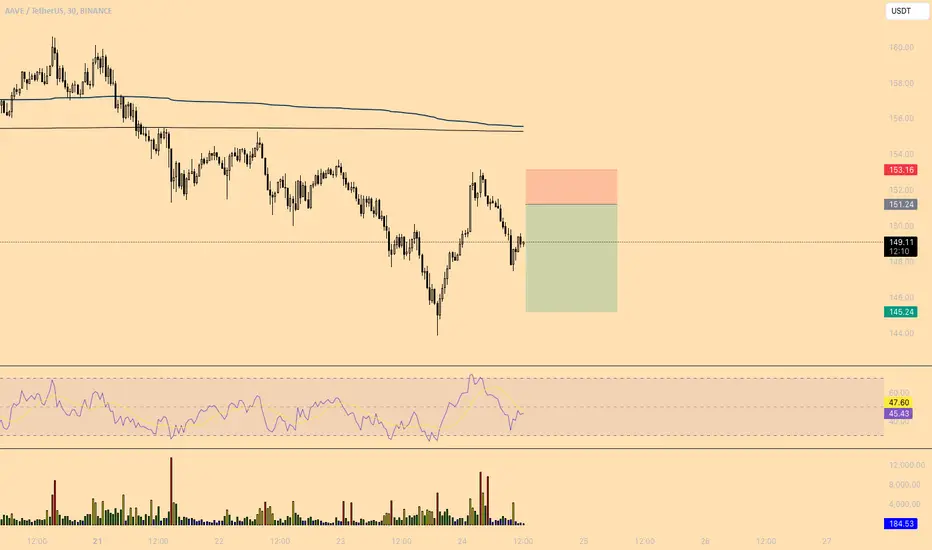
AAVEUSDTmy entry on this trade idea is taken from a point of interest BELOW an inducement.. I extended my stoploss area to cover for the whole swing as price can target the liquidity there before going as i anticipate.. just a trade idea, not financial advise
AAVEIn the time of 1 minute, if the last trend line of the chart is broken, the short position with a reward of at least 1
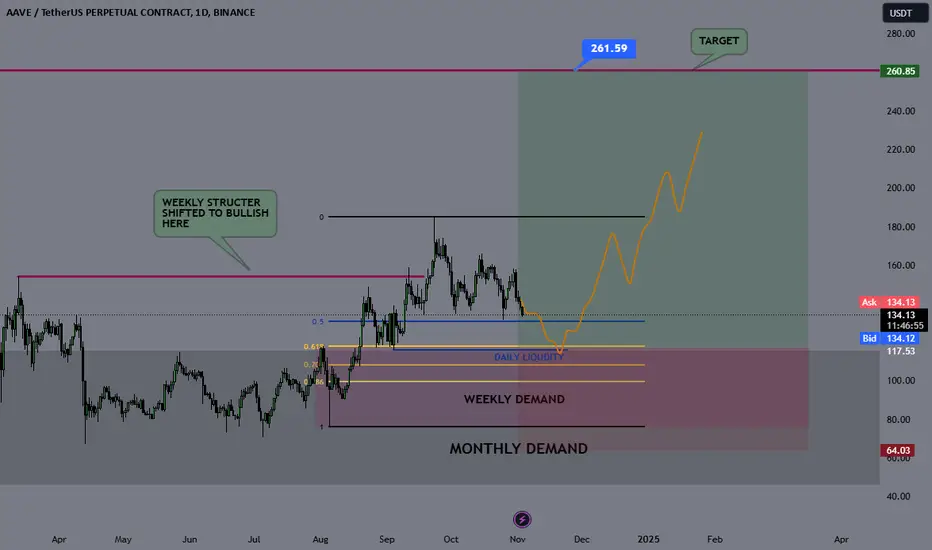
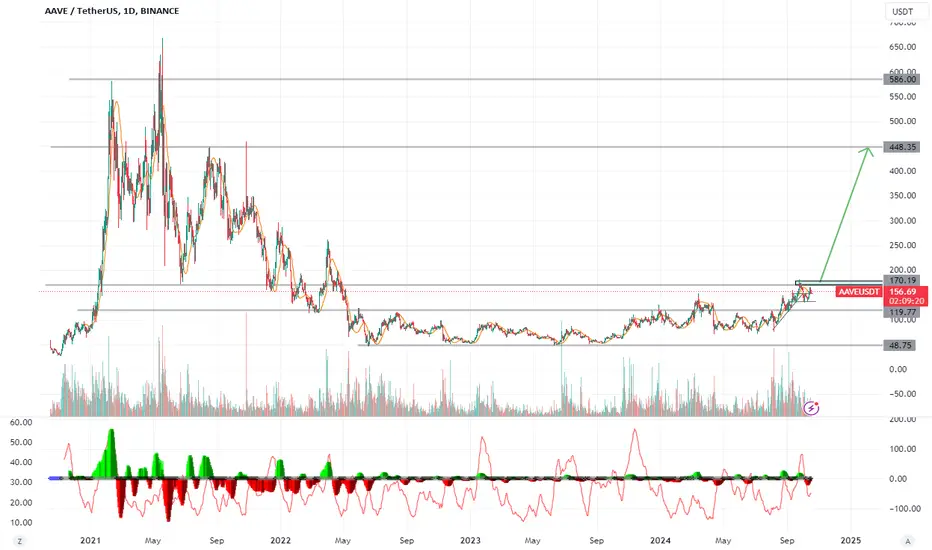
AAVE LONG IDEA - AAVE Coin Swing Long OpportunityAAVE is a coin I monitored closely during Summer 2024. While most altcoins were making new lows, AAVE was accumulating and showed resilience, which suggested to me that it might outperform others in the 2024-2025 altcoin bull season.
Technical Analysis: Price accumulated within the monthly demand zone throughout Summer 2024. It finally took off, breaking the weekly structure and creating strong bullish momentum on the weekly and daily charts.
Currently, price is retracing to the weekly demand zone responsible for the structural break, which is also supported by the monthly demand. This level appears strong to me.
I anticipate a slight retracement to grab daily swing liquidity before taking off from that area, which aligns with the Fibonacci golden entry level, adding further confidence.
I’ll be watching for LTF confirmations to enter the trade.
#AAVE/USDT#AAVE
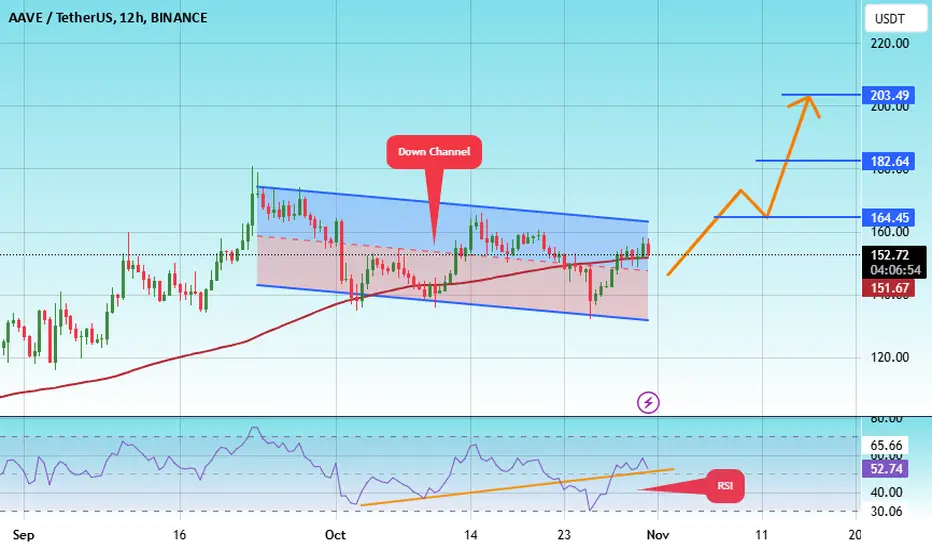
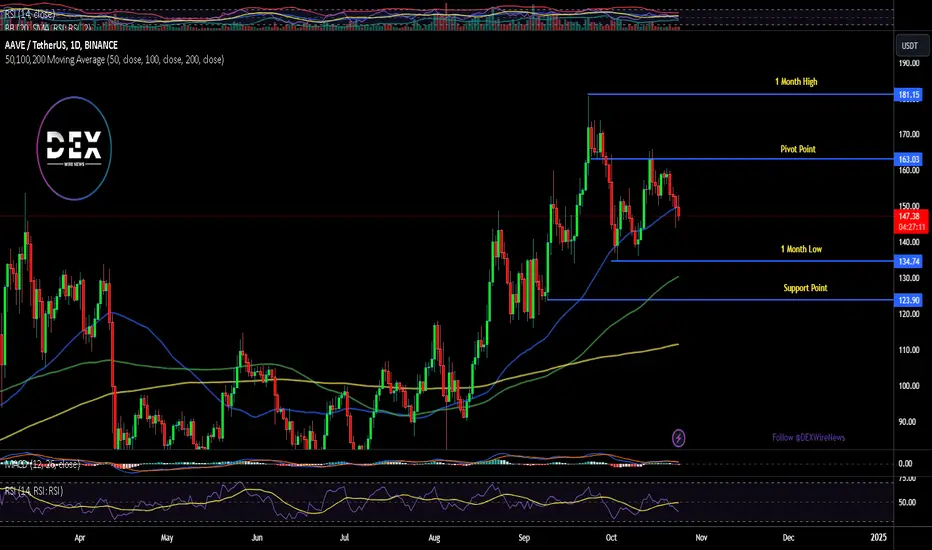
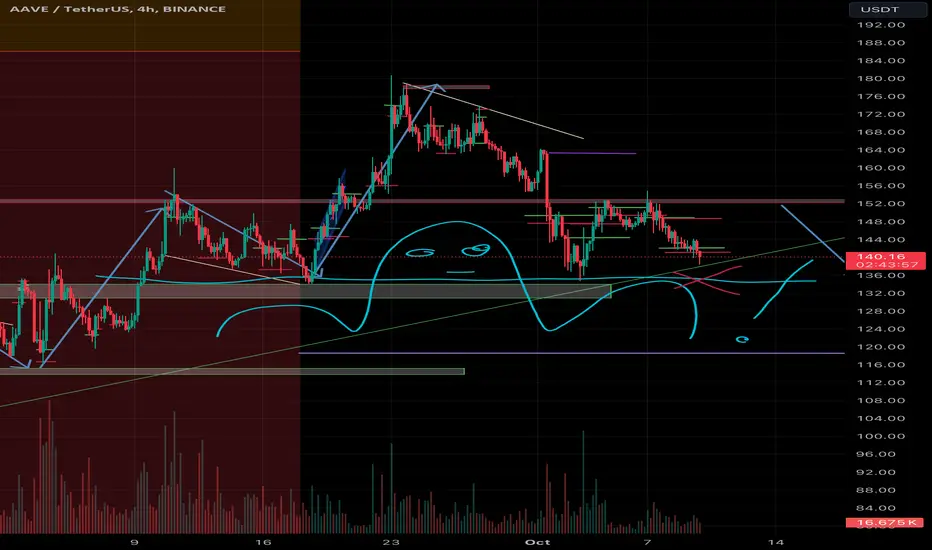
The price is moving in a descending channel on the 12-hour frame and is sticking to it well
We have a bounce from the lower limit of the descending channel and we are now touching this support at a price of 134
We have an upward trend on the RSI indicator that is about to be broken, which supports the rise
We have a trend to stabilize above the moving average 100
Entry price 152
First target 164
Second target 182
Third target 203
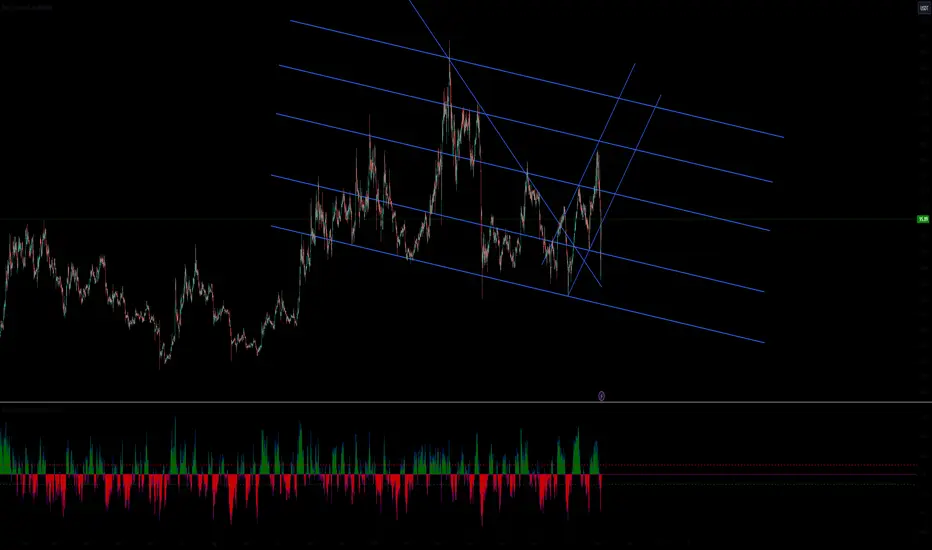
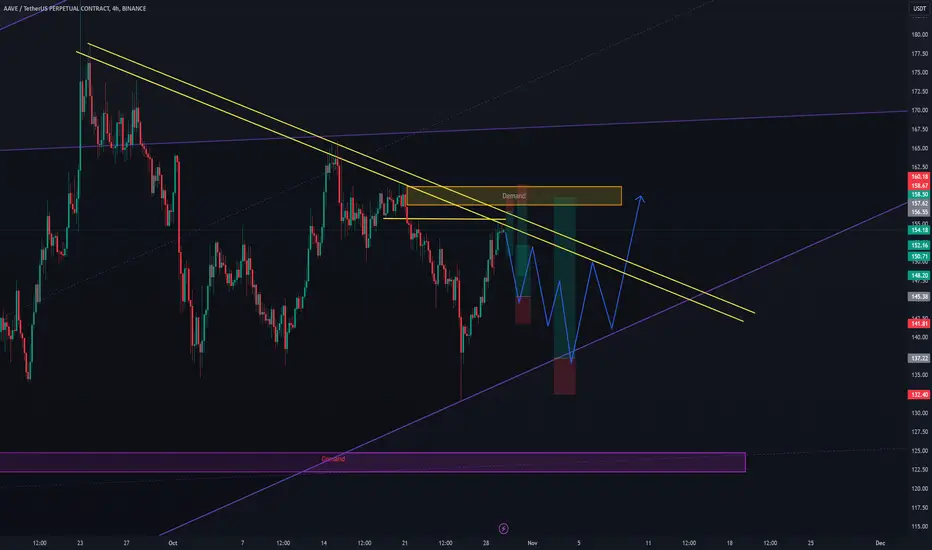
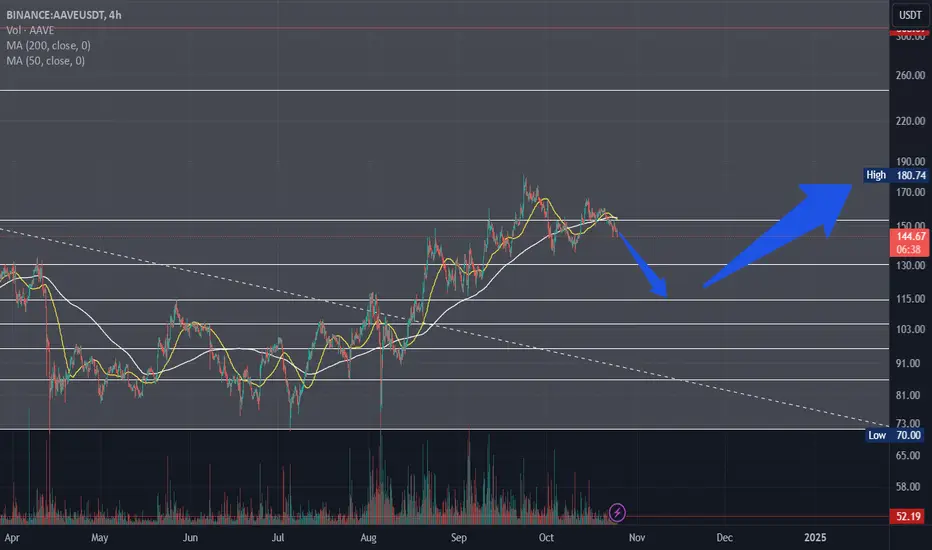
Short AAVE, long AAVEShort: you can see the short idea with entries above the yellow trendlines + resistance, where the SL's for short are. We can get a nice reaction from there with a great RR.
Long: We 2 possible trades if the market goes sideways for a while
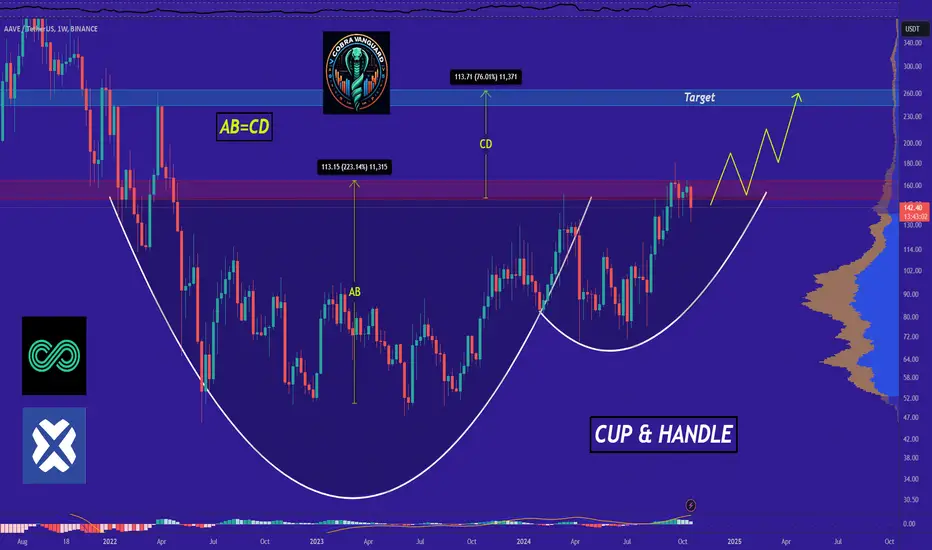
AAVE is going to reach 200$Now, as you can see, AAVE is in a cup and handle pattern on the weekly timeframe. This can be an incredibly strong signal for a price increase. If the breakout happens, AAVE's price could reach $243 in the new year, which is not far-fetched, just like the AB=CD pattern.
✨We spend hours finding potential opportunities and writing useful ideas, we would be happy if you support us.
Best regards CobraVanguard .💚
_ _ _ _ __ _ _ _ _ _ _ _ _ _ _ _ _ _ _ _ _ _ _ _ _ _ _ _ _ _ _ _
✅Thank you, and for more ideas, hit ❤️Like❤️ and 🌟Follow🌟!
⚠️Things can change...
The markets are always changing and even with all these signals, the market changes tend to be strong and fast!!
AAVE seems bearishEURONEXT:AAVE made a fake hitting 180$ and fall back again to its sideways trend, #AAVE got rejected from the resistance of the trend from 170$ and made a wick at 130$, I'll open short trade from 146$-148$ with the stoploss at 152$.
i'll share the targets after the trade open. it could fall to 120$.

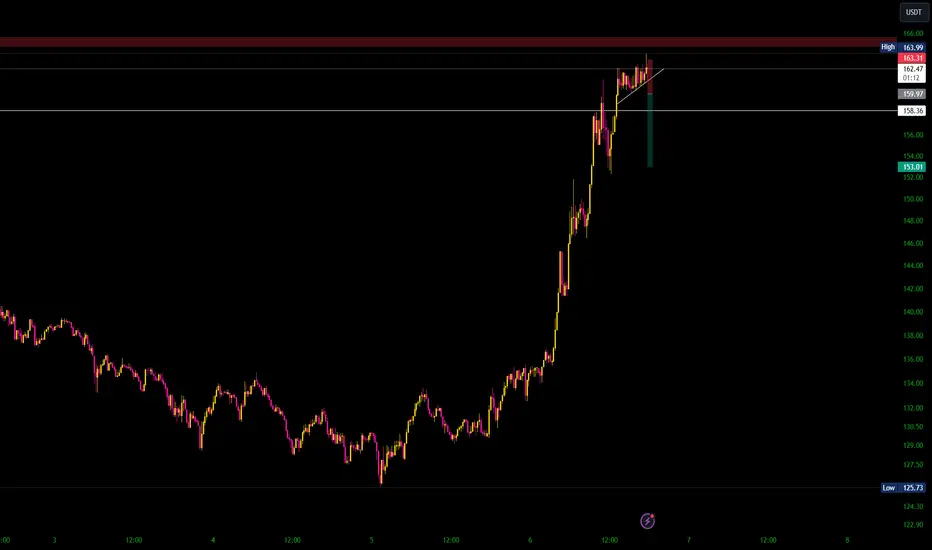
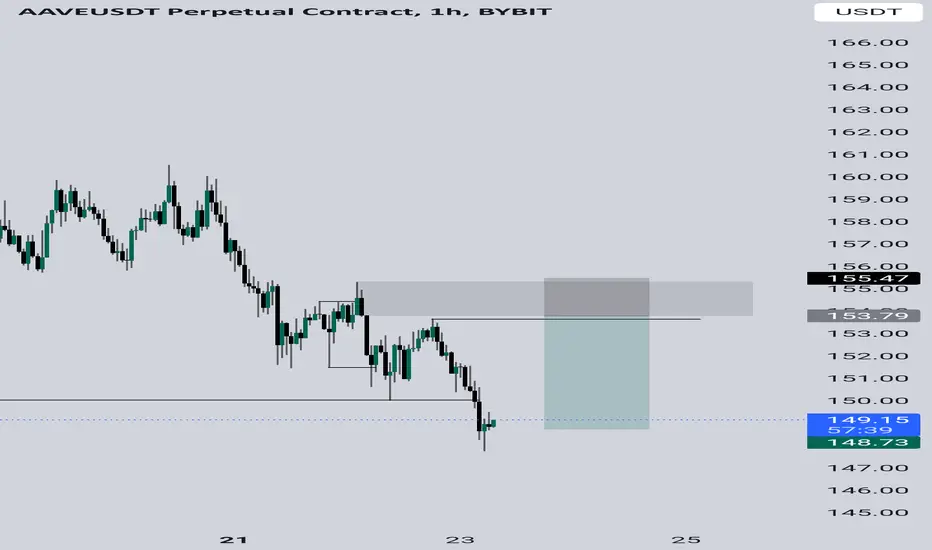
AAVE goes rest in wavy market !This is a short sell trade setup based on technical analysis and price action, particularly in wavy market condition.
Enter: 164
TP1: 150.5
SL: 170
** Please follow your strategy and updates; this is just my Idea, and I will gladly see your ideas in this post.

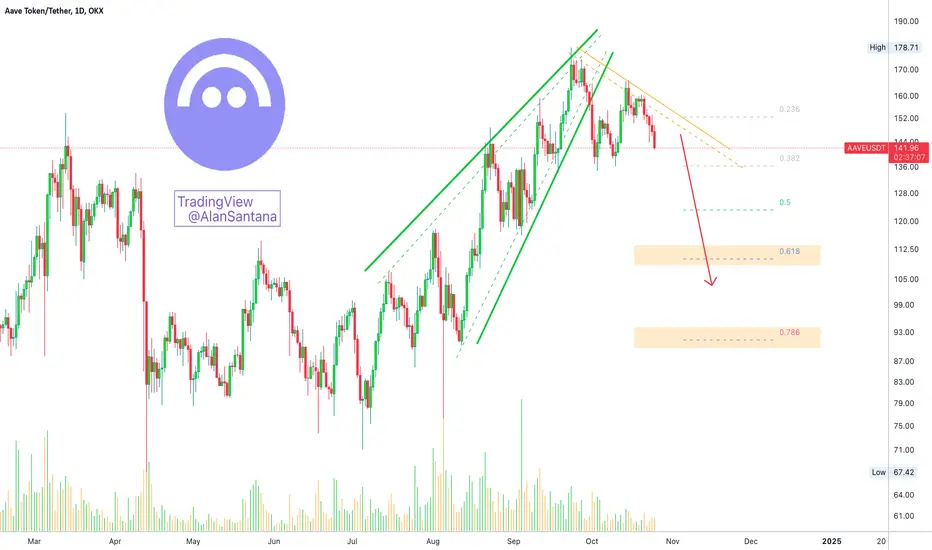
Aave Token: Rising Wedge & Head & ShouldersTwo bearish patterns are present on this chart signaling the end of the bullish wave. The first one is the rising wedge seen on the main chart above. The pattern already broke bearish and the drop is already happening and confirmed.
The second one is the head and shoulders pattern, it comes at the top of a trend to signal that a reversal is coming. Notice how today's candle already trades below the patterns neckline:
AAVEUSDT looks good for a short because it can produce profits fast with low risk, as the move is already advanced but not too far advanced. It is a good chart setup.
The dynamics here are the same as with the other pairs recently published.
This drop will lead to the activation of support which is our long-term accumulation zone. In this accumulation zone we will have consolidation for several months and then the start of the 2025 bull-market. The bull-market can lead to new All-Time Highs. It will take time though. Patience is key.
Thank you for reading and for your continued support.
Namaste.
AAVE next moveBase of previous behavior of AAVE, and breaking down the MA 50 and 200, I expect at first goes down till around 139$, and if breaking that down again, goes down to around 113$, then we can expect its big move to 180$ or even 240$!
of course this is only a personal Idea and not be a signal.

US Government Makes First AAVE Transaction in 8 Months—$5.4 MlnIn a significant turn of events, the U.S. government has executed its first AAVE transaction in eight months, pulling out $5.4 million in funds seized from the Bitfinex hacker. This move, as recorded by Arkham Intelligence, has spurred concerns across the crypto community, fueling speculation about a potential selloff and its implications for the DeFi space.
The U.S. Government and AAVE—An Unclear Move
The $5.45 million withdrawn was paid out in USDC, the stablecoin pegged to the U.S. dollar. The origin of the funds traces back to the notorious Bitfinex hack, one of the largest crypto heists in history. However, the exact strategy behind the transaction remains unclear, and this lack of transparency has added to market uncertainty.
A possible explanation is that the U.S. government had locked the funds on AAVE ( EURONEXT:AAVE ) , one of the leading decentralized finance (DeFi) lending platforms, earning interest as a liquidity provider. While this is speculation, it raises questions about how the U.S. is managing its seized digital assets.
Notably, the U.S. government holds other major cryptocurrencies, including Bitcoin and Ethereum, with significant amounts linked to past seizures like the Silk Road founder’s BTC stash. Given the government’s history of selloffs, traders are now left wondering whether more liquidation could be on the horizon.
Impact on AAVE and Broader Sentiment
AAVE ( EURONEXT:AAVE ) has been facing the ripple effects of this transaction, with the token’s price declining as traders brace for a potential selloff. The transaction sparked a bearish engulfing pattern on AAVE’s charts, signaling continued downward pressure. The selloff fears are amplified by the government’s influence in the market, as its holdings carry substantial weight, particularly in Bitcoin and other altcoins.
Meanwhile, this move comes amidst broader trends of nations warming up to crypto strategies. Bhutan, for example, ranks as the 4th largest Bitcoin holder by country, while Germany recently sold off thousands of Bitcoins earlier this year, shaking the market.
Technical Outlook for AAVE
At the time of writing, AAVE is trading at a decline of 2.05%, sitting below its 50-day moving average but above the 100- and 200-day MAs. This positioning shows short-term bearish sentiment as the token struggles to find stability.
The bearish engulfing pattern triggered by the government’s transaction suggests further selling pressure could follow in the coming days. However, with AAVE ( EURONEXT:AAVE ) still trading above its longer-term support levels, there’s potential for a bounce back—especially if broader market conditions improve or if DeFi use cases continue to expand.
Immediate resistance for AAVE lies at the $70.50 level, with support seen at $60.60. Investors should watch closely for volume changes as the market absorbs the government’s actions.
Significance of AAVE in DeFi
AAVE ( EURONEXT:AAVE ) has remained a vital player in the DeFi ecosystem, allowing users to lend and borrow crypto assets without intermediaries. The platform’s success hinges on its liquidity, and a government selloff could impact both market sentiment and liquidity availability.
However, AAVE continues to innovate, offering features like flash loans and unique borrowing options. Even in the face of external shocks, the long-term fundamentals of AAVE, with its established position in DeFi and strong user base, remain solid.
Conclusion
The U.S. government’s recent AAVE transaction has raised eyebrows and triggered speculation of a larger selloff in the crypto market. While this move has spurred short-term bearish trends, the broader significance of AAVE in DeFi and its solid technical indicators suggest a potential recovery once the market digests the impact.
As always, investors should keep an eye on macroeconomic trends and government activity in the crypto space, as large-scale transactions like this have the potential to ripple through the market.
AAVE.USDT - 1DA good daily candle closes, we can enter one step in this range or wait and enter back after exiting the range

Aave Headed Towards Correction: Decreasing Volume & Bearish Div.AAVEUSDT produced a really interesting pattern when looking at the weekly timeframe, the 23-September week. We have a very strong bearish reversal signal.
Right now though we are giving it a closer look and considering the daily timeframe. Lately, we saw a strong rise in bearish volume followed by a strong decrease in overall trading volume, which is a bearish signal.
Then we have a very strong, long-term bearish divergence between AAVEUSDT and the RSI. Let me show you:
The top was hit in March 2024. We have a lower high in August and then again in September. AAVEUSDT peaked in September so this divergence is really strong.
As is usual, the divergence tends to show up on several indicators at once. The more indicators that show same divergence, the stronger the signal. Here is the daily MACD:
The peak happened in March. The last two highs, August and September, end as lower highs compared to March.
Thus we have the MACD and RSI producing lower highs while AAVEUSDT is producing higher highs. The bearish divergence signals the potential for the reversal of the current trend.
Summary:
➖ Weekly reversal candlestick pattern (shooting star).
➖ High bearish volume followed by decreasing overall volume.
➖ MACD and RSI bearish divergence.
These are bearish signals pointing to lower prices next.
The next drop should activate the long-term accumulation zone. The last chance/opportunity to buy low before the major 2025 bull-market.
Thank you for reading.
Your support is appreciated.
Namaste.

possible parabolice curve AAVEit looks like a parabolic curve on AAVE.USDT if it is, it could explode. and the first target would be (imo) the 0.5 ( 350) taken from high to low on the weekly timeframe.

$AAVE is awaiting confirmation for a bullish rebound.AAVE is in an uptrend on the weekly chart and undergoing a small correction on the 12H timeframe. If it breaks this trend, it's heading north to hit the 0.236 Fibonacci level or $191!!

AAVE H+S!Words are not needed. But if they were I’d say if price drops below shoulder-line and as soon as it tests bottom buy some Aave. It has some great and practical ideas for the future of finance so should do well this bull run.
AAVE token - 68TradingThis is a AAVE trading plan of 68Trading. It's going to be valued by GrayScale.

AAVE 4H - Correction 0.618 FIBONACCI 120$ - 124$AAVE 4H - Correction 0.618 FIBONACCI
AAVE is currently correcting the last bullish impulse confirmed by a bearish EMA 50-100 crossover. The value could look for levels of 120 - 124 (0.618 fibo) where it would be a good BUY ZONE.
On the contrary, if BTC encourages the entire market, it could turn around earlier and break the resistance to continue rising.
TARGET: $220
These strategic alternatives can be configured with TradeX BoT, since it allows positioning in both directions without having to block any amount per position. It will only be necessary for the conditions to be met, so that the orders are executed in one direction or another, taking the necessary tokens from your wallet.
TradeX BoT (in development): Tool to automate trading strategies designed in TradingView. It works with both indicators and graphic design tools: parallel channels, trend lines, supports, resistances... It allows you to easily establish SL (%), TP (%), SL Trailing... multiple strategies in different values, simultaneous BUY-SELL orders, conditional orders.
This tool is in the development process and the BETA will soon be ready for testing.
FOLLOW ME and I will keep you informed of the progress we make.
I share with you my technical analysis assessments on certain values that I follow as part of the strategies I design for my portfolio, but I do not recommend anyone to operate based on these indicators. Inform yourself, train yourself and build your own strategies when investing. I only hope that my comments help you on your own path :)
