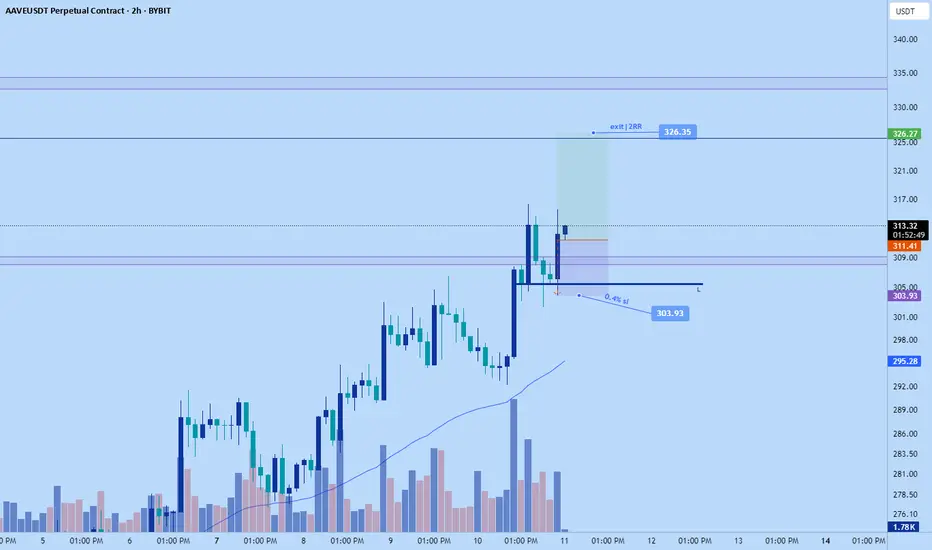
AAve long to $326.35 tonight!Just hopped into aave long. Market looks likely to continue the trend push impulsively a bit more.
Stop: $303.93
Tp: $326.35 area
Roughly 2 RR
Time sensitive scalp
AAVEUSDT trade ideas
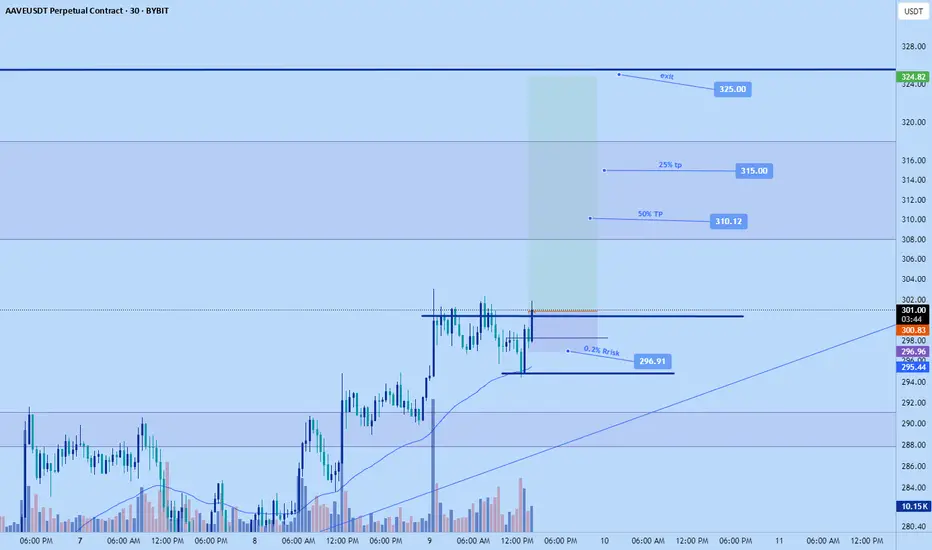
Aave long to $325Just went long aave
Stop: $296.91
Tp: $325
Tp1: $310.
Tp2: $315
I might just hold until tp 2 before take profit. depends on whether its pushing strong in 1 candle or not
Time sensitive
AAVE Trend line BOAAVE has been respecting the trend line for few weeks and today it is rejected from the trend line after upmove. It will move either Up/Down from the lines.
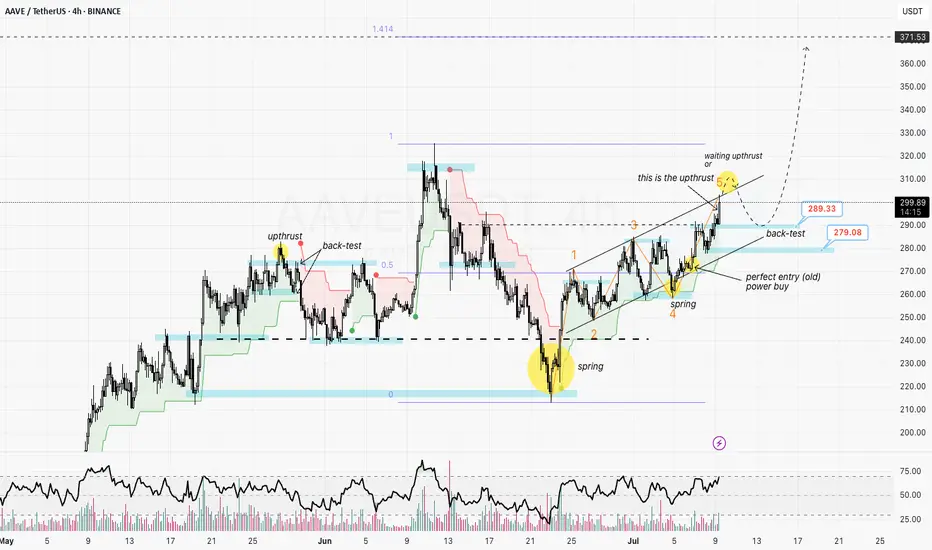
AAVE prepares for the back-test
After a sharp decline, AAVE formed a textbook spring, signaling that strong buying demand has returned to the market.
The recent bullish leg appears to have completed a 5-wave impulse structure (H4 timeframe), suggesting a high probability that a corrective phase may follow.
Currently, EURONEXT:AAVE is testing the resistance boundary of its ascending channel. I’m looking for signs of an upthrust here, with two primary scenarios in mind:
Scenario 1: If the recent surge to $300 is confirmed as an upthrust, we could see a mild correction back to the $279 area for a support back-test—possibly forming a secondary spring within the rising channel (lower probability).
Scenario 2: If price wicks above $300 but then reverses, I anticipate a back-test at $289, which could set the stage for a new rally to break ATHs (targeting $325) and potentially reach the $370 area.
RSI is approaching overbought territory, but there’s no clear sign of a reversal yet. It’s crucial to watch for divergence signals at this stage.
Key Points:
AAVE is in a strong bullish phase, but a short-term pullback to retest the $279–$289 support zone could offer the optimal entry for the next leg up.
Risk management first: Keep stops tight below $275 to protect capital.
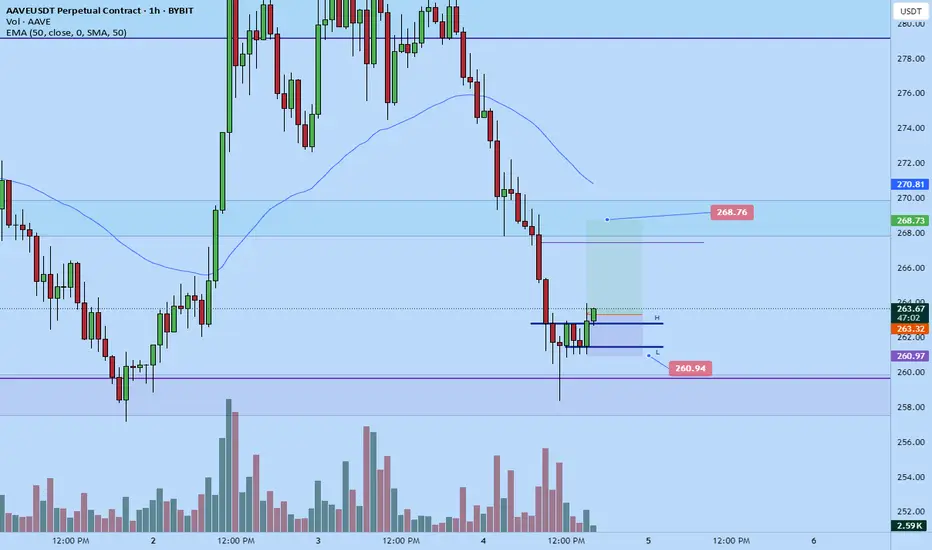
Aave long Opened a long on Aave not too long ago.
Scalp long
2.3RR roughly
Stop: $260.94
Market fell quite low. Anticipating a correction back up
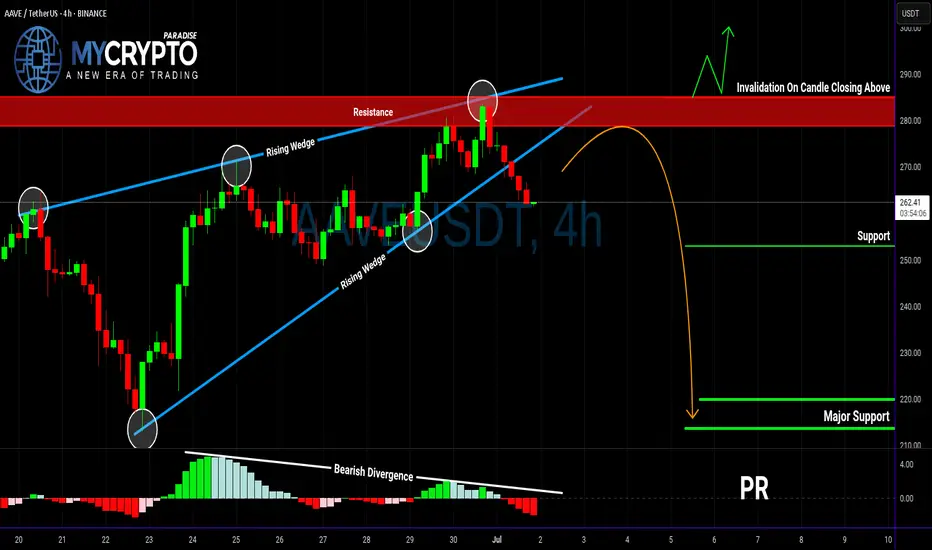
AAVE Breakdown Could Trigger Major DropYello Paradisers — did you spot the bearish setup forming on AAVEUSDT? If not, you might already be a step behind, but there’s still a high-risk-reward opportunity on the table — if you approach it with discipline.
💎Currently, AAVEUSDT is looking increasingly bearish. The asset has confirmed a bearish Change of Character (CHoCH), broken down from a rising wedge pattern, and is showing clear bearish divergence on the chart. These combined signals suggest that the probability of further downside is increasing.
💎From here, there are two main scenarios we’re monitoring. First, AAVE could attempt a pullback to fill the Fair Value Gap (FVG) above, which would offer a clean short-entry zone with strong risk-reward potential. Alternatively, price could reject directly from the nearby Bearish Order Block (OB), offering another chance for well-structured entries. Both setups depend on confirmation and timing, so patience is key.
💎However, if AAVE breaks and closes decisively above the current resistance zone, the bearish thesis becomes invalid. In that case, the best move is to wait on the sidelines and allow new, higher-quality price action to form before re-engaging.
💎This market demands patience and discipline. You don’t need to catch every move — just the right ones. Stay sharp, stay focused, and let the market come to you.
Strive for consistency, not quick profits. Treat the market as a businessman, not as a gambler.
MyCryptoParadise
iFeel the success🌴
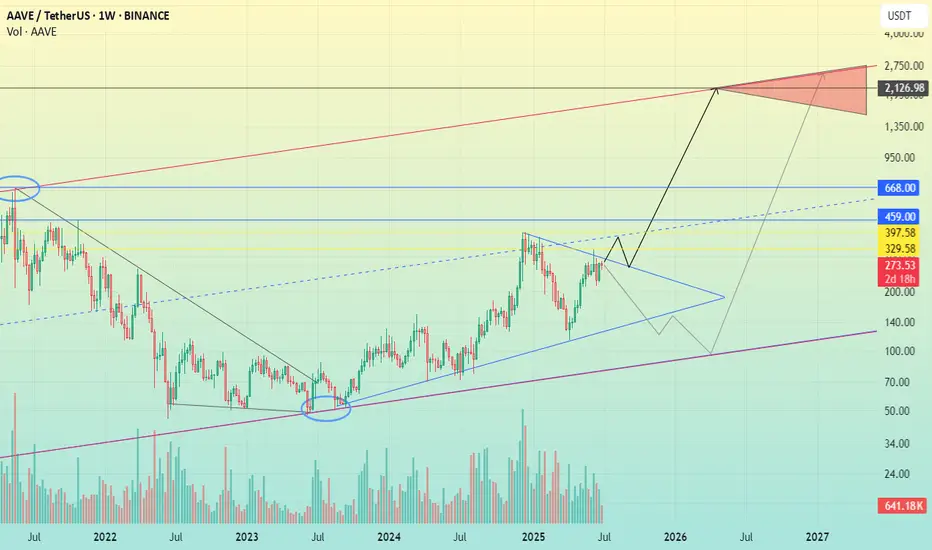
AAVE 2100$Aave
AAVE is the largest decentralized non-custodial liquidity market protocol on Ethereum Virtual Machine.
The currency has been moving in an upward trend since its launch.
This is in conjunction with ongoing development of the currency and a strong team.
The currency is considered non-inflationary.
Circulating Supply
AAVE 15.17M
(94.8% of Max Supply)
Monitor prices closely to benefit.
I wish everyone abundant profits.
Like and follow
for more.
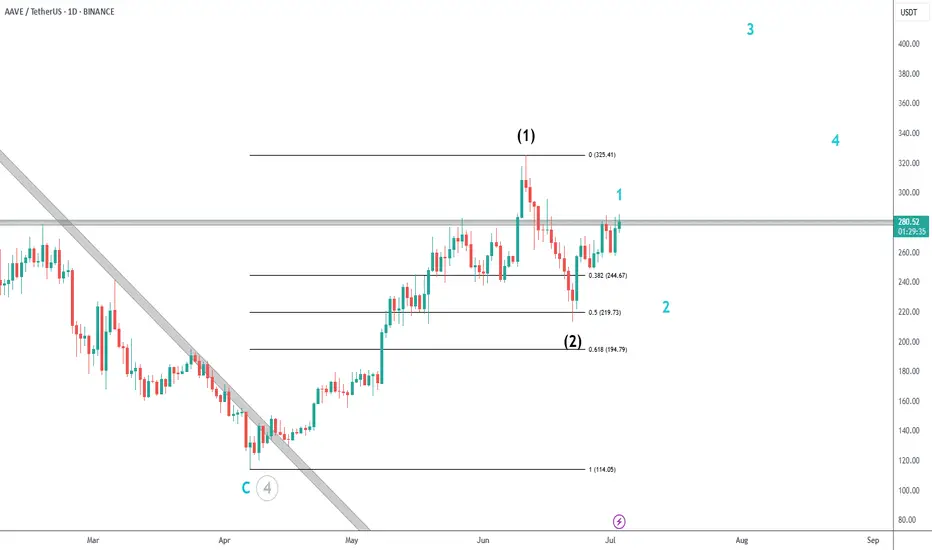
AAVE Potential 1-2/1-2I´m keeping an eye on a quick pullback on AAVE for a potential 1-2/1-2.
The thesis is that black 2 finished in the 50% pullback and we´re currently finishing blue 1.
Blue 2´s pullback would be a great opportunity for long trades with a very tight stop loss.
The gray zone, with gave us a fake breakout for black 1, may be the temporary resistance for blue 1.
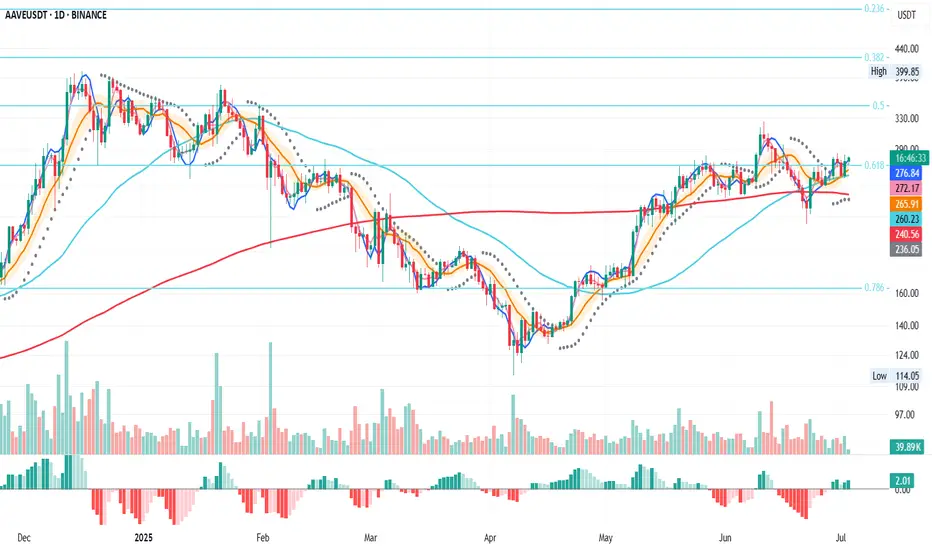
AAVE Daily – 0.618 Fib Reclaimed
AAVE on the daily has reclaimed the 0.618 Fib level after dropping below it and retesting the 200MA.
MLR > SMA > BB center — structure looks constructive.
If price holds this Fib level, there’s a good chance of targeting the 0.5 Fib around $350.
Always take profits and manage risk.
Interaction is welcome.
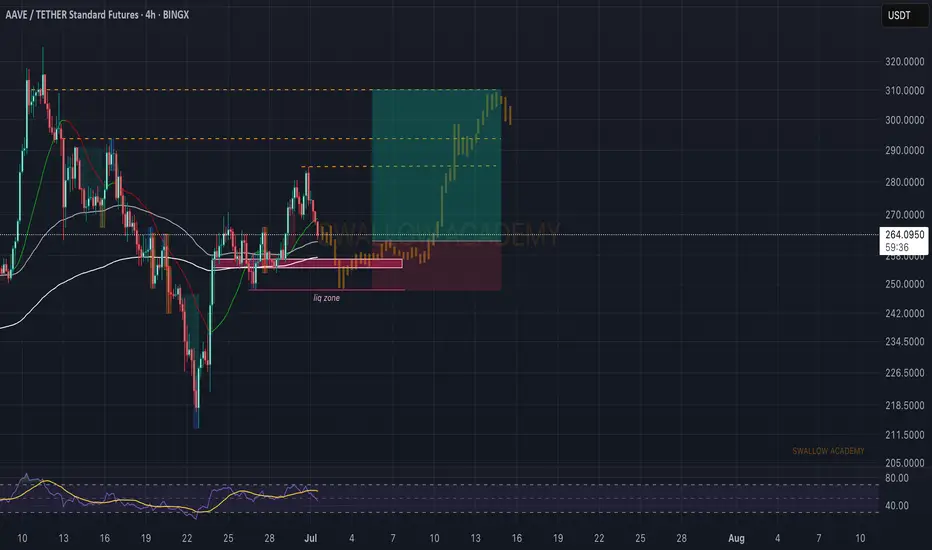
Aave (AAVE): We Might Get Good Bounce From Here | BullishSeeing a good chance for AAVE to have proper MSB and bounce very soon. We are looking for a local support area near $257, which would also mean that the price will fill the CME gap. From there, we will start looking for proper upward movement towards our target in the upper area.
We are also keeping an eye on the liquidity zone, as if we see the pricefall further, then our SL will be extended, but if we get proper MSB near support, then the SL remains the same!
Swallow Academy
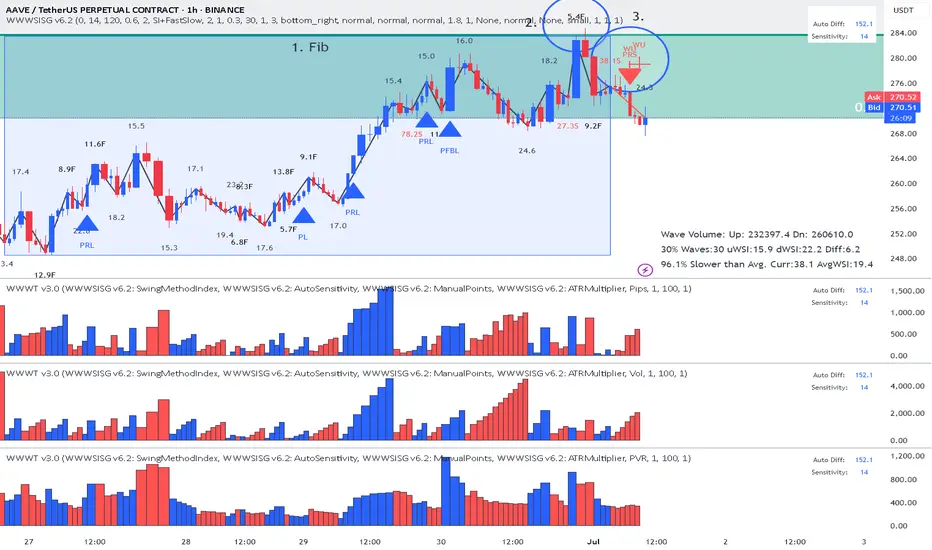
AAVE - Short Plutus signal: Wyckoff- Up - ThrustReading the chart:
1. Fib 61.8 perfect location for sellers to enter
2. Fast up wave with 5.4 SI -Fake Break
3. Pull back with price having a hard time to move up with 38.1 SI (abnormal Speed Index) and then double signal short Wyckoff Up-thrust and PRS.
Enjoy!
aave long to $325Longing aave to $325
Stop: $265
Tp1: 308
Tp2: 325
Time sensitive
Anticipating a strong push later on today. If not then I might exit early

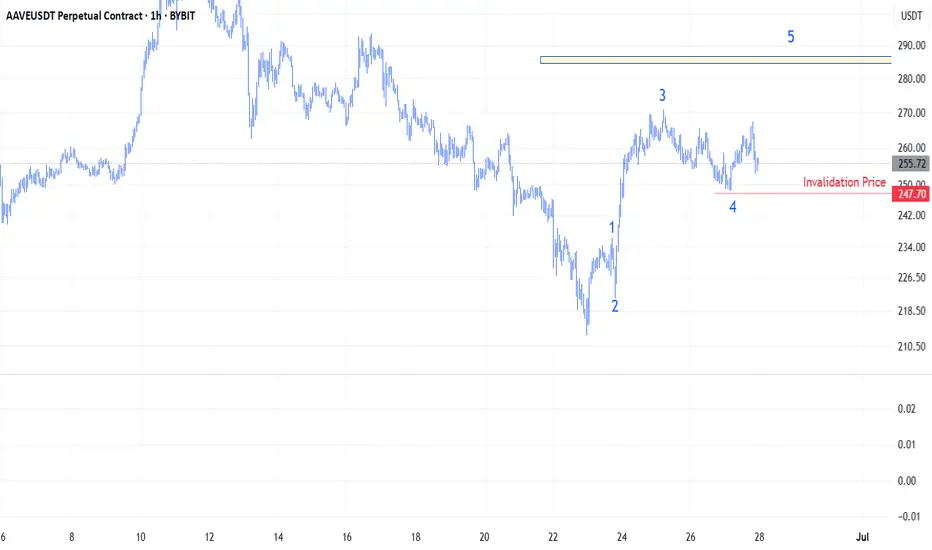
AAVE/USDT Elliott WavesIt appears on the chart that we are currently in Wave 4. Price is located between the 38.2% and 50% Fibonacci retracement levels of Wave 3, which is a common retracement zone for Wave 4. We observe a clearly formed three-wave corrective structure, with Wave C extending to 123.6% of Wave A,which is also a common target for Wave C. Additionally, there is hidden divergence between waves 2 and 4, which may indicate the potential for new highs ahead.Fibonacci cluster zones are pointing to potential targets near $285.
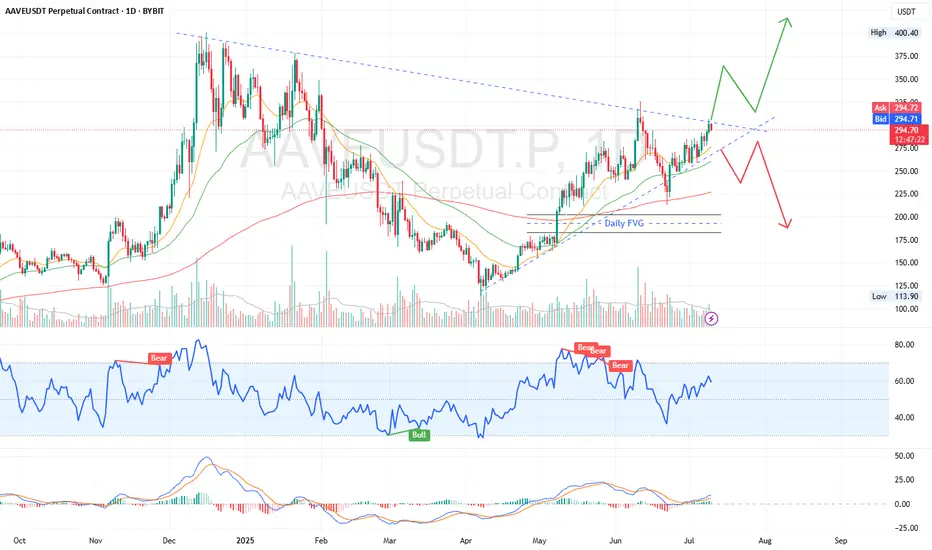
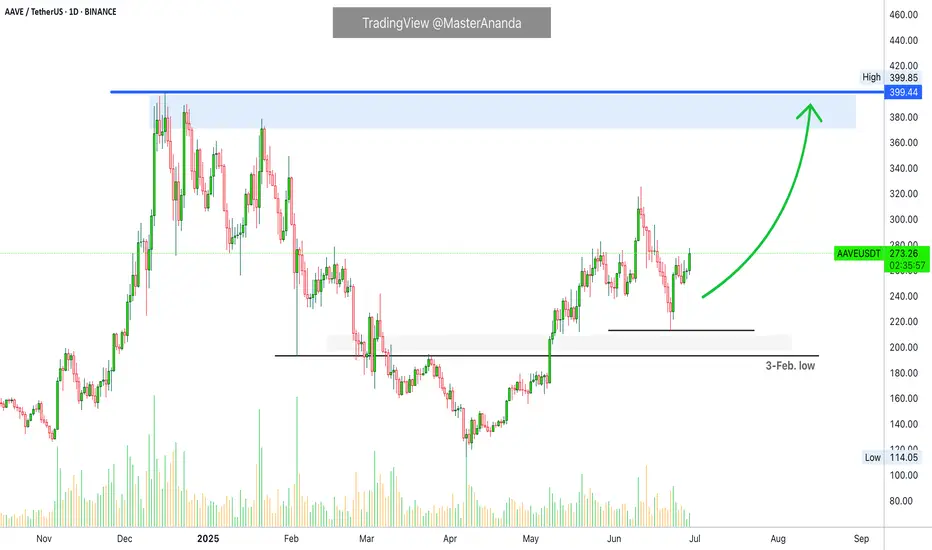
Aave: Next High the Dec. 2024 Price ($400), Then Higher...I thought about Aave today. The retrace was minimum, it was swift and strong. As soon as the retrace is over we get the continuation of the bullish wave. That is what I see on this chart.
The recent retrace did not reach the 3-Feb. low, and this is all you need to know.
Current action is indicative of the continuation of the bullish wave. When a move is very strong, with too much force, it cannot go for too long. This happened with the drop from 11 to 22-June. It was so strong and it ends in a flash. Once it is over there is no other place for the market to go. If the down-move is over, prices can only grow. Aave is growing now, it will hit $400 as the next target, the December 2024 high just to continue higher.
Expect more retraces and corrections along the way. Just as you saw a few weeks back, but always remember that retraces are just an opportunity to buy-in, rebuy and reload. The market will always recover and produce new and more growth.
Namaste.
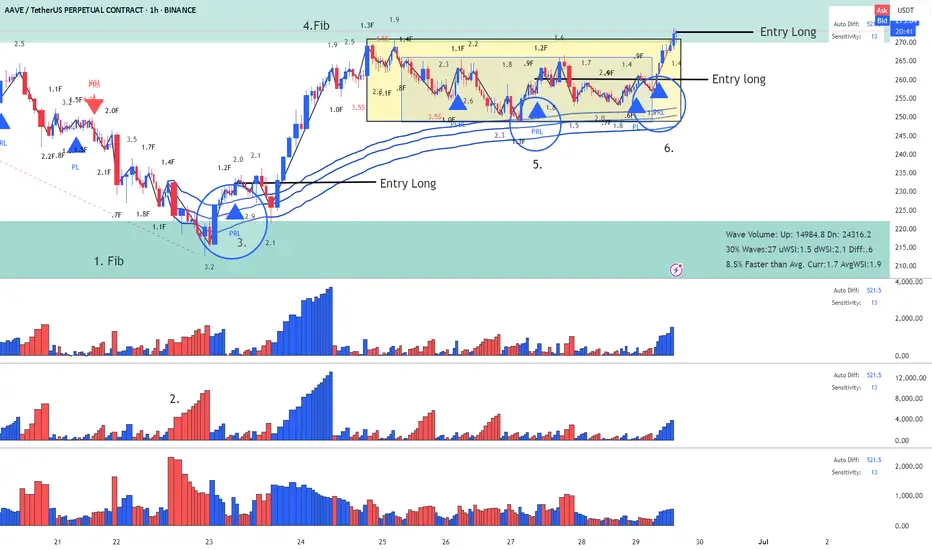
AAVE - Lesson 15 said Long and the pull back another LongReading the chart using Lesson 15 and Exit from Range methodology (annotations in sync with the chart)
1. Fib Location (buyers might enter)
2. Largest down volume wave (potential buyers in there) - Placed AVWAP at the beginning of the down wave wait for price to cross upward and pullback
3. Entry Long with PRL signal - first target fib closed with profit
4. Fib was reached and pull back started
5. PRL long on AVWAP acting a resistance
6. This my last Entry using strategy Exit from Range with a Plutus signal.
This is a risky Long since we are on Fib area, but I will take the risk.
Enjoy!
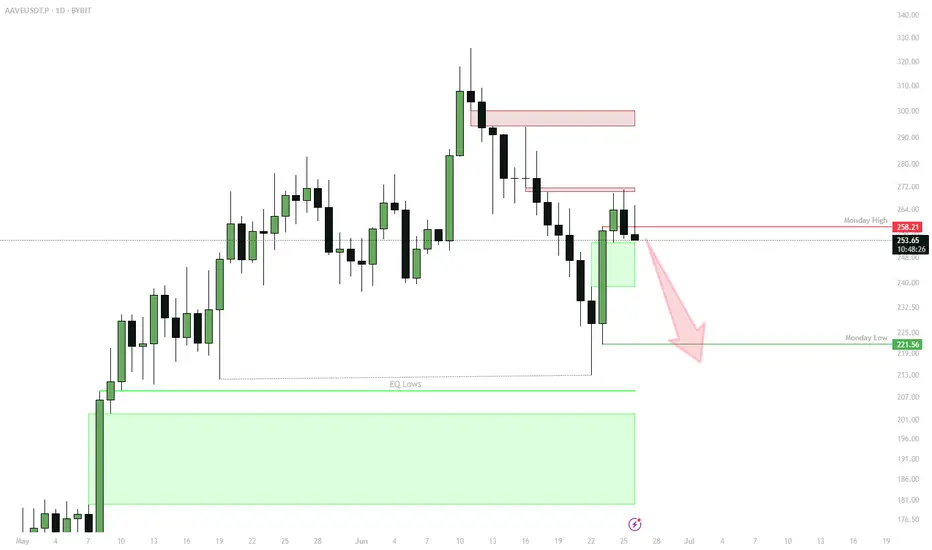
AAVE: Bearish Range Play — Watching for Move Back to Monday Low✅ Break above Monday high rejected, confirming resistance
✅ Structure is bearish — main scenario is return to Monday low ($221.56)
✅ Watch for reaction at target for partial profit taking
Active Scenario:
Hold/enter shorts while below Monday high
Target: $221.56 (Monday low)
Partial profit: On first touch of Monday low
Watch: Price reaction for potential reversal/setup at Monday low
🔔 Triggers & Confirmations:
Only consider reversal/long on strong bounce or reclaim at Monday low
Remain bearish while price is under Monday high
🚨 Risk Warning:
Local trend is bearish — don’t fight structure until reversal is confirmed
AAVE price analysis The price of CRYPTOCAP:AAVE has shown steady growth and strength in recent months.
But is everything in the crypto market as good as we would like it to be? Unfortunately, no.
Despite its strength, even the price of OKX:AAVEUSDT may still be subject to correction.
💡 So, for those who remember our global May idea for the price of #AAVE and have decided to buy this asset for their investment portfolio at a favorable price 👇
we have some advice for you: keep your pending buy orders in the $146-$182 range...
Now, not only in Ukraine, but throughout the world, “every day is a "crazy day,” anything can happen...
_____________________
Did you like our analysis? Leave a comment, like, and follow to get more

AAVE — Rising Wedge + Resistance Grind = Risk of PullbackStill one of the strongest DeFi leaders. Bullish market structure, but this persistent grind into diagonal resistance usually ends with a sharp pullback — and that's the zone I'm watching.
Eyes on $210–$237 for bids.
Targets: $400 and $600.
Set alarms and chill — opportunity comes to those who wait.

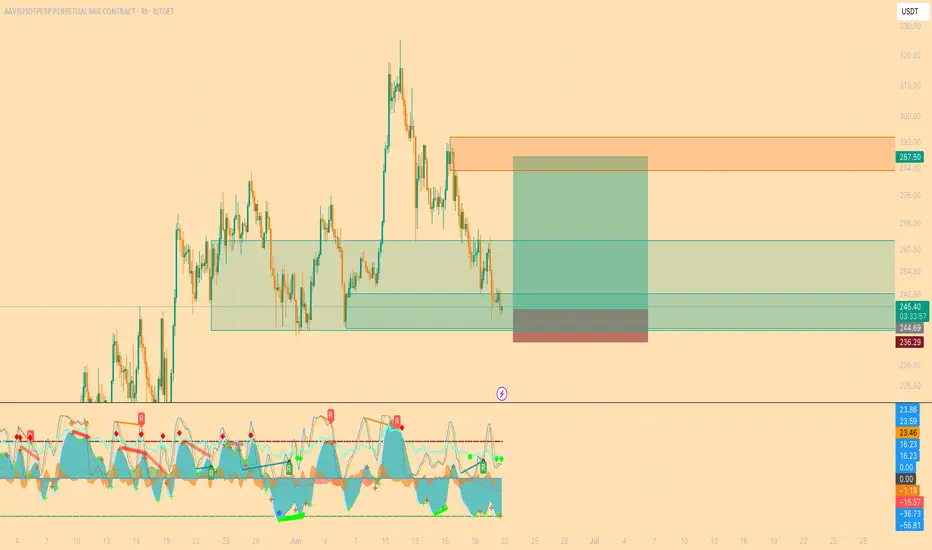
AAVEUSDT | Long Setup – Order Block + MARKET CIPHER BAAVE is currently presenting a compelling long opportunity supported by multiple technical factors:
📦 Order Block Reaction:
Price has tapped into a previously defined demand zone (order block) where strong buying interest was seen before. This level often acts as a magnet for liquidity and offers a solid risk-managed entry.
📉 Price Action Structure:
After sweeping the previous local low (liquidity grab), price has started to show signs of a higher low and higher high formation on lower timeframes — a classic reversal signal.
📊 Market Cipher B Confirmation:
Momentum shift with a green dot
Strengthening momentum waves
Money flow gradually turning positive
Oversold bounce indication
🎯 Target: 287.50 USDT
🛡️ Stop Loss: 236.29 USDT
📈 Risk/Reward Ratio: Favorable and supported by multi-layered confluence
This setup gains strength from the combination of smart money concepts, clean price action, and reliable indicator signals.
⚠️ Not financial advice. Always do your own risk management.
#AAVE #CryptoTrading #PriceAction #MarketCipher #Altcoins #SmartMoney #TradingView #AAVEUSDT
AAVE BINANCE:AAVEUSDT.P
Aave (AAVE) Comprehensive Update - Data as of June 20, 2025
Recent Technical and Protocol Developments
- Latest Protocol Upgrades
- Automated Security Module Upgrade (June 5, 2025): An automated risk management system for covering non-performing debt using token staking.
- Launch of the Aave v3 Marketplace on the Soneium Chain (June 3, 2025): Expanding coverage to 6 million wallet addresses.
- Aave v3.3 Improvements (February 24, 2025): Improvements to the liquidation mechanism and unsecured loan management.
- Supported Networks: 14+ networks, including Ethereum, Polygon, BNB Chain, Celo, ZKsync, and new Layer 2 networks such as Linea zkEVM.
Key Protocol Performance Metrics
Total Value Locked (TVL) | $25.58 billion
Average Yield Per Deposit (APY) | ~5% (for Stablecoin on Ethereum)
Trading Volume (30-Day) | Billions of Dollars
GHO Issued Supply | 1+ Billion (130% Collateralization)
---
Recent News and Initiatives
Token Buyback Approval: The Aave DAO community has agreed to purchase $4 million of AAVE tokens to support the price.
Partnership with Ant Digital Technologies: To develop a Real-World Asset (RWA) marketplace on Ethereum.
Ripple's RLUSD Integration: RLUSD Stablecoin Supports Borrowing and Depositing in the Aave Protocol.
Network Growth Rise: 20% Increase in DeFi Market Share Through May 2025.
---
Technical Analysis and Forecasts
Current Trend
- Strong Rise from $114 (April) to $312 (June) (+180%).
- Technical resistance at $266, strong support at $250.
Short-Term Outlook
- Potential growth of +20–50% if the $266 resistance is broken, targeting $320–$350 (based on a V-shaped recovery pattern).
- Positive Indicators: Declining exchange balances, increasing institutional demand.
Potential Risks
- Market Volatility: -15% drop in 4 days in May due to selling pressure, but the recovery was rapid.
- Dependence on Ethereum performance: 95% of TVL is on ETH-pegged networks.
- Competition from DeFi protocols: such as Pendle and Compound, especially in yield markets.
---
💎 Conclusion
Aave shows strong growth in 2025 with technical expansion (new networks, security upgrades), increased adoption (record TVL, enterprise partnerships), and positive price indicators. The main challenges are market volatility and competition, but initiatives such as buybacks and the RWA merger are boosting investor confidence. It is recommended to monitor the $250 (support) and $266 (resistance) levels for entry/exit timing.

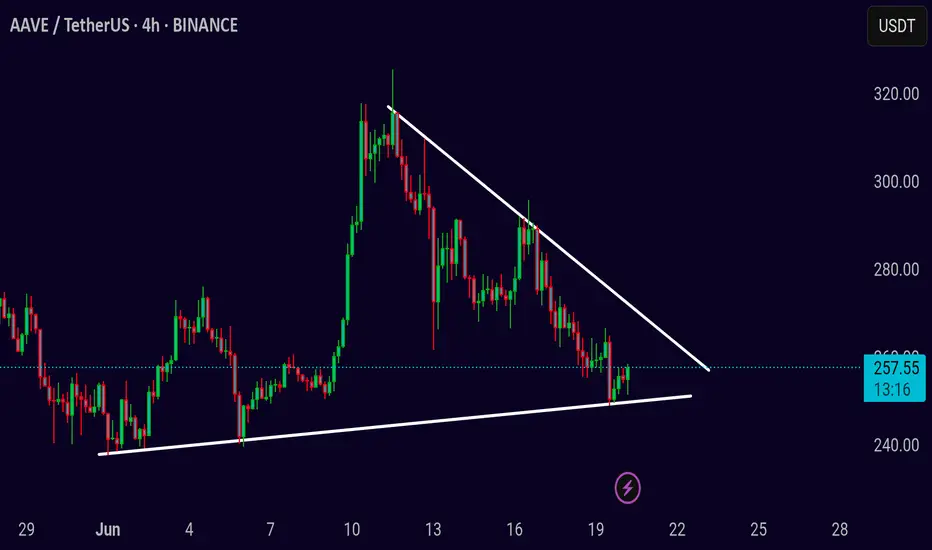
AAVE/USDT – Symmetrical Triangle Squeeze on 4HAAVE/USDT – Symmetrical Triangle Squeeze on 4H
Chart Pattern: Symmetrical Triangle
Timeframe: 4-Hour
Published: June 20, 2025
AAVE/USDT is currently consolidating within a symmetrical triangle. Price is respecting the rising support near the 243–245 zone, while being squeezed by a descending resistance around 263–265. This pattern typically leads to a breakout as volatility compresses.
Bullish Scenario
Entry: On a 4H candle close above 265 with volume
Target 1: 278
Target 2: 290
Stop-loss: Below 242
Bearish Scenario
Entry: Close below 243
Target 1: 230
Target 2: 215
Stop-loss: Above 260
Let the breakout confirm with strong volume before taking a position. Patience is key as AAVE approaches the apex of this formation.
#AAVE/USDT#AAVE
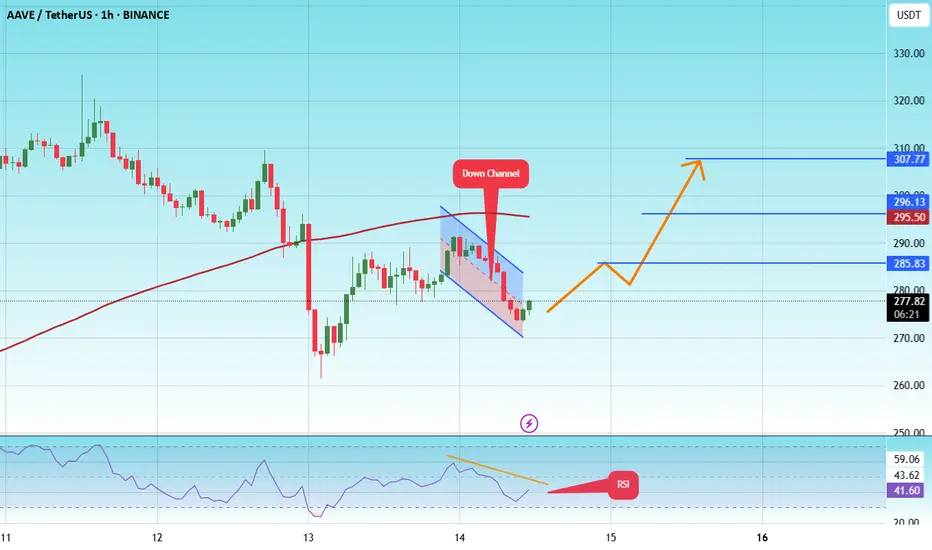
The price is moving within a descending channel on the 1-hour frame and is expected to break and continue upward.
We have a trend to stabilize above the 100 moving average once again.
We have a downtrend on the RSI indicator that supports the upward move with a breakout.
We have a support area at the lower limit of the channel at 268, acting as strong support from which the price can rebound.
Entry price: 277
First target: 285
Second target: 296
Third target: 307
AAVE BUYZONEAAVEUSDT is looking weak here, so we cant buy from here. Rather we can wait for SSL sweep and tap in Demand Zone and see reversal.
