ACE/USDT – Breaking Out of the Falling Wedge? Potential Reversal📝 Technical Analysis Overview:
The ACE/USDT pair on the daily timeframe (1D – Binance) is showing signs of a potential breakout from a long-standing falling wedge pattern, suggesting a possible trend reversal to the upside.
🔍 Key Technical Highlights:
1. Falling Wedge Pattern:
A clearly defined
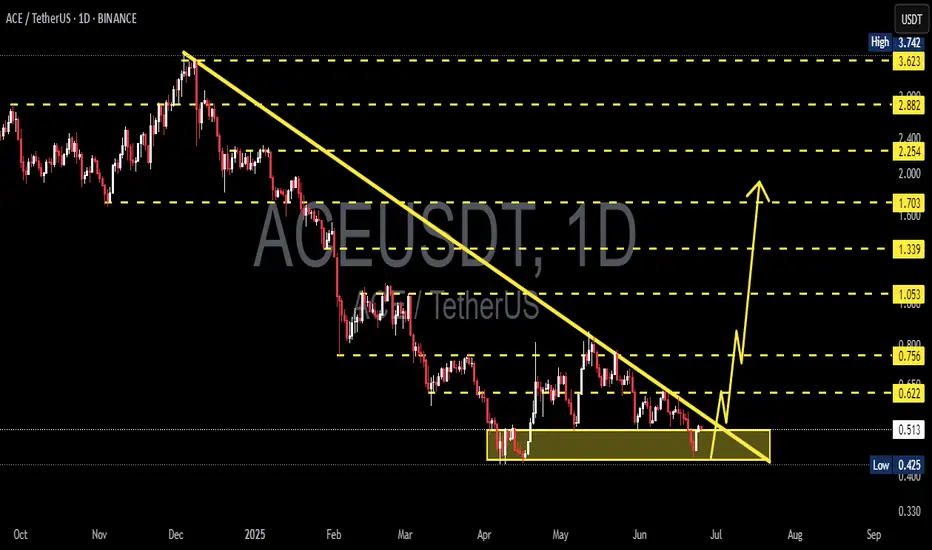
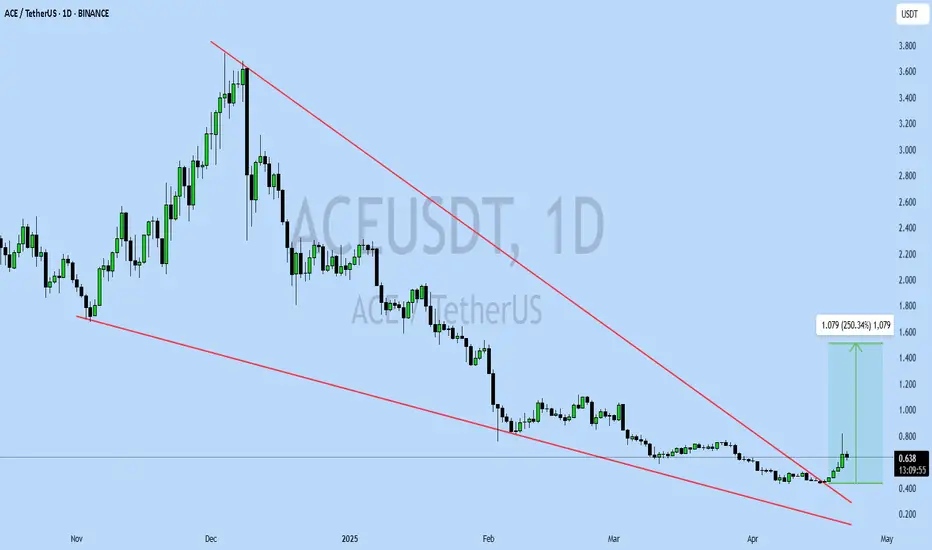
ACEUSDT UPDATEACE/USDT Technical Setup
Pattern: Falling Wedge Breakout
Current Price: $0.635
Target Price: $1.714
Target % Gain: 250.34%
Technical Analysis: ACE has broken out of a long-term falling wedge pattern on the 1D chart with strong bullish momentum. Volume has increased significantly, confirming the br
ACEUSDT 1D AnalysisACE ~ 1D Analysis
#ACE is attempting to break through this resistance line. A full-body candle close above this resistance line will confirm a continued bullish trend with a minimum target of 10%+.

ACE (SPOT - INVEST )BINANCE:ACEUSDT
ACE / USDT
(4H + 1D) time frames
analysis tools
____________
SMC
FVG
Trend lines
Fibonacci
Support & resistance
MACD Cross
EMA Cross
______________________________________________________________
Golden Advices.
********************
* Please calculate your losses before any ent

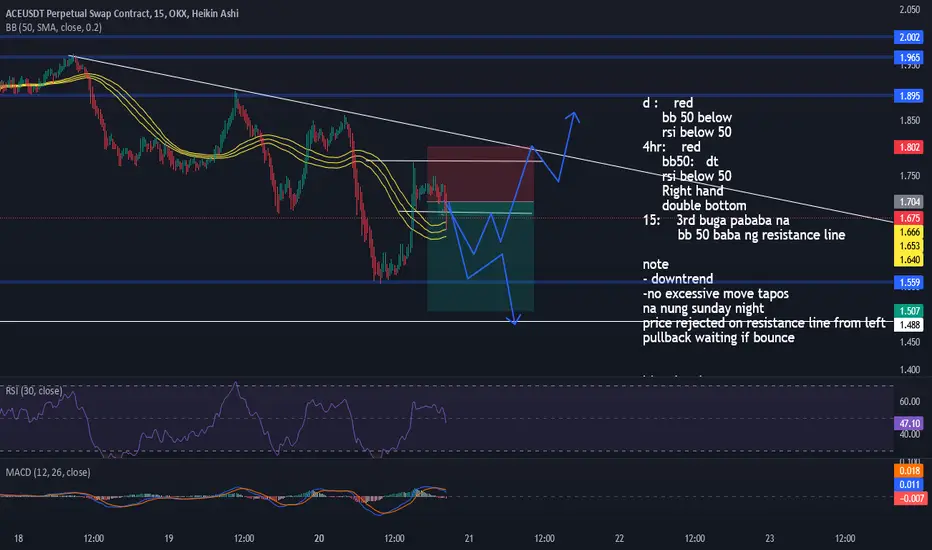
TECHNICAL ANALYSIS TAGALOGd : red
bb 50 below
rsi below 50
4hr: red
bb50: dt
rsi below 50
Right hand
double bottom
15: 3rd buga pababa na
bb 50 baba ng resistance line
note
- downtrend
-no excessive move tapos
na nung sunday night
price rejected on resistance line from lef
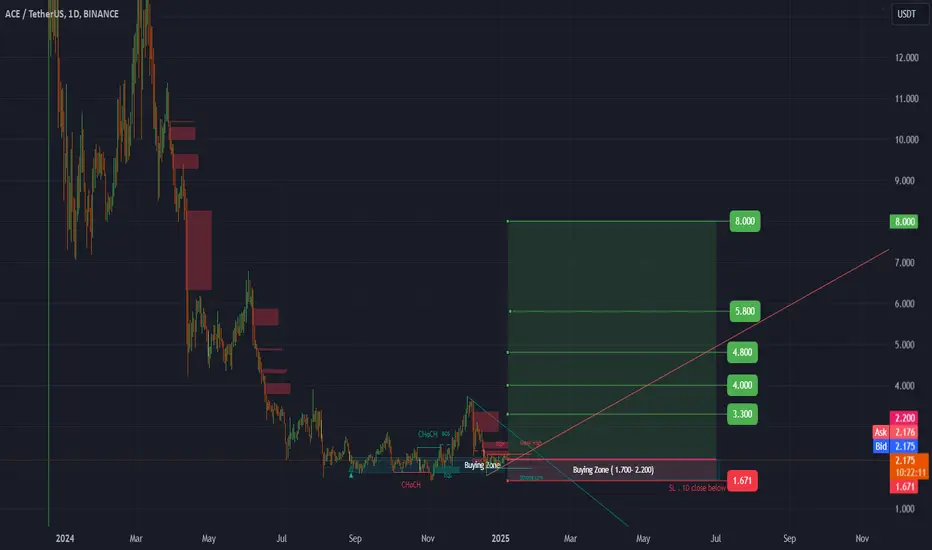
#ACE (SPOT) IN ( 1.700- 2.200) T.(8.000) SL(1.671)BINANCE:ACEUSDT
#ACE / USDT
Entry( 1.700- 2.200)
SL 1D close below 1.671
T1 3.300
T2 4.000
T3 4.800
T4 5.800
T5 8.000
______________________________________________________________
Golden Advices.
********************
* collect the coin slowly in the entry range.
* Please calculate your losses
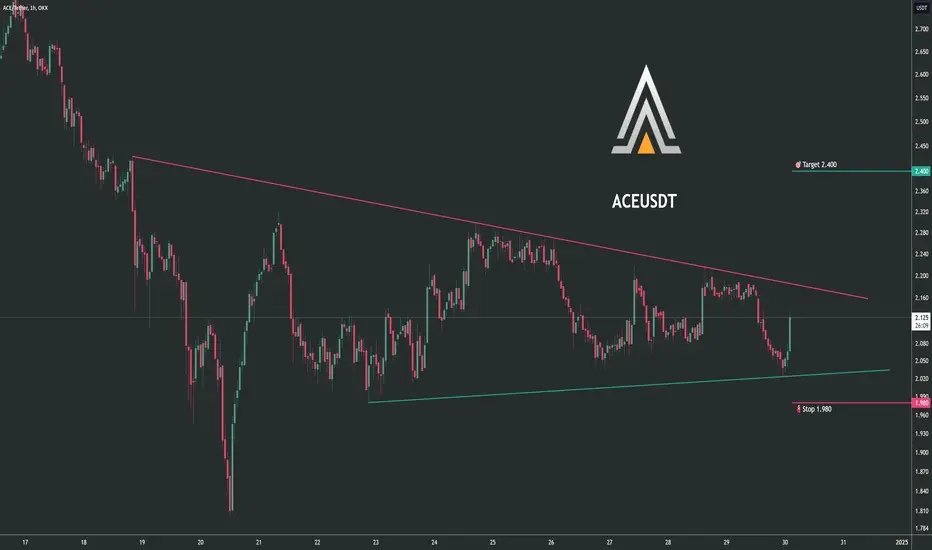
Trading opportunity for ACEUSDTBased on technical factors there is a Buy position in :
📊 ACEUSDT
🔵 Buy Now
🪫Stop loss 1.980
🔋Target 2.400
📏 R/R 1.8
💸RISK : 1%
We hope it is profitable for you ❤️
Please support our activity with your likes👍 and comments📝
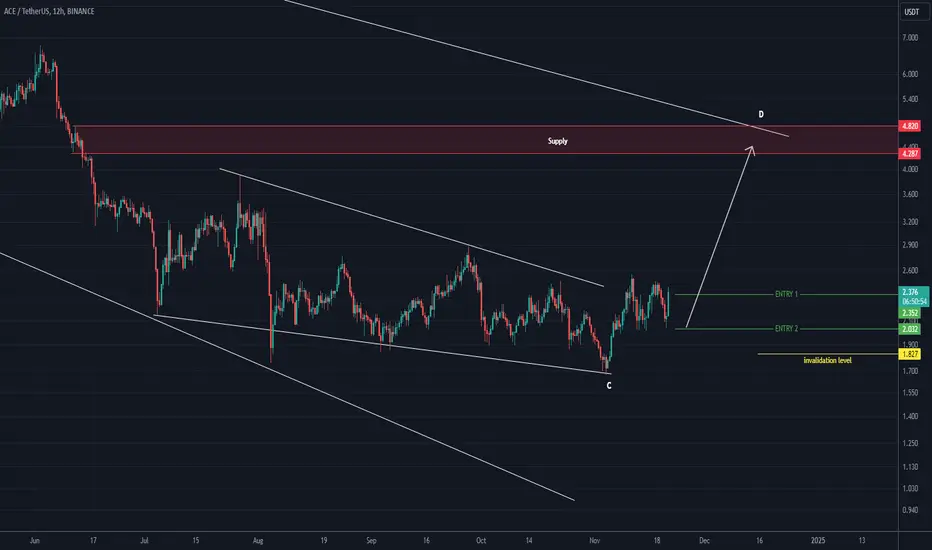
ACE LOOKS BULLISH (1D)It looks like it is going to finish the big C wave which is a triangle and enter the D wave.
Wave D is bullish.
We have two entry points marked on the chart.
The target can be the red box.
Closing a daily candle below the invalidation level will violate this analysis
For risk management, please
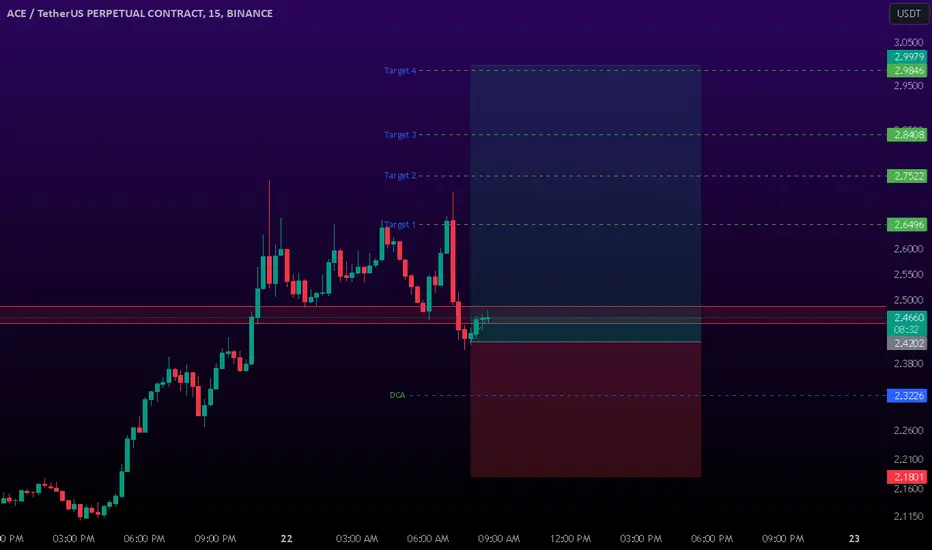
ACE Long 15m Sl -9.33%ACE Long Setup
Reason:
Strong Bullish Momentum.
Breakout Confirmation done on HTF
Resting in Golden Pocket.
All technical indicators Suggesting bullish Sign
Possible in very short term.
Best Regard,
Crypto Panda
BINANCE:ACEUSDT
BINANCE:ACEUSDT.P
BYBIT:ACEUSDT.P
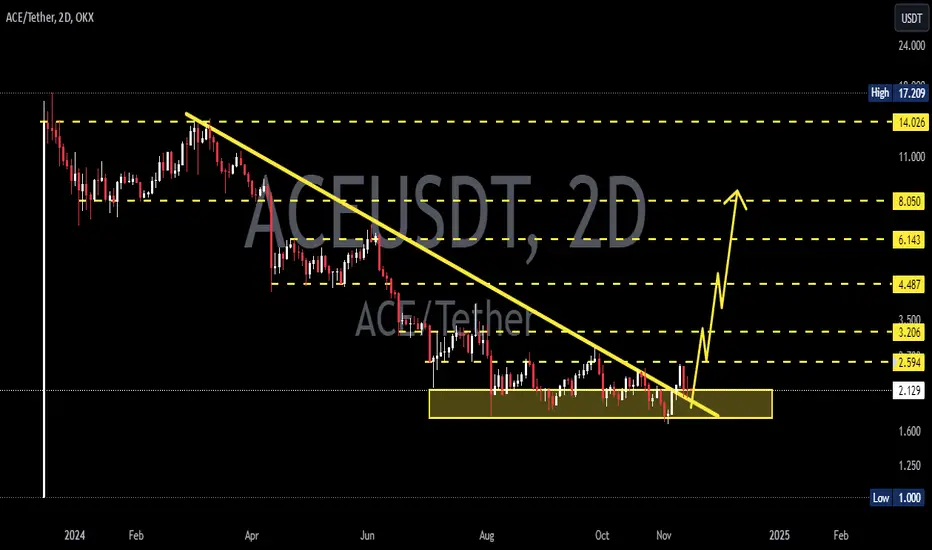
ACEUSDT 1WACE ~ 2D
#ACE Back to retesting this support block. So far this support block continues to keep the price from falling lower. If you still have Conviction on this coin,. This support block would be a very good buying place for now. with a target of 20%++
See all ideas
Summarizing what the indicators are suggesting.
Oscillators
Neutral
SellBuy
Strong sellStrong buy
Strong sellSellNeutralBuyStrong buy
Oscillators
Neutral
SellBuy
Strong sellStrong buy
Strong sellSellNeutralBuyStrong buy
Summary
Neutral
SellBuy
Strong sellStrong buy
Strong sellSellNeutralBuyStrong buy
Summary
Neutral
SellBuy
Strong sellStrong buy
Strong sellSellNeutralBuyStrong buy
Summary
Neutral
SellBuy
Strong sellStrong buy
Strong sellSellNeutralBuyStrong buy
Moving Averages
Neutral
SellBuy
Strong sellStrong buy
Strong sellSellNeutralBuyStrong buy
Moving Averages
Neutral
SellBuy
Strong sellStrong buy
Strong sellSellNeutralBuyStrong buy
Displays a symbol's price movements over previous years to identify recurring trends.