USTEC: Likely continuation following pullbackNAS100 climbed a steep uptrend and my expectation is for a continuation as marked on my chart, with an upside target at around 24,300.
This area here is where it can become a decision point, either price finds support and bounces, or it breaks below, and that’s when we might see the move start to e

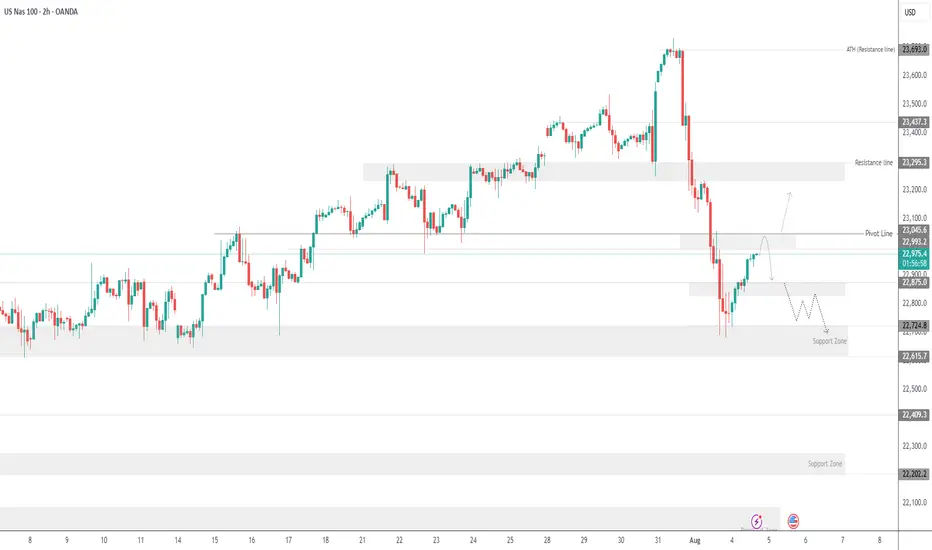
USNAS100 Holds Bearish Below 23045USNAS100 – Overview
The index maintains a bearish momentum as long as it trades below the pivot zone between 22990 and 23045.
To confirm a bullish reversal, the price must break above 23045 and close a 1H candle above it.
On the downside, a break below 22875 would reinforce bearish pressure, open
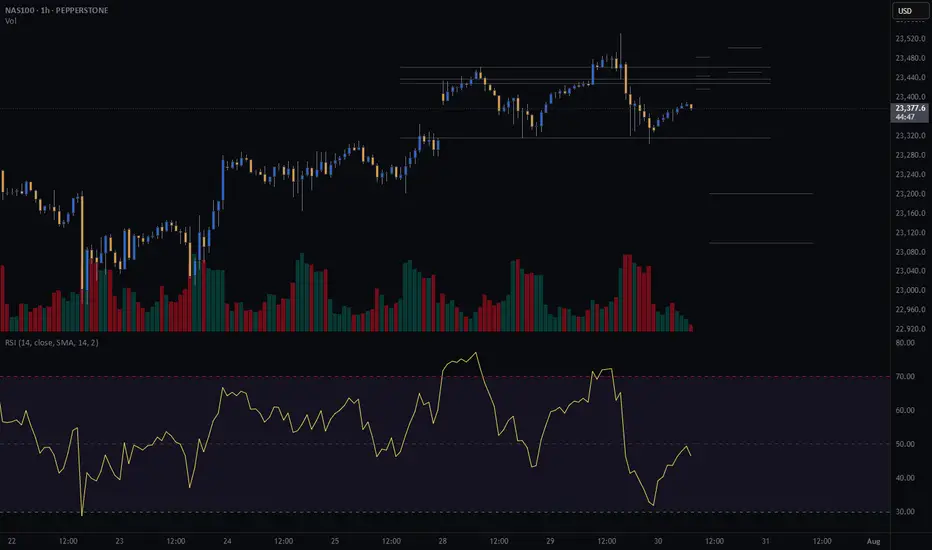
US100 Price Action InsightUS100 Price Action Insight
In recent analysis, we’ve seen the US100 drop multiple times last month by around 3.5% to 4%, but each time it quickly bounced back, showing that these moves were simply buying opportunities during deep pullbacks.
This time, the index fell by about 4.3% due to fears ove

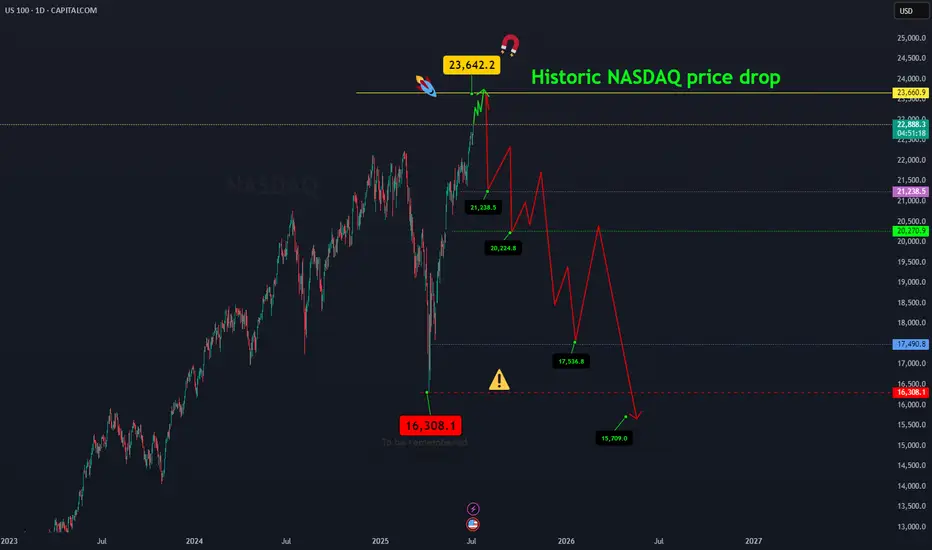
NASDAQ price dropAfter the Nasdaq price reaches around 23642.2, a historic drop will occur and the target is to drop to 16308.
Whatever happens at the highest price, the final destination is towards 16308.
I have identified the price levels in the middle of this expected drop that can cause the price to correct.
I
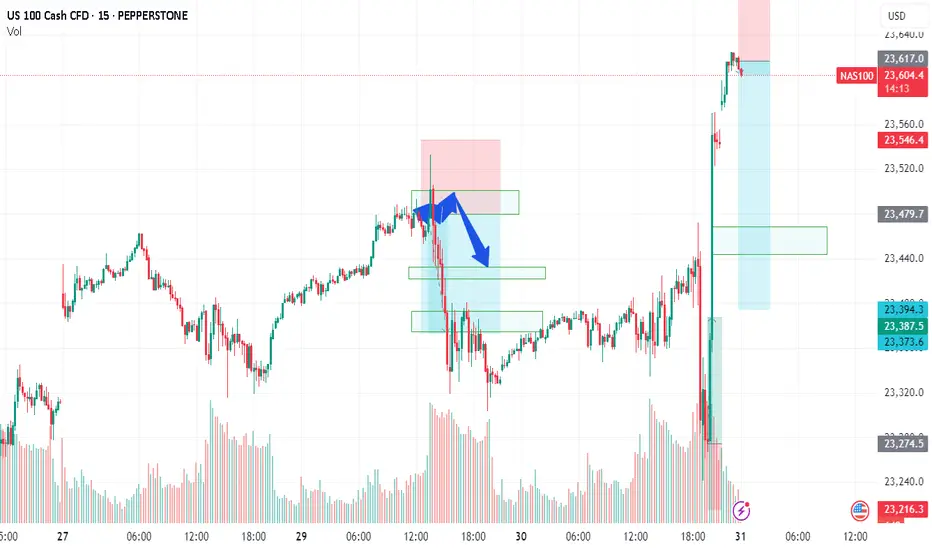
CASH100 (NASDAQ) CRASH - Head and shoulders Risk/reward = 3.7
Entry price = 23 430
Stop loss price = 23 503.2
Take profit level 1 (50%) = 23 202
Take profit level 2 (50%) = 23 099
Still waiting for some variables to confirm before entering the trade
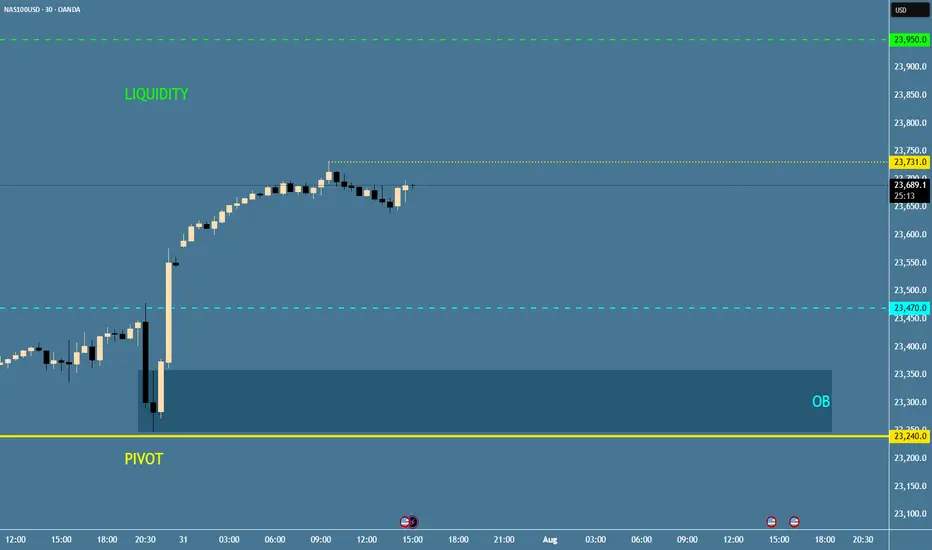
NAS100 - Update Dear Friends in Trading,
How I see it,
I will be waiting for a clear and decisive break below the PIVOT.
Keynote:
I am not trading NASDAQ at all...just monitoring patiently!!
I will keep you in the loop as the stock market progress...
I sincerely hope my point of view offers a valued insight
Th
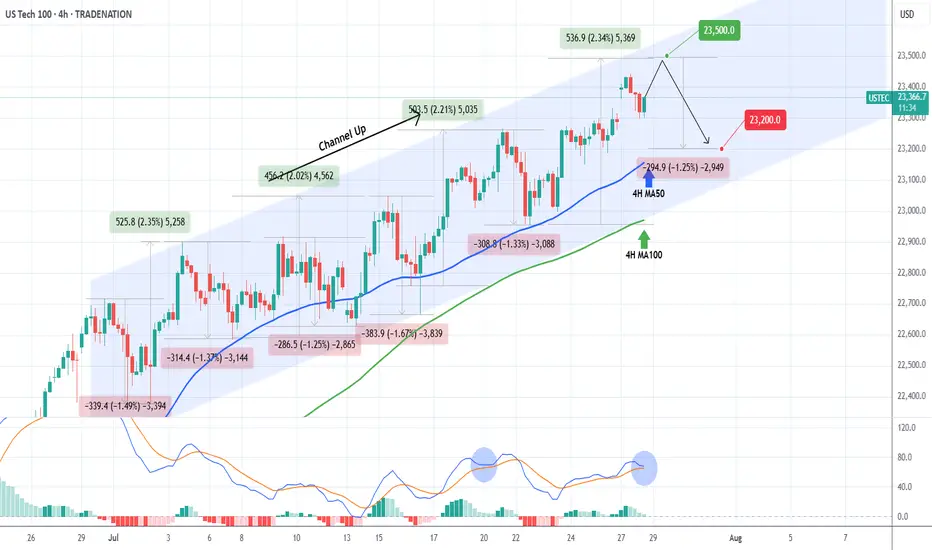
NASDAQ Channel Up to be rejected soon.Nasdaq (NDX) has been trading within a Channel Up since the start of the month. The primary Support level has been the 4H MA50 (blue trend-line), which hasn't closed a 4H candle below it since July 14.
Right now the index is on its latest Bullish Leg, which can technically extend by +2.35% (max suc
NASDAQ technical analyse.📉 NAS100 Technical Analysis – Potential Reversal Zone Identified (4H Chart)
Price has seen a strong bearish move, breaking through multiple support levels. Currently, it is approaching a key demand zone between 22,600 – 22,420, which previously acted as strong support in early July.
I'm watching t

NAS - LET'S MAKE MILLIONS Team, last night NAS I was expect the FALL BACK as I predicted rate un-change will get NASTY on both DOW AND NAS.
So I have a set up entry LONG, i didnt expect the NAS flying to the moon.
both target hit so fast in 15 minutes
However, today is another opportunity to SHORT NAS on the current market
Nasdaq Short: multiple reasonsOver here, I present to you the Nasdaq short idea again. For my previous idea, it was stopped out at 23500. This time, I changed the wave counts again, mainly merging the previous wave 5 into wave 3, allowing for the new high to be a wave 5.
On top of that, here are the few other reasons for the sh

See all ideas
Displays a symbol's price movements over previous years to identify recurring trends.