ACT/USDT - Mega pump 400%Huge pump loading! After a massive run, ACT has swept liquidity and been consolidating for over 130 days. Whales are loading up, supply is drying, and the breakout pressure is building. Once this range cracks, expect fireworks and a run straight for new highs. Next leg incoming!
ACTSOLUSDT trade ideas

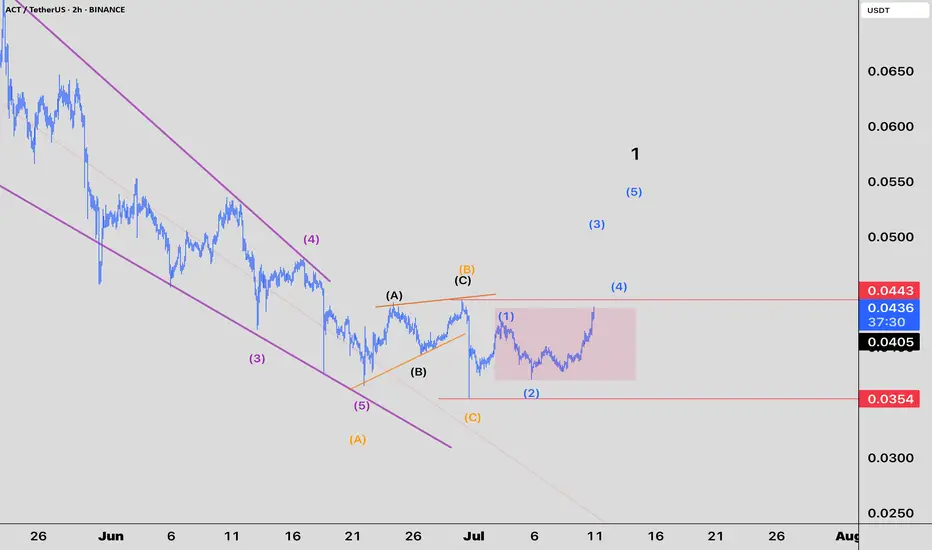
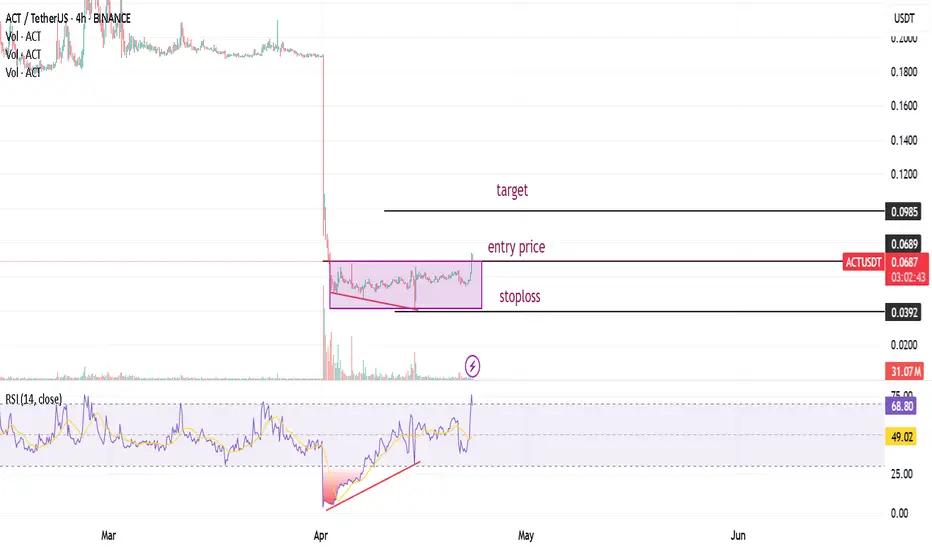
$act Impulse wave starting after ABC correction -
🧠 Idea Description:
After a clear (A)-(B)-(C) corrective structure, price formed a solid bottom at 0.0354. Since then, the market entered a consolidation range and has now broken out to the upside.
According to Elliott Wave Theory, this breakout likely marks the beginning of an impulsive move. We're currently in wave (iii) or (v) of a new 5-wave structure.
🔍 Key Levels:
Support: 0.0354 (last low / invalidation point)
Resistance: 0.0443 (recent peak — breaking it confirms bullish continuation)
Target zones:
1.0 extension: 0.053
1.618 extension: 0.062
2.0 extension: 0.0669
2.618 extension: 0.0758
✅ Summary:
Price has exited a consolidation range and may be entering a bullish impulse wave. Watch for a confirmed break of 0.0443. Ideal area to target partial take-profits using Fibonacci extensions.
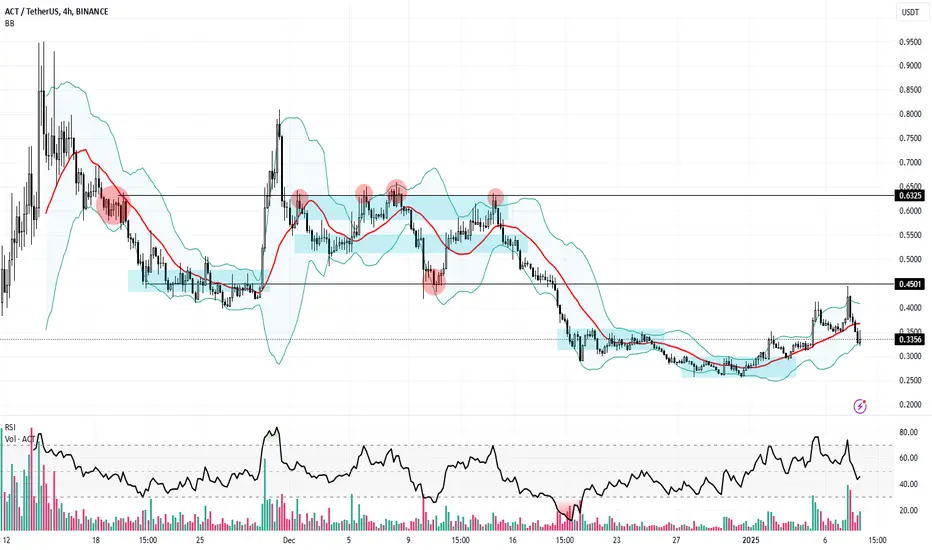
The market is challenging for newbies, but $ACT keep strongThe buy zone, which is between 0.32-0.33, has been reached by BINANCE:ACTUSDT , although this area must be watched.
As the selling force is lessened, the chart builds up and the purchasing volume resurfaces before continuing to move into the line.
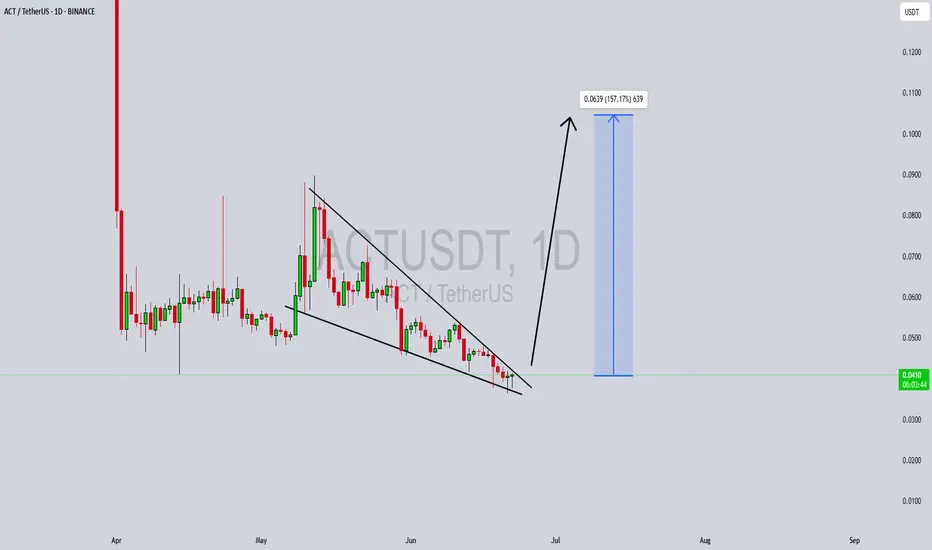
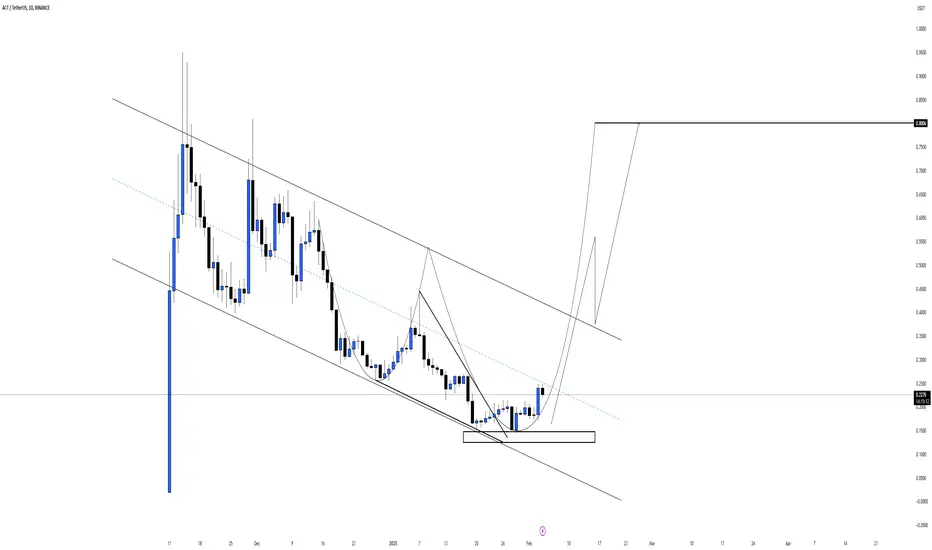
ACTUSDT Forming Classic Falling Wedge ACTUSDT is currently exhibiting a classic falling wedge pattern on the chart—a bullish reversal setup known for its high probability of a breakout to the upside. After a consistent downtrend, the price action has started to compress within converging trendlines, suggesting that selling pressure is diminishing. A breakout above the wedge's resistance line could trigger a sharp price surge. Technical traders often look to such formations for potential entries, especially when combined with growing volume and renewed market sentiment.
Volume analysis reveals a notable uptick in recent sessions, signaling that investors are beginning to accumulate ACTUSDT. This increased interest could be due to fundamental news or broader market momentum returning to altcoins. When volume expands near the apex of a falling wedge, it usually reinforces the validity of the pattern and strengthens the breakout potential. With this setup, the projected move points to a possible gain of 140% to 150%, aligning with previous key resistance levels that the price could retest post-breakout.
On a momentum front, indicators like RSI and MACD are starting to turn bullish, offering early signs of a reversal. The price is also holding above short-term support zones, suggesting the formation of a base. The combination of technical structure, volume dynamics, and improving sentiment makes ACTUSDT a strong contender for a breakout move in the near term. Such opportunities are especially attractive in trending markets where capital rotates quickly into coins showing strong chart setups.
Given this confluence of bullish signals, ACTUSDT could become a leading performer in the altcoin space over the coming weeks. Traders and investors are advised to keep a close watch for breakout confirmation and subsequent retest levels, which could offer optimal entry points for both short-term gains and medium-term swing setups.
✅ Show your support by hitting the like button and
✅ Leaving a comment below! (What is You opinion about this Coin)
Your feedback and engagement keep me inspired to share more insightful market analysis with you!
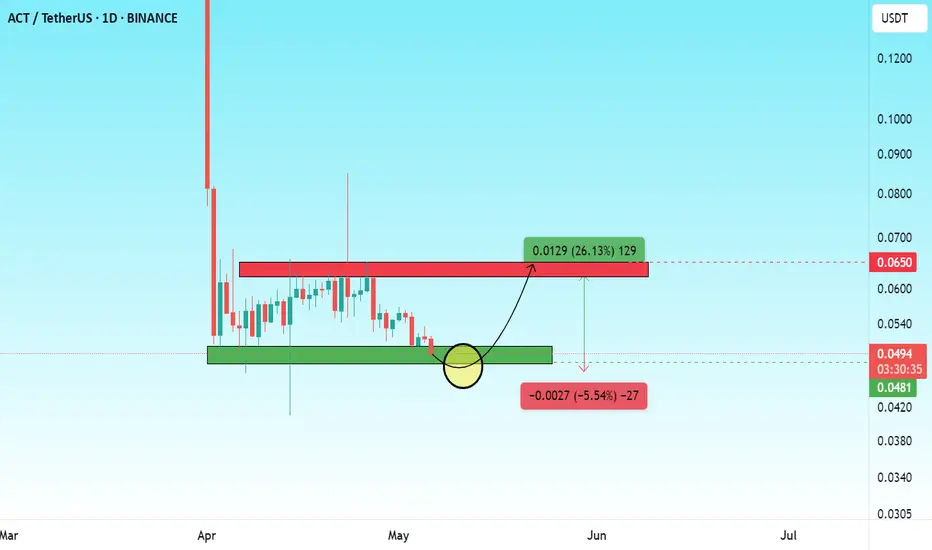
On the zero line of the borderACTUSDT – Daily Technical Analysis
After experiencing a 74% correction, ACT has reached a major support level at $0.0480 , where the price has currently stabilized. From this zone, there is a potential upside move of 26%, targeting the resistance at $0.0650.
However, traders should closely monitor the support level, as a confirmed breakdown below $0.0480 could trigger a bearish flag continuation pattern, potentially leading to another 74% drop.
🟢 Support: $0.0480 (major level)
🔴 Resistance: $0.0650 (26% above current price)
⚠️ Risk: Breakdown could activate a bearish flag and resume the downtrend
$ACTUSDTThis coin is about to fly
After the accumulation on the demand area, it's going to move really fast
Pls manage your risk, this is not in any way a financial advise
ACTUSDT is showing bullish divergence in 4H time frame and also ACTUSDT is showing bullish divergence in 4H time frame and also broke rectangular box
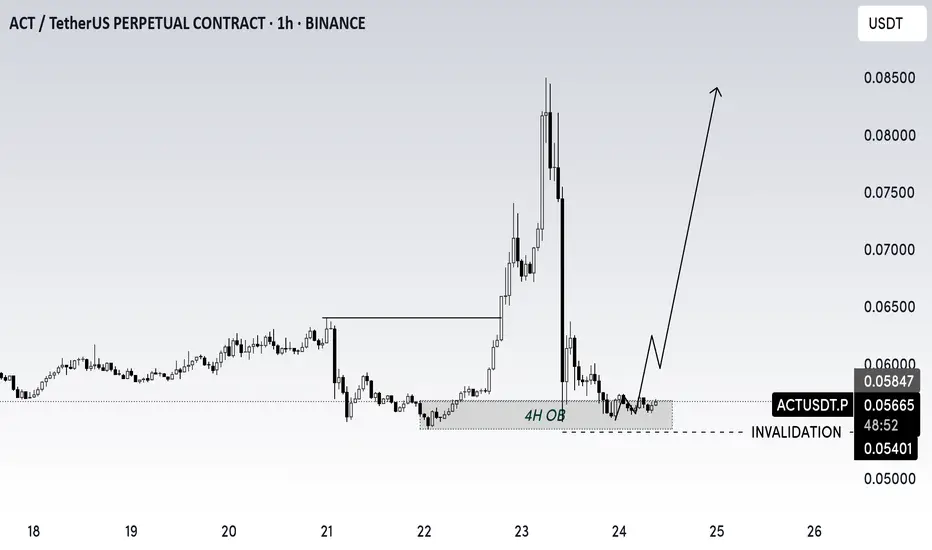
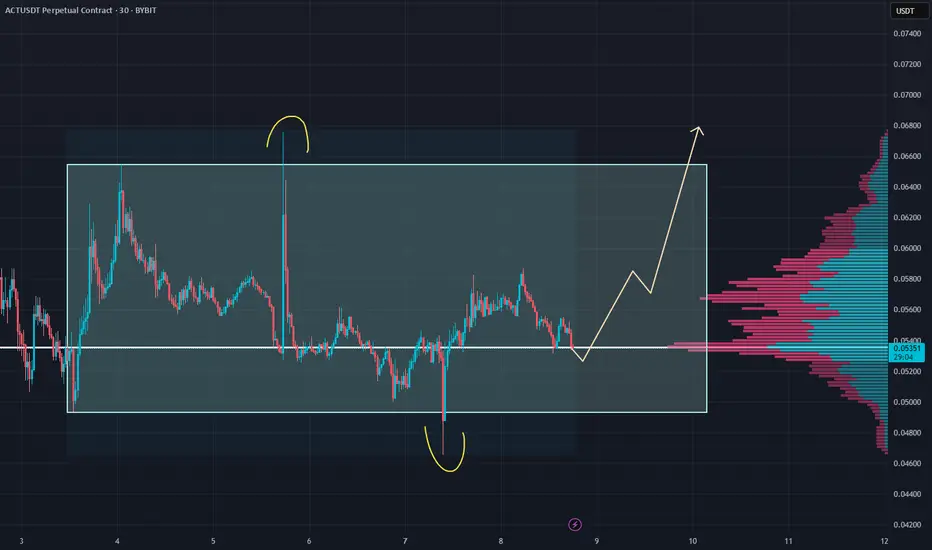
ACT: Classic Range Accumulation with Breakout Potential#ACT is showing clean sideways movement with classic deviations—textbook accumulation. Horizontal volume is stacked right in the middle, confirming the range is solid.
This one’s coiling up for a move. Follow me so you’re in before it breaks out. 🚀
Entry: 0.052-0.0536
TP: 0.068
SL: 0.0463
Alpha isn't free.Alpha isn't free.
If someone’s giving you gems 24/7 with no filter, no delay, no gate...
Chances are:
You're the liquidity.
Trade on Gate—where you’ll find all the coins you want, with over 3,700+ spot trading pairs available!

ACT Sudden Death ChroniclesOMFG, can you even process this?! Last night we were mooning with "ACT to da moon", woke up today to "ACT to the underworld" — a 1.05M USDT spot dump CRUSHING a $200M market cap?! Thanos-level efficiency right there!
Here's the tea: Binance pulled a double whammy (slashing position limits overnight), triggering whale tantrums — "You cap my bags? I'll nuke the chart!" Cue massive spot liquidation, awakening the algo bot apocalypse in perpetual contracts. Longs got Thanos-snapped mid-air, $10M evaporated faster than a shitcoin hype cycle, diamond hands turned to ash...
The ultimate flex? Devs executed their "strategic retreat" smoother than Usain Bolt's 100m dash, exit scamming while shouting "This is good for ACT!" Crypto truths reinforced:
🤖 Bot-driven hedging = Mixing pesticide with Moutai — lethal combo
💸 Devs cutting losses = Retail losing heads — slowpays become tombstone epitaphs
(PSA: Bear market survival 101 — Grab Gate.io's $1.3M March airdrop buffet! GT holders get free alpha drops while normies get rekt. Live to trade another day. 🚑)
ACTUSDT CHART ANALYSİS - EDUCATIONAL POSTHow NFT Technology Developed
NFT technology was created in 2017 based on Ethereum smart contracts. Since then, we have witnessed many successful NFT projects and deals. Stories like these perfectly describe the current and future possibilities of the technology.
The development of blockchain technology and the emergence of NFT services coincided with other processes in society and the economy. Many new players appeared in the stock markets, including non-professional traders and amateur investors.
The democratization of financial markets coincided with the pandemic: being in self-isolation, alone with their devices, many people began to pay attention to new financial instruments.
The information that arose around them also played a specific role in the “revival” of NFTs. The big names in the news headlines supporting NFTs couldn’t help but draw attention to them.
That is one of the reasons why the success of the technology was inevitable.

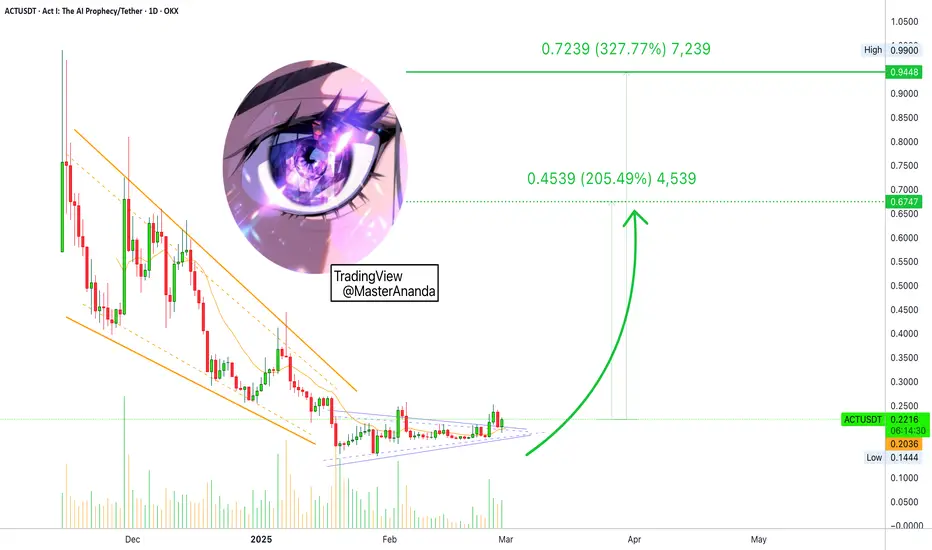
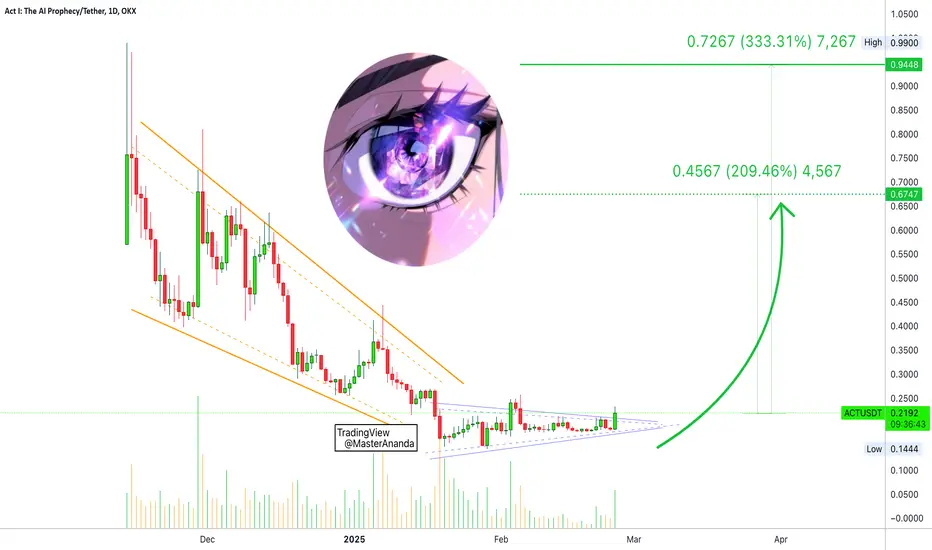
Public trade #5 - #ACT price analysis ( Act I: The AI Prophec )Nowadays, the #ACT coin is quite hype.
And most platforms display the OKX:ACTUSDT chart as circled above.
What do you think of this full price chart of #ACTUSDT presented by us?)
Scary, isn't it?)
👀 We are going to watch this asset for now #ActITheAIProphecy
And we would dare to buy not earlier than if the price falls into the Buy zone $0.024 - $0.036 - $0.048
_____________________
Did you like our analysis? Leave a comment, like, and follow to get more

What’s next?NASDAQ:ACT is approaching the green zone 🟩, where many traders previously entered.
📌 What’s next?
We need confirmation before entering a long position.
If buyers step in, we could see a potential bounce from this zone 📈.
🎯 Potential Move:
✅ Waiting for confirmation at the green zone
approaching the blue zoneAnalysis 🚨
NASDAQ:ACT is approaching the blue zone 🔵. Waiting for confirmation before considering a long entry from this level.
🎯 Potential Entry:
🔵 1️⃣ Blue zone (waiting for confirmation)
The AI Prophecy: Marketwide Bullishness ProofThis is a chart and pair that I showed you recently. Why am I showing it to you again?
This is the proof.
The Altcoins market is bullish and the Altcoins market can only be bullish when Bitcoin is either growing or set to grow.
Notice the last five days, how did Bitcoin perform?
When Bitcoin crashes, everything crashes but, look at this divergence between Bitcoin and many Altcoins.
Look at the last five days for ACTUSDT, or many others, and what do you see?
➖ This pair remains strong and trading above EMA13.
➖ This pair is super-bullish, above a consolidation pattern and ready to grow.
➖ This pair broke out of a downtrend is now ready to move up.
This and other Altcoins cannot grow while Bitcoin goes down toward 40K, that's not how Bitcoin/Crypto works.
The market grows when Bitcoin grows.
What this chart reveals is a hidden bullish bias, the bottom is already in. We are going up now.
Hold patiently. Feel secure and feel safe because Cryptocurrency is set to grow like never before.
Thanks a lot for your continued support.
Namaste.
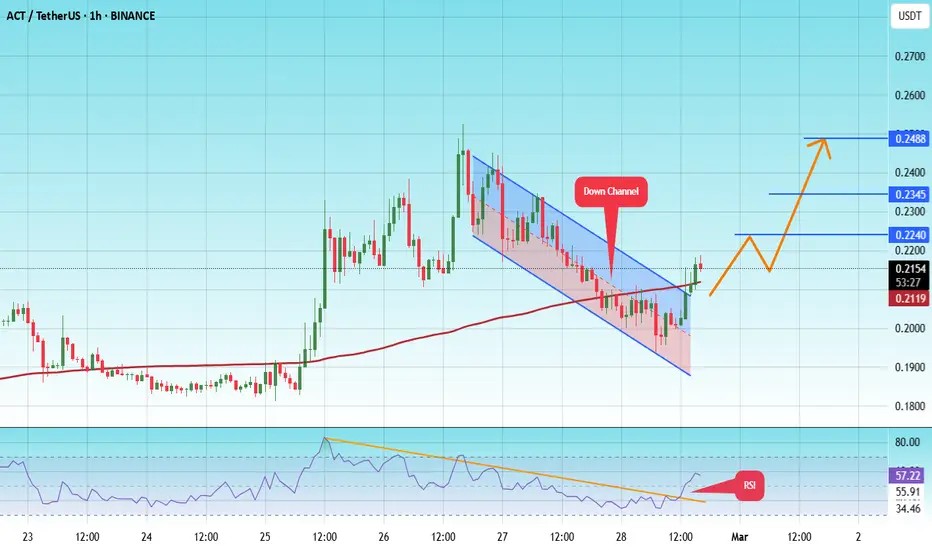
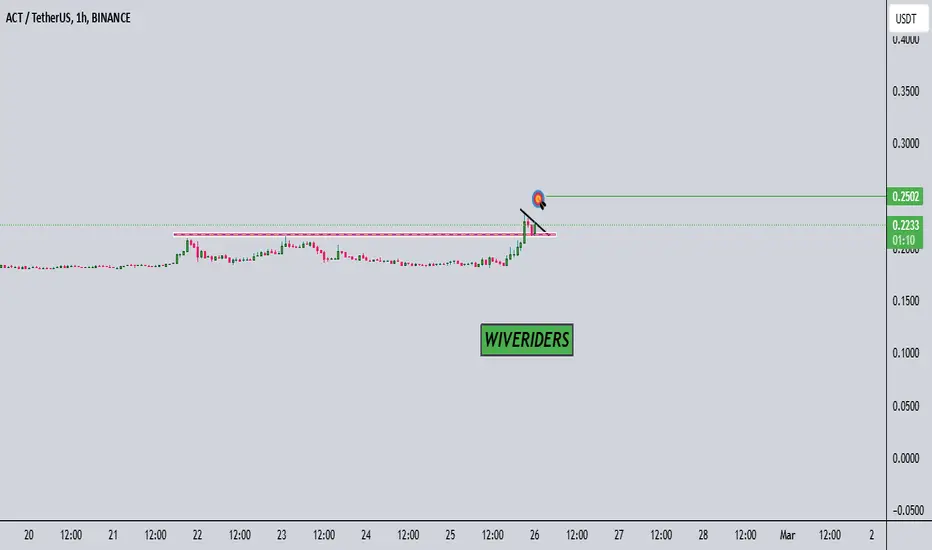
#ACT/USDT#ACT
The price is moving in a descending channel on the 1-hour frame and is expected to continue upwards
We have a trend to stabilize above the moving average 100 again
We have a descending trend on the RSI indicator that supports the rise by breaking it upwards
We have a support area at the lower limit of the channel at a price of 0.1923
Entry price 0.2150
First target 0.2240
Second target 0.2345
Third target 0.2488
ACTUSDT 1WACT ~ 1W Analysis
#ACT Buy after successfully penetrating this resistance line, with a short -term target of at least 15%+.
Reason, The seller's pressure seems to have been completed.
$ACT ANALYSIS!NASDAQ:ACT is testing the black resistance line ⚫.
✅ If breakout is successful, the first target is the green line level 🟩.
The Altcoins Market Is Bullish: Let's Get Started! (333% Pot.)Look at this, this is very interesting.
Bitcoin and the major Cryptocurrency projects (Altcoins) went through a major flush in the past few days. When Bitcoin flushes the smaller Altcoins tend to go through a major crash.
See the chart for ACTUSDT, no crash. Actually, today is full green with rising volume. The previous two days failed to produce a new low.
This is just one pair of course but it is still quite revealing. This is happening because the market is about to turn hyper bullish. Rather than breaking down many pairs will start to break-up as money will not leave the market but flow from one section to the next. The smaller Altcoins will offer the biggest possibility for growth.
Make sure to follow as we will go through hundreds of charts to see what the Cryptocurrency market has in store for us.
— Buy and hold.
— Focus on the long-term.
— Patience & we win!
Thank you for reading.
Namaste.
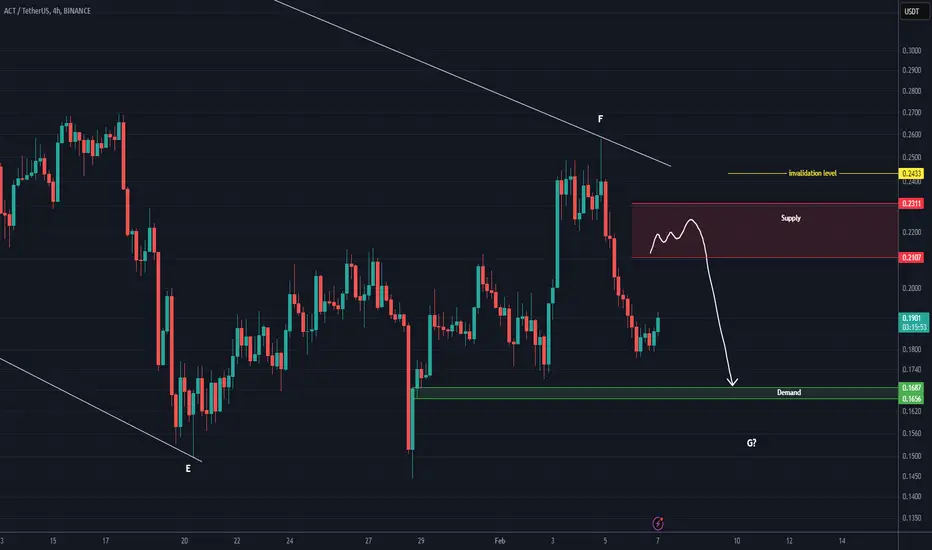
ACT ANALYSIS (4H)ACT is in a major correction. This correction is a large-degree diametric. It now appears to have entered the bearish G wave.
The price is pulling back into zones where sell orders exist to complete wave G.
A daily candle closing above the invalidation level will invalidate this analysis.
For risk management, please don't forget stop loss and capital management
Comment if you have any questions
Thank You
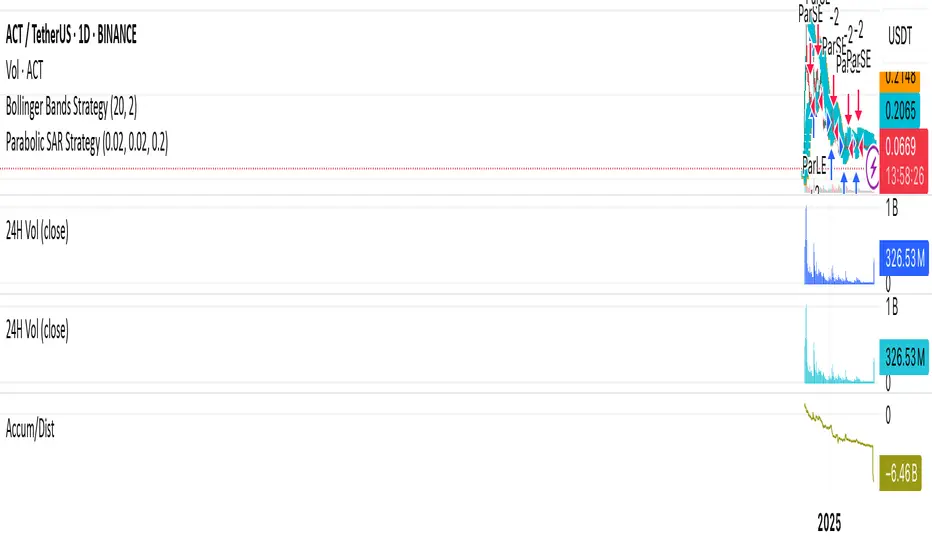
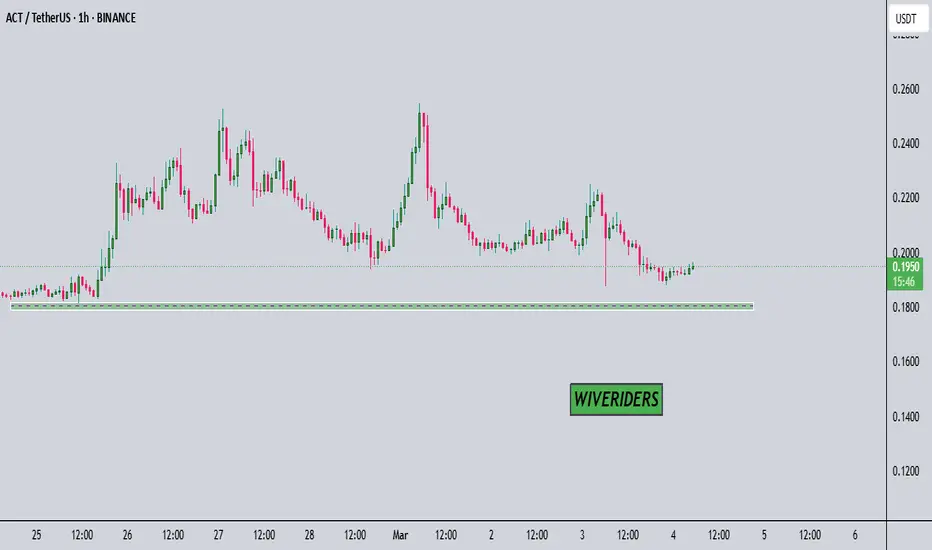
ACT ANALYSIS📊 #ACT Analysis
✅There is a formation of Descending Channel Pattern in daily chart. Currently #ACT is in bearish way.
After a breakout of the pattern and major resistance level we would see a bullish momentum otherwise the price will drop more 🧐
👀Current Price: $0.1968
⚡️What to do ?
👀Keep an eye on #ACT price action and volume. We can trade according to the chart and make some profits⚡️⚡️
#ACT #Cryptocurrency #Breakout #TechnicalAnalysis #DYOR

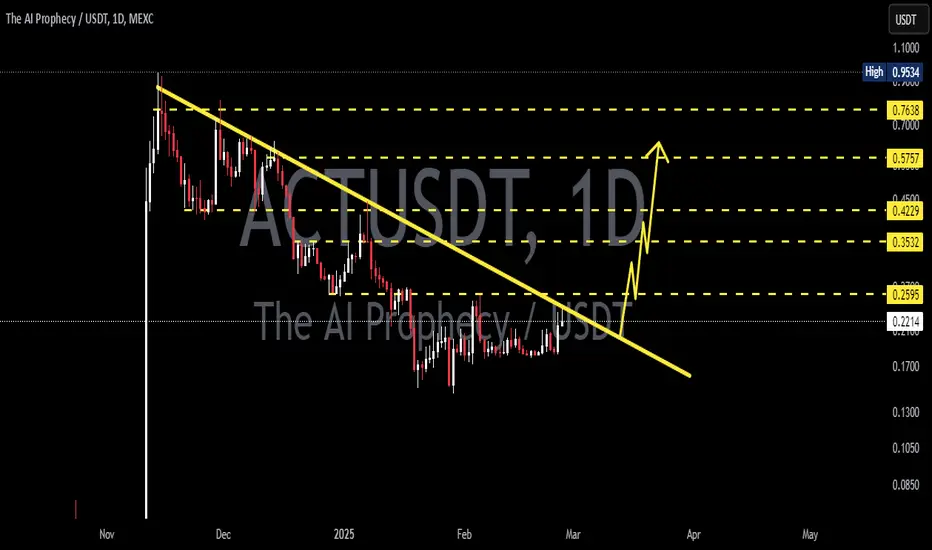
ACT USDT🚀 #ACT/USDT
NASDAQ:ACT is breaking out from a Falling Wedge pattern and currently retesting support 💁♂️
If the bullish momentum continues, the next targets are:
🎯 $0.45
🎯 $0.60
🎯 $0.80
🔥 A strong move is expected soon – keep an eye on this breakout! 🚀
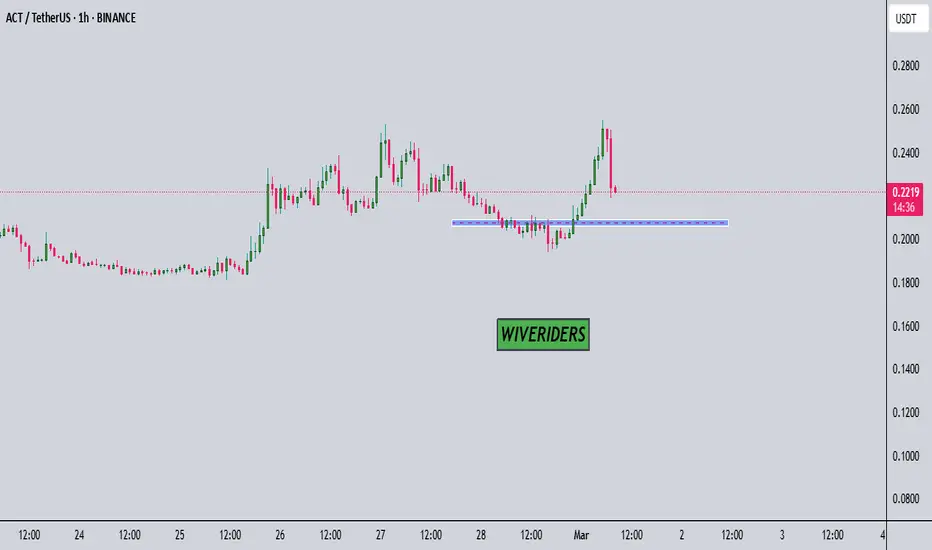
ACTUSDT → Attempting to change the trend BINANCE:ACTUSDT is trying to move into the realization phase after breaking through the resistance of the bearish wedge, a pattern capable of changing trends
After a prolonged downtrend, the coin has found a bottom in the 0.1500 area and yesterday's bitcoin recovery was a bullish driver for ACT. The market is pretty much confirmed manipulation by the US government and will have to come to terms with that.
Technically, the focus is on 0.21400 support. The key pattern to wait for is a false break of the support followed by a consolidation above the level and the start of an upside move. This would be a characteristic bullish maneuver that could lead to local strengthening.
Resistance levels: 0.26800, 0.35120
Support levels: 0.21420, 0.1500
For a trend change, the coin needs not only to consolidate above the support, but also to overcome the resistance at 0.26800. The altcoin market is weak, so there should be strong confirmations to open positions in one direction or another.
Regards R. Linda!
