ADA To $25.00Based on the fib reversal ADA could reach $25 first stop at the 141 fib level following the exit of the bullish triangle pattern.
ADAUSD.P trade ideas
BUY OPPORTUNITYInstrument: ADA/USD
Entry Price: $0.941
Stop Loss (SL): $0.831
Take Profit (TP): $1.178
Risk-Reward Ratio: 1:2
Technical Analysis:
50 EMA Support: As price approaches the 50 Exponential Moving Average (EMA), it is expected to act as support. This suggests that ADA/USD may find support and bounce higher from this level, leading towards your TP.
Strong Supply Zone at $1.206: The price is below a significant supply zone around $1.206, which could act as resistance. This means there is a higher chance of ADA reaching your TP of $1.178 before encountering further resistance.
Fundamental Analysis:
Positive Address Profitability:
60.9% of ADA addresses are in profit (2.68 million addresses).
34.95% of addresses are in losses (1.54 million addresses).
This indicates a predominantly positive market sentiment, with the majority of addresses currently seeing gains, which could indicate bullish momentum for ADA in the near term.
ADA's 70% Drop from ATH: Despite the price being down by about 70% from its all-time high, the profitability of ADA addresses remains strong. This signals that investors holding ADA may continue to support the price at current levels, further reinforcing the bullish bias in the short term.

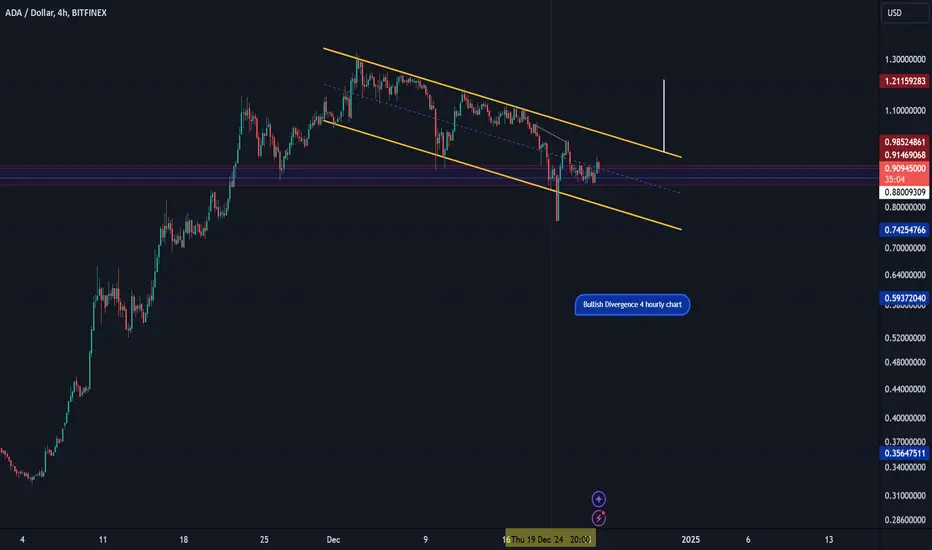
A simple Descending channel on ADA 4 hourly chartA breakout from this channel could push us back up to test the 1.20 range if bullish, if bearish we would be testing the .60 cent range
galactic punp coming to a wyomingcoin near youcharles will do charles things, lovelace will be still turning in her grave and alls right with the world
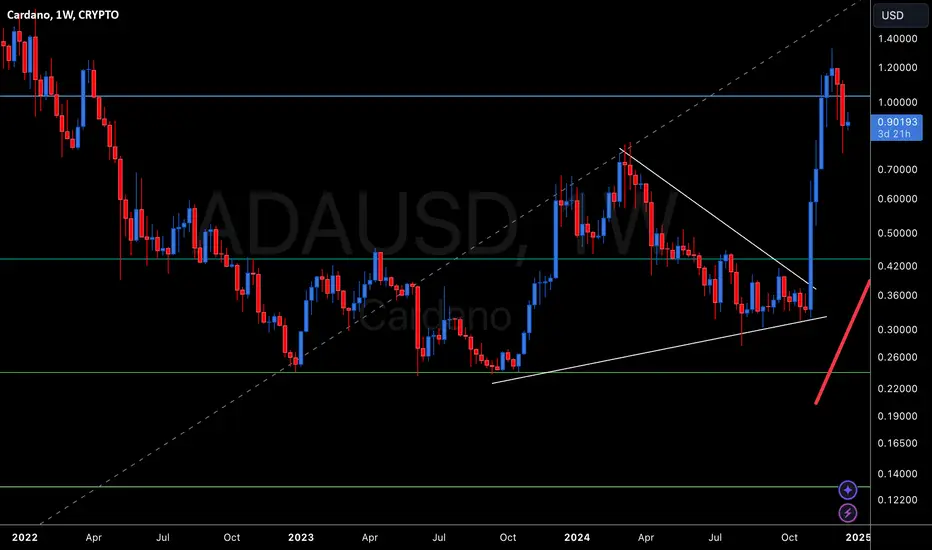
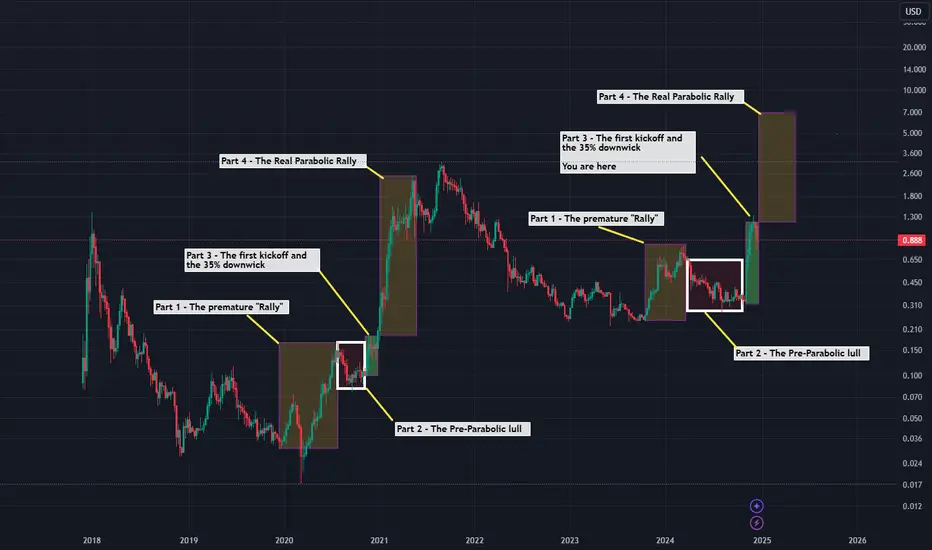
Last Cycle -> This CycleNo two cycles have ever been exactly the same and it remains to be seen if that will ever happen. Bitcoin has thus far demonstrated a certain amount of cyclicity and predictable behavior on a 4-year time scale that has been widely studied and written about. Given BTC's overall influence on the asset class, we'll make the assumption in this idea that ADA can also exhibit a certain amount of cyclicity and predictable behavior within a similar time period.
I'll start by defining 4, temporal 'parts'. From cycle to cycle they do NOT translate exactly and it's possible I'll look back in two years and realize I drew them wrong. Regardless of this, let's explore.
~~
Part 1 - The premature "Rally"
The rhetoric of "This time is different" and "We're going to see new ATH's next month" are particularly strong. This "Rally" usually starts towards the end of the pre-halving year or sometime early in the halving year. Positive USD price movements set the stage for a short staged, preliminary mania before the inevitable lull.
~~
Part 2 - The Pre-Parabolic lull
After seeing a 2x - 6x return from the cycle bottom, which is usually quite nice given years of mostly weekly red candles, a summer or late fall lull sets in.
The rhetoric of "Crypto is dead" and "It's never going to go up again" emerge.
The prior cycle, at least for ADA, appeared to be much shorter than this cycle's early new ATH ~6 months ago for BTC. Given bitcoin had a long cooling off period time year, it's not particularly shocking that ADA did as well.
~~
Part 3 - The first kickoff and the 35% downwick
Cue the US elections and like clockwork the asset class kicks off. BTC breaks 100k for the first time, ADAUSD skyrockets from ~$0.30 to ~$1.30.
IF YOU TAKE NOTHING ELSE FROM THIS POST AT LEAST CONSIDER THIS: ADAUSD, like ETHUSD, does not exactly have a great December track record during the halving year. Last Cycle, ADAUSD saw a -35% downwick from the local high to the local bottom. Ask yourself: Do you think this flushed some people out? Do you think some panic sold?
Nobody, not me, not anyone, knows where the USD valuation is going. I believe it's going to go higher but all I know for sure is that where we are now...December of the halving year...is behaving, overall, quite similar to December 2020. ADAUSD skyrockets to $1.30 and then wicks down to the $0.77 range.
~~
Part 4 - The Real Parabolic Rally
Cue the post-halving year which we are less than 2 weeks away from. In 2020, from the last week of December to the last week of February, ADAUSD rallies 834%.
834% in 8 weeks. And during this time, it printed 2 weekly red candles in the later half of Jan that sent the price down -34%. And then, at the start of March, it printed two more red candles that sent the price down -25%.
But the rally wasn't over because the USD valuation in the Spring of 2021 was still in the low $1's. It wasn't until the second week of May that ADA hit $2 for the first time and it wasn't until late August it hit $3.
~~~~~~~~~~~~~~~~~~~~~~~~~~~~~~~~~~~~~~~~~~~~~~~~
I believe the real parabolic rally hasn't start yet. I believe that if ADAUSD behaves similarly to how it did last cycle, we're going to have an exciting next 10 weeks, a cooloff in March+April, and an exciting start to summer.
There will be turbulence. There will be doubt. This is crypto, this is the nature of trading.
I suspect there will be weeks after a new local high is printed that we're all down 20%-40% and that's okay, it doesn't imply the end of the cycle.
~~
This isn't financial advice and this isn't investment advice, but now that we're still in the <$1.00/ADA it's probably worth determining what you want your exit strategy to be.
Good luck out there.
Second great opportunity for ADA, continuing its uptrendAs shown in the ADAUSD Weekly chart, the ADA price is approaching the 200 weekly MA (in blue), showing for a second time that we might continue the weekly uptrend from this point.

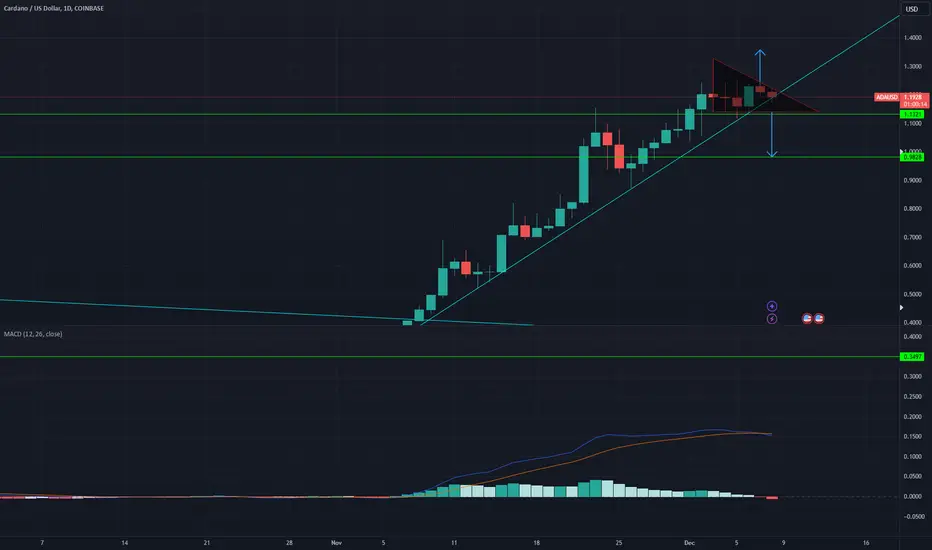
Possible head and shoulders. My previous chart predicted a bearish divergence and this played out. Now there is a possible head and shoulders forming. However, Cardano does appear to be showing strength and this may be invalidated soon. I think it wholly depends on BTC movements. Right now BTC just hit a new ATH and the market followed this. I think ADA is showing strength in the RSI. Key support is 1.15, I think ADA does have the strength to reach this and hold it. Only time will tell, market is neutral in my eyes right now.
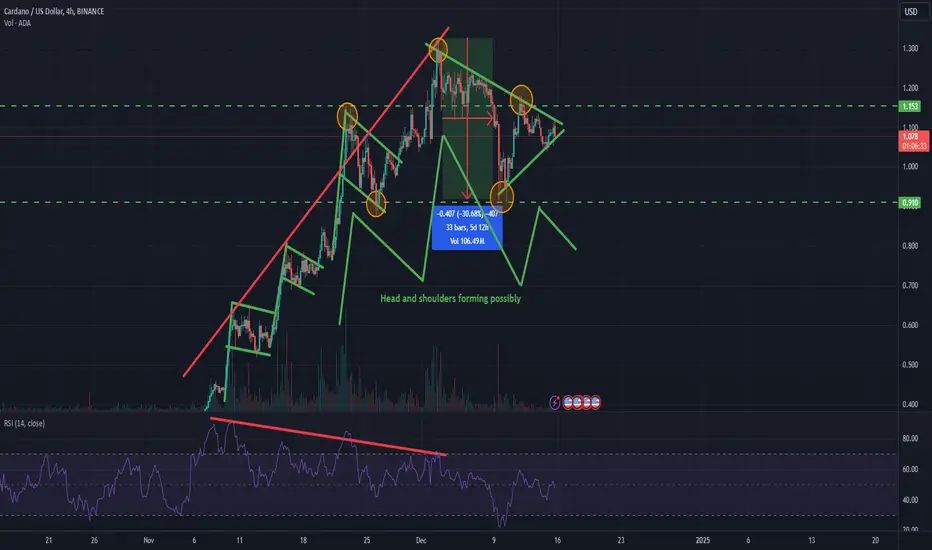
Cardano Head and Shoulders "ADAUSD"
Cardano Head and Shoulders target of 0.53-0.62 on the daily timeframe is being confirmed today.

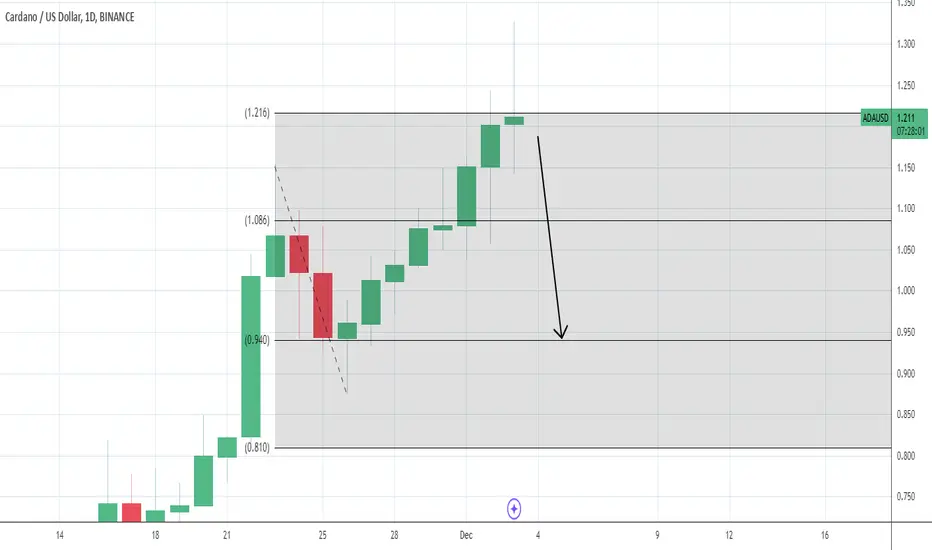
CARDANO - Sell Idea (Short-term)The pullback below 1.2150 is a strong indication that price action is gearing up for a downside reversal on the short-term scale at the very minimum. A quick move south towards the local key-level support at 0.9400 is very likely at this stage. We're firing off a new short position. Stay tuned...
ADA ChartingHead and shoulders pattern detected here on the day chart, should see large support line bounce at 0.91$ USD . Upside after that will be recharted lots of potential looking for a bounce here

Cardano - Starting The 10x Parabolic Rally!Cardano ( CRYPTO:ADAUSD ) is perfectly following the break and retest:
Click chart above to see the detailed analysis👆🏻
With an incredible +200% pump in November, Cardano is finally coming back to life after creating the bullish double bottom break and retest just a couple of months ago. Looking at previous cycles, this seems to be just the beginning of another +3.000 rally.
Levels to watch: $3.0, $10.0
Keep your long term vision,
Philip (BasicTrading)

update on adawe are still in a channel to take us down to c-wave if ada goes over 1.15 pattern has failed
Cardano Trading ideaCardano Trading idea
New idea for cardano im thinking that it could drop by alot


Cardano / ADA FIB targetsThis is a log chart for Cardano if this plays out, we are looking at about a 7x from current levels, with a high somtime mid 2025. Then pullback/cooloff and go to next crypto bull run.

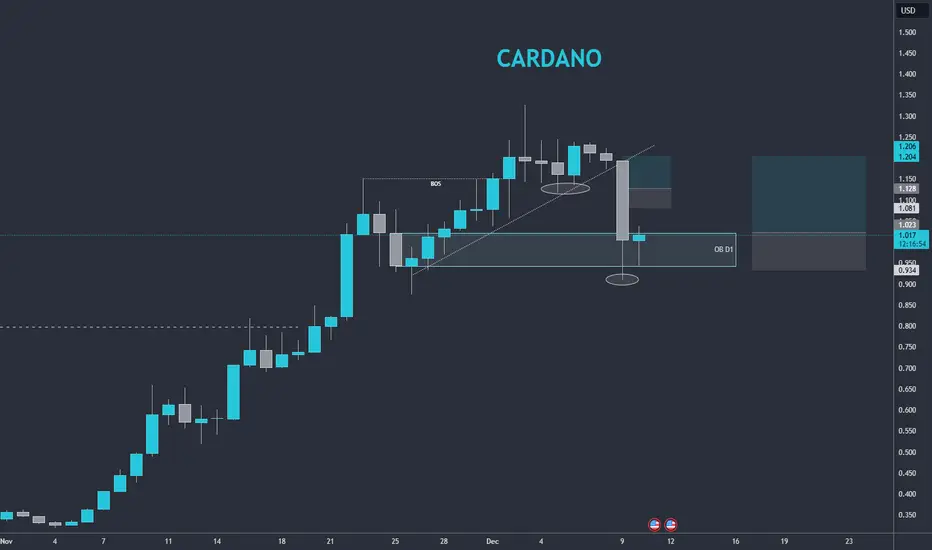
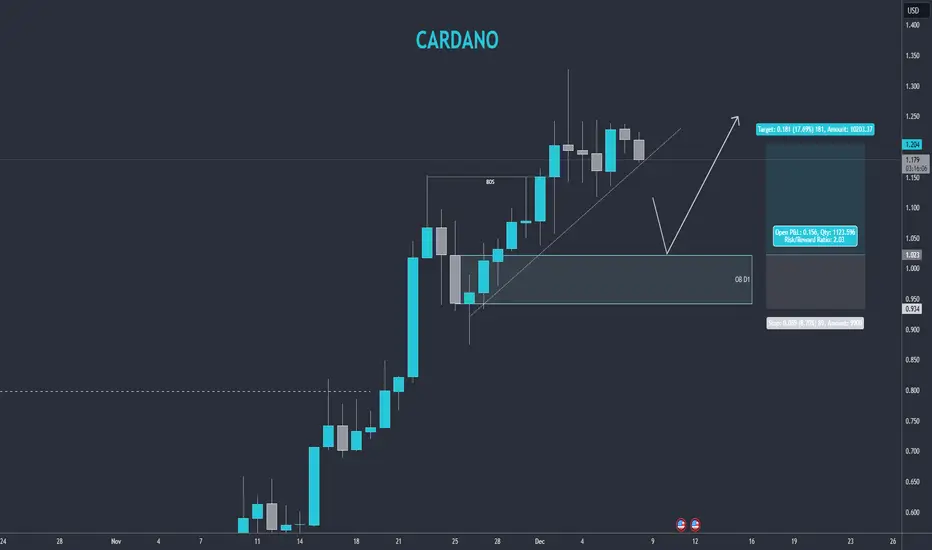
CARDANO D1Please see what happen here, beyond we followed the plan yesterday a deep sweep liquitidy was made and taken out our trades from the market. That is why it is very important to alway do a very good risk managemente to avoid big losses and keep playing the game
ADA could increase its price in (+90%)ADA is looking very strong to keep climbing up, if it can manage to close a weekly candle above $1.212 would suggest good momentum to reach the $2 region. It tested the anchored vwap at $0,95 and held it. The target is between fibonacci retracement levels, point of control and value area low from the last bull run highs.
TARGET: $1.976 to $2.152 up to (+90%)

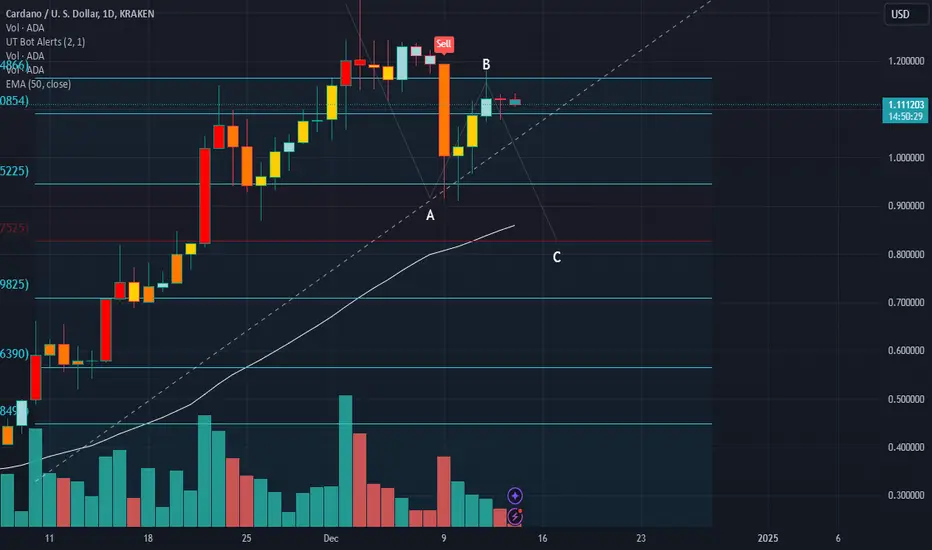
Cardano in a C wave?Tell me, are we in a bullmarket or still correcting. Could be backtesting super low. Let me know what you think

Break down or break out?There is a higher chance of breaking down with a bearish MACD cross on the daily chart. What do you think?
CARDANO H4Trading setup for H4.
We know a mayor OB zone is a little more down, at there it is more probable price react looking for liquidity.
A little more risky entry could be at this H4 zone
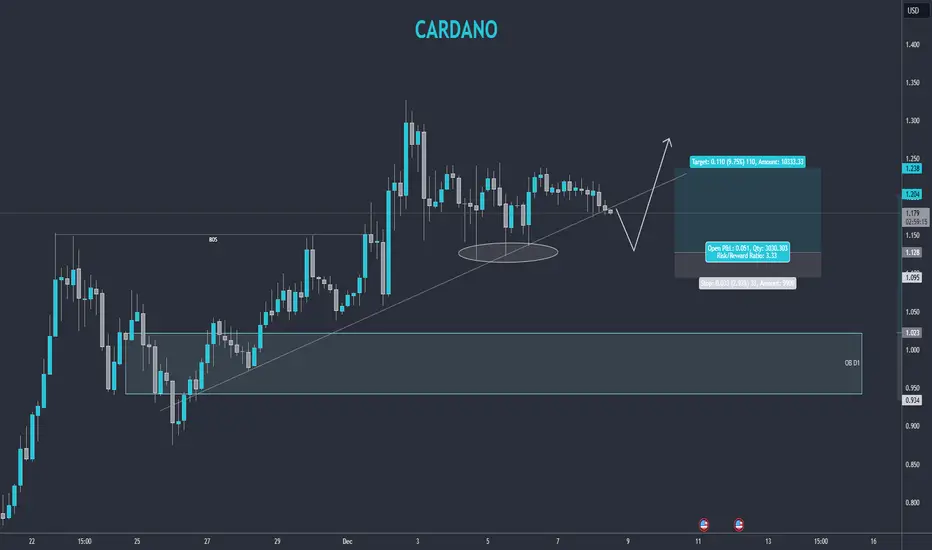
CARDANO D1 Trading idea for Cardano in D1:
- Wait the price pullback to mayor OB zone
- Looking for 2:1 ratio
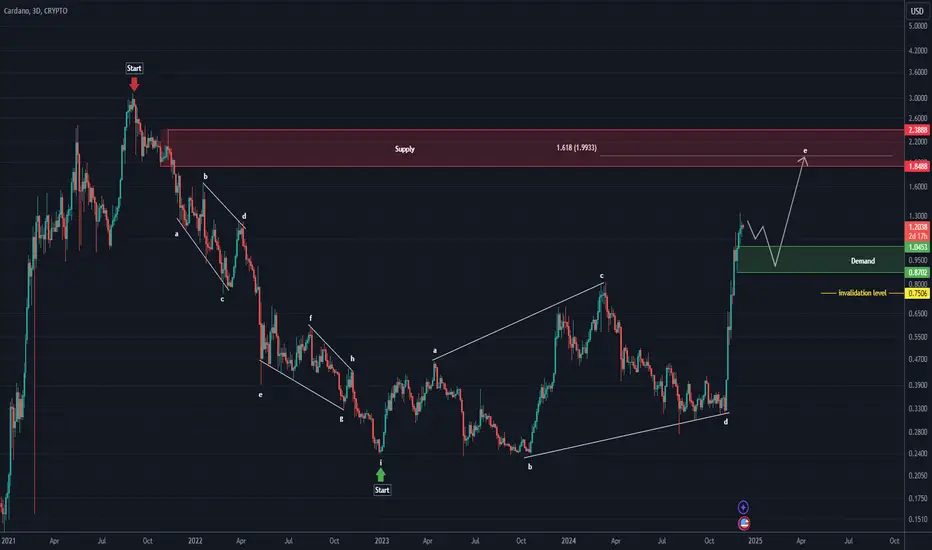
Where does ADA stand currently?From the point where we placed the red arrow on the chart, Cardano's correction began, and from the point where we placed the green arrow, Cardano's bullish pattern started.
The correction appears to be a symmetrical one, while the new bullish pattern seems to form an expanding triangle.
From the green zone, Cardano may potentially move upward again to complete wave E.
Closing a daily candle below the invalidation level will invalidate this analysis.
For risk management, please don't forget stop loss and capital management
Comment if you have any questions
Thank You
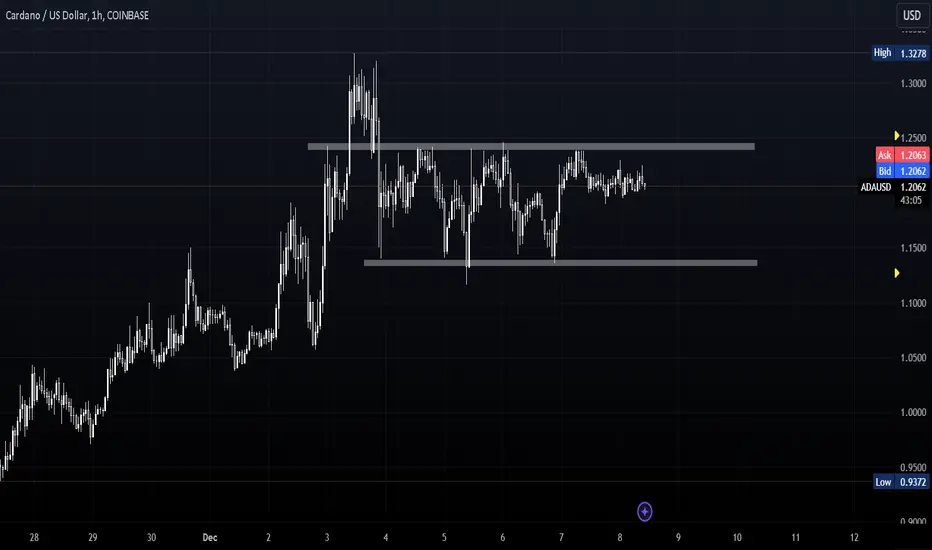
CRYPTO: ADAUSD trading plan. This is a trade I am currently looking at. I would be taking a LONG position if the price breakthrough the upper rectangular box and a SHORT position if the price breakthrough the lower rectangular box . Currently, I am more interested on the Long position. However, this is only a plan. Please take note that trading is about dealing and respecting the market trend. I do not make predictions.