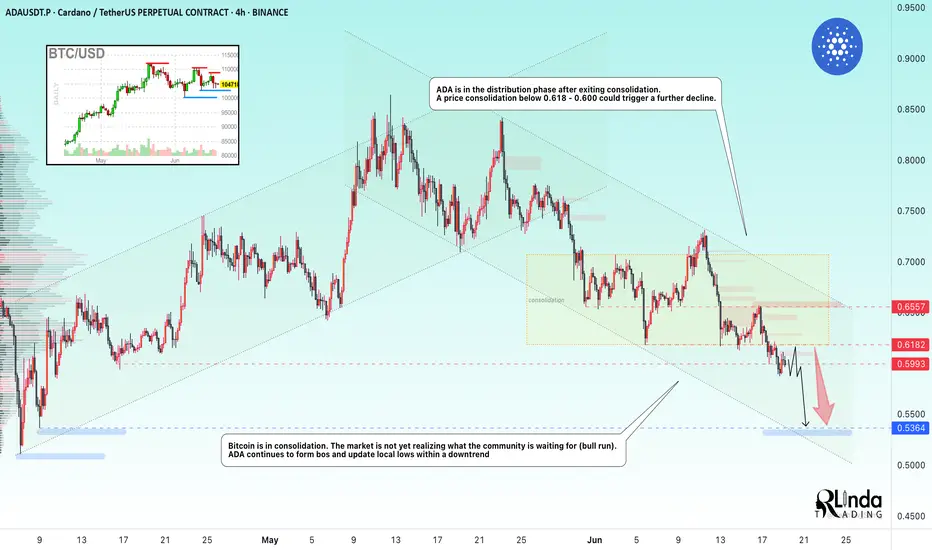
ADAUSDT → Bear market. Support breakdownBINANCE:ADAUSDT.P is in the distribution phase after exiting consolidation. The coin continues to update local lows within a downtrend.
Technically, the cryptocurrency market is in stagnation/correction, as there is no bullish driver yet. Bitcoin is currently consolidating but continues to sho
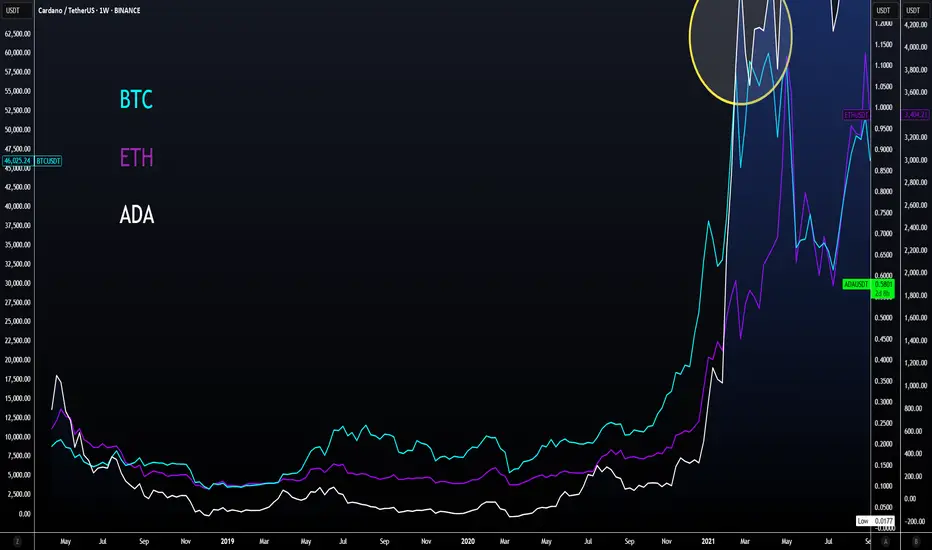
ADA | BTC | ET | Why ALTSEASON is COMING SOONAfter a -34% retracement, ADA is ready to go higher alongside with the rest of the alt market.
We see a very interesting phenomena here, were ADA also represents a large part of the larger alts: BTC pulls back, ETH is starting to increase or trades sideways (before the increase) whilst the alts di
DeGRAM | ADAUSD above the demand zone📊 Technical Analysis
● ADA is testing the confluence of the long-term support line and the 0.54-0.63 demand zone; every prior touch of this area sparked a 20-30 % rebound.
● A falling wedge within the broader descending channel is close to completion; a 16 h close above the wedge roof (~0.66) acti
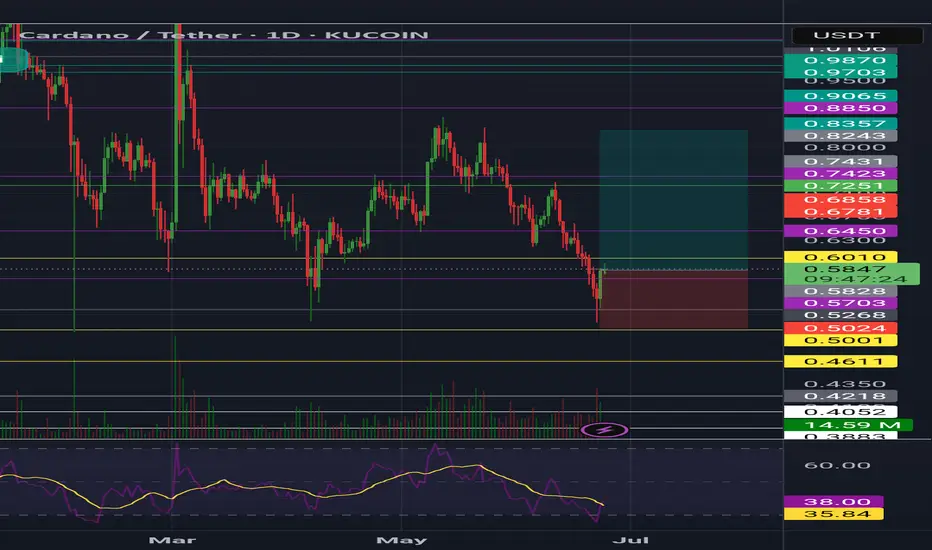
ADA/USDT SHORT SETUP | 4H STRUCTURAL BREAK & LIQUIDITY GRABAfter a confirmed structure break to the downside on the 4H chart, ADA appears to be retracing toward the previous demand zone, now acting as a potential supply/mitigation area.
📌 Idea Overview:
Price is expected to revisit the 0.5921 – 0.6167 range, which aligns with the last broken order block. T

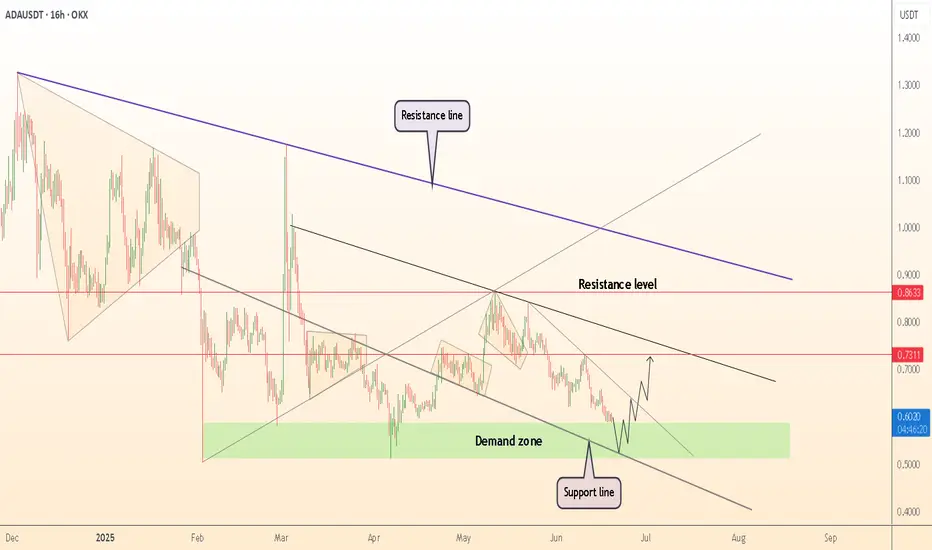
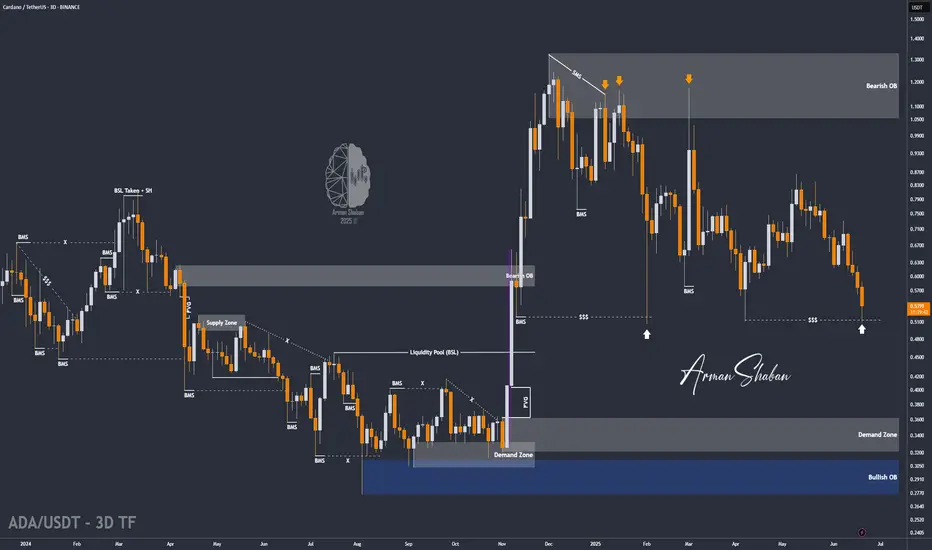
Cardano Correction or Opportunity? (READ THE CAPTION)By analyzing the #Cardano chart on the 3-day timeframe, we can see that after reaching 73 cents and amid rising war tensions, the price started a correction along with the broader crypto market. This correction has now brought ADA to attractive zones for potential laddered buying and long-term inves
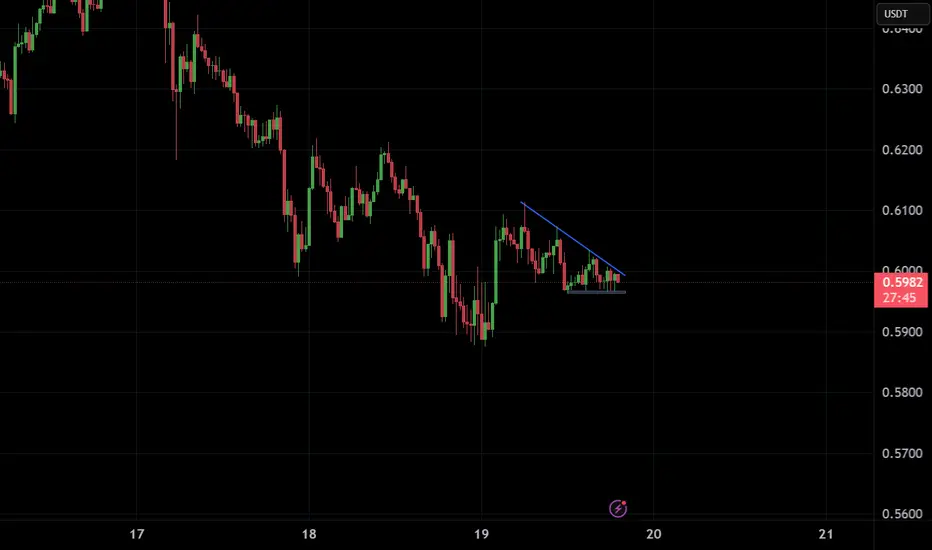
SHORT Idea on CARDANOThe 0.6020 level has been recently broken and retested. This is a clear confirmation that price has accepted this level as a new resistance and should continue pushing lower .
My target is 0.5688
SL : 0.615

ADAUSDT IDEAlower lows and a flat. Seems to be a trade opportunity which ever side it goes off breaking its current structure.
HolderStat┆ADAUSD retesting of the $0.6 levelBINANCE:ADAUSDT is orbiting the major $0.6000 shelf inside a fading down-channel. A lift through 0.63-0.64 would flip short-term momentum and open a swift path toward the mid-$0.70s, while a daily close below $0.58 cancels the run-up thesis 📈

CardanoAda usdt Daily analysis
Time frame daily
Risk rewards ratio >3 👈👌
Double bottom pattern has been created
Cardano Wave Analysis – 23 June 2025- Cardano reversed from the support area
- Likely to rise to resistance level 0.6000
Cardano cryptocurrency recently reversed from the support area between the long-term support level 0.515 (which has been reversing the price from November of 2023) and the lower daily Bollinger Band.
The upward re

See all ideas
Summarizing what the indicators are suggesting.
Oscillators
Neutral
SellBuy
Strong sellStrong buy
Strong sellSellNeutralBuyStrong buy
Oscillators
Neutral
SellBuy
Strong sellStrong buy
Strong sellSellNeutralBuyStrong buy
Summary
Neutral
SellBuy
Strong sellStrong buy
Strong sellSellNeutralBuyStrong buy
Summary
Neutral
SellBuy
Strong sellStrong buy
Strong sellSellNeutralBuyStrong buy
Summary
Neutral
SellBuy
Strong sellStrong buy
Strong sellSellNeutralBuyStrong buy
Moving Averages
Neutral
SellBuy
Strong sellStrong buy
Strong sellSellNeutralBuyStrong buy
Moving Averages
Neutral
SellBuy
Strong sellStrong buy
Strong sellSellNeutralBuyStrong buy
Displays a symbol's price movements over previous years to identify recurring trends.