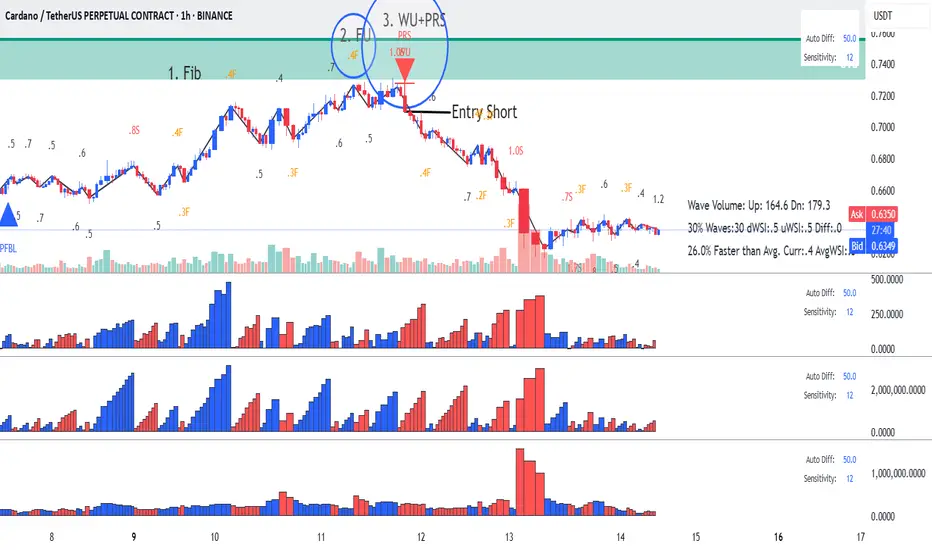
Wyckoff Up-Thrust - This is how to identify using Speed indexClassic Wyckoff Up-Thrust formation, this is how to read it using Speed Index (annotations in sync with the chart):
1. Fib Area - this is where sellers might come in
2. FU - Fast Up wave with SI 0.4F
3. Next up wave with an abnormal SI of 1.0S while the average speed at 0.5, which means price has a hard time to move up (more sellers on the up move). Following the up wave on the down move we have double Short signals WU-Wyckoff Up-Thrust and PRS-Plutus Reversal Short and this where we enter.
I hope this was helpful. Enjoy!
ADAUSDT.P trade ideas
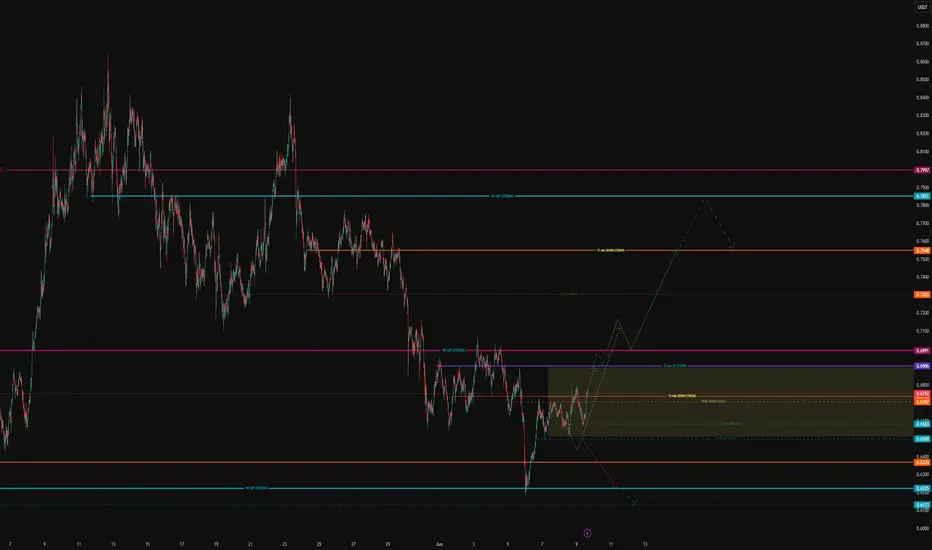
ADA/USDT – Decision Zone & Probabilities (Zarvān Tools)🔰 ADA/USDT – Strategic Analysis (Spring 2025)
Powered by Zarvān | Dynamic Field S/R Engine
ADA/USDT is now trading inside a crucial decision zone, highlighted by the golden background on the chart. This area marks a period of market indecision—typically a precursor to a strong breakout move in either direction.
Key Technical Levels:
Dynamic Support: 0.6580 – If this level fails, watch for the next support at 0.6430, and, in extension, 0.6225.
Dynamic Resistance: 0.6991 – This is the key short-term resistance. A confirmed breakout here opens the path towards 0.7540 and potentially 0.7851.
Major Resistance: 0.7997
Potential Scenarios:
Bullish Outlook:
Should ADA/USDT decisively break and hold above 0.6991, a rapid move towards 0.7540—and possibly higher to 0.7851—is on the table. (Green projection on chart)
Bearish Outlook:
Conversely, losing the 0.6580 support level could trigger a drop to 0.6430, then 0.6225. (Red projection)
What Makes This Analysis Unique?
This forecast is built upon a suite of proprietary Zarvān indicators, not available to the general public. These include:
Zarvān | Dynamic Support & Resistance (Divergence-Based)
A smart, adaptive S/R system built on divergence, structural bias, and market energy—not simple pivots or Fibonacci retracements.
Zarvān | Composite Field Engine
Measures “hidden field energy,” imbalance, and latent reversal potential using a layered logic unique to the Zarvān methodology.
Zarvān | Adaptive Reversal SmartView
Detects nuanced phase transitions, emerging reversals, and the “pulse” of the trend—well before classic indicators react.
MACD-Zarvān (Normalized)
An advanced, context-aware MACD, normalized and dynamically weighted by field conditions for vastly improved divergence detection.
Why Trust These Tools?
Noise Resistant: Zarvān indicators filter out “fake” moves and sideways traps, reacting only to truly significant field events.
Energy-Focused: Rather than just price or volume, they assess the interplay of forces behind every market move.
Signal Selectivity: Alerts are only generated when the underlying field energy and trend conditions truly align.
Practical Takeaway:
While price remains inside the highlighted decision zone, patience is advised. A confirmed breakout in either direction, validated by Zarvān indicators, can offer high-quality trading opportunities.
Set alerts at the levels above and wait for a clean setup.
Probability Outlook:
Given the current market structure and the price’s position within the decision zone, the probability of an upward move is slightly higher at this point. Both bullish and bearish scenarios remain valid, but recent price action—together with subtle positive divergence signals detected by proprietary Zarvān indicators—shifts the balance modestly in favor of the bulls.
At present, I estimate the odds at roughly 55% bullish versus 45% bearish.
This analysis is powered by Zarvān Field Intelligence. Our indicators are proprietary and developed exclusively for advanced phase-field market research. Please do not redistribute or copy our logic without permission.
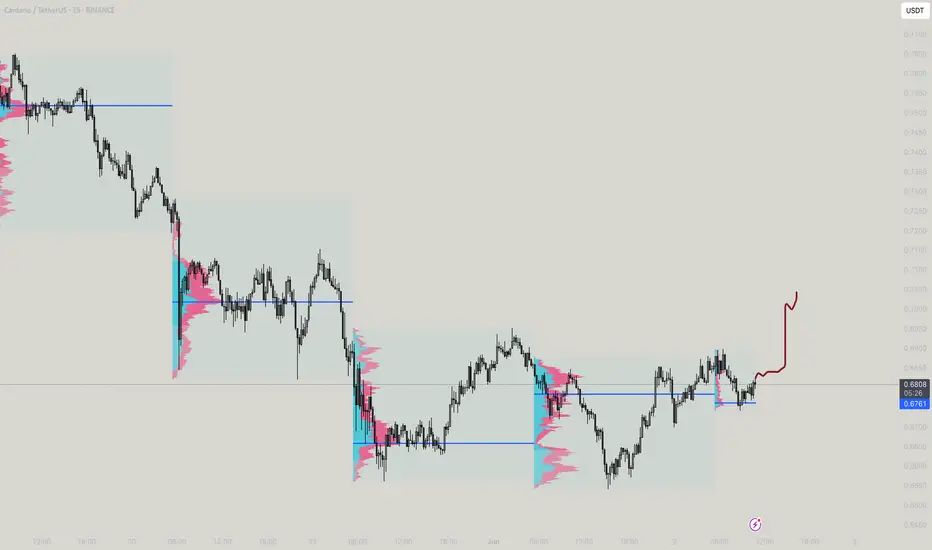
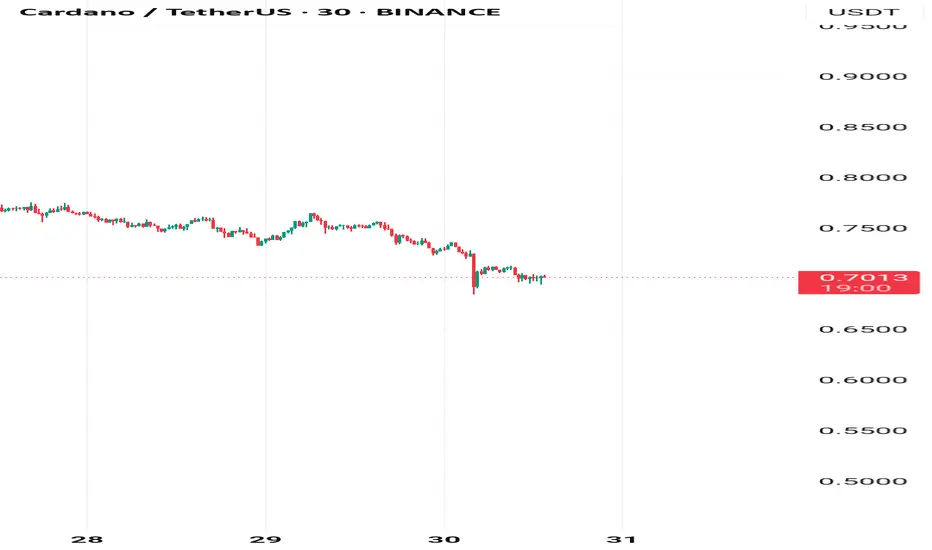
ADA/USDTADA is currently in a local consolidation phase.
After a liquidity grab/manipulation sweep, we can start watching for long opportunities.
🎯 Upside target: $0.68 – $0.69
📊 Waiting for confirmation post-manipulation to trigger entries. Patience is key — setup is forming.

HolderStat┆ADAUSD coiled for new highsCRYPTOCAP:ADA has printed boxy consolidations, respected its rising base and survived a sharp pullback; price now rests on ascending support. With prior “new highs” still warm and trendline resistance nearby, the setup flags a rebound toward 0.78 amid persistent bullish price action.

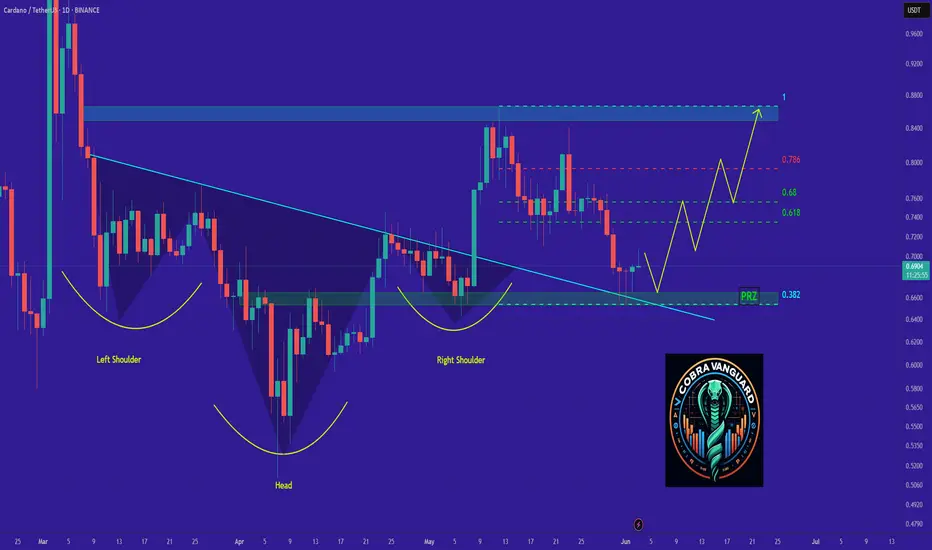
ADA's situation+ Target PredictionWhat I see now is that the price could correct to the PRZ and then pump again, and currently, there is no specific bullish pattern in the chart. which could cause the price to drop below 65 cents .
Best regards CobraVanguard.💚
ADA is going to catch big targetsWe are currently experiencing a Wave 2 correction after completing an impulsive Wave 1. Once the ABC correction is complete, we can expect to enter an impulsive Wave 3. As time goes on, if it seems like we are entering Sub-Wave 1 of Wave 3, I will publish an idea to outline new targets. For now, we should anticipate new movements in the market.

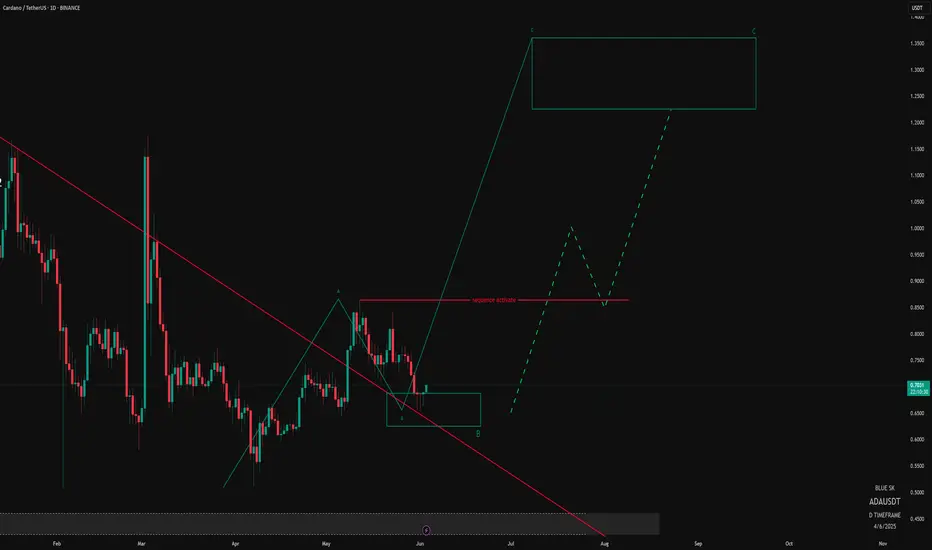
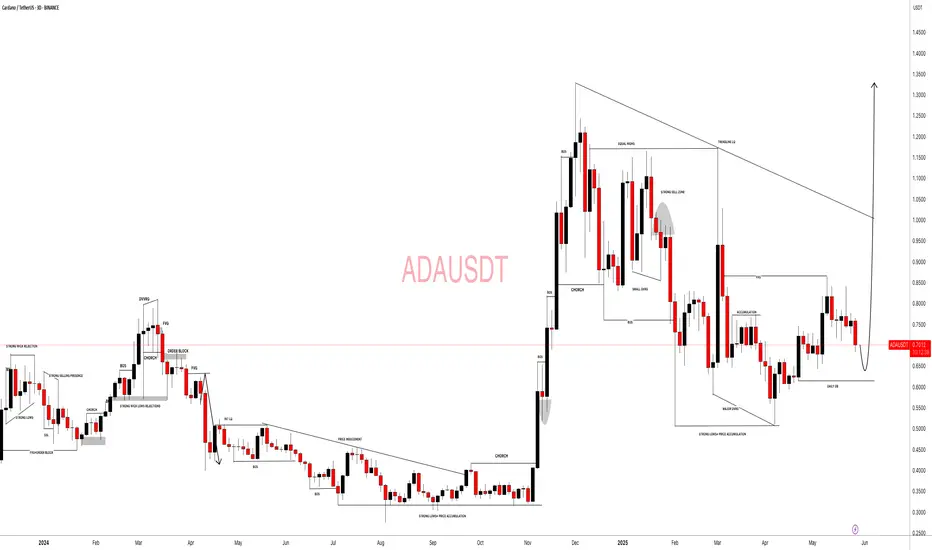
ADA TO # 1.22/1.36After reaching the (BC) area, which represents the reversal point or base in the (SK) system, we see a sequence formation with excellent buying targets after activation. Good luck.
Is it time to buy Cardano?Hello friends
According to the analysis and review we conducted on ADA, we reached almost definitive results:
This currency has fallen, which has caused the price to reach important and fundamental supports, and here we can buy in steps at the supports, depending on the level of risk and our capital management, and move with it to the specified goals.
*Trade safely with us*
Is Cardano the boss??A small scalp in ADA can change your life,! Look pennant will be made, a fall will be done, and then a spring up as stated
Buy ### Important and main block order ### can cause a return and reaction to the level. ### In the low time frame, wait for the first ceiling to break and trade when hitting the block!!!! ###buy ###choch

ADAUSDTBINANCE:ADAUSDT shows potential for an upward movement towards the targets of $1.3378 and $1.6435, making the current price zone attractive for long-term investment . While a correction towards $0.6453 or even $0.5803 is possible, these levels present favorable buying opportunities for investors with a long-term perspective. Even if a deeper correction occurs, the market geometry suggests that reaching the aforementioned targets is a likely outcome.

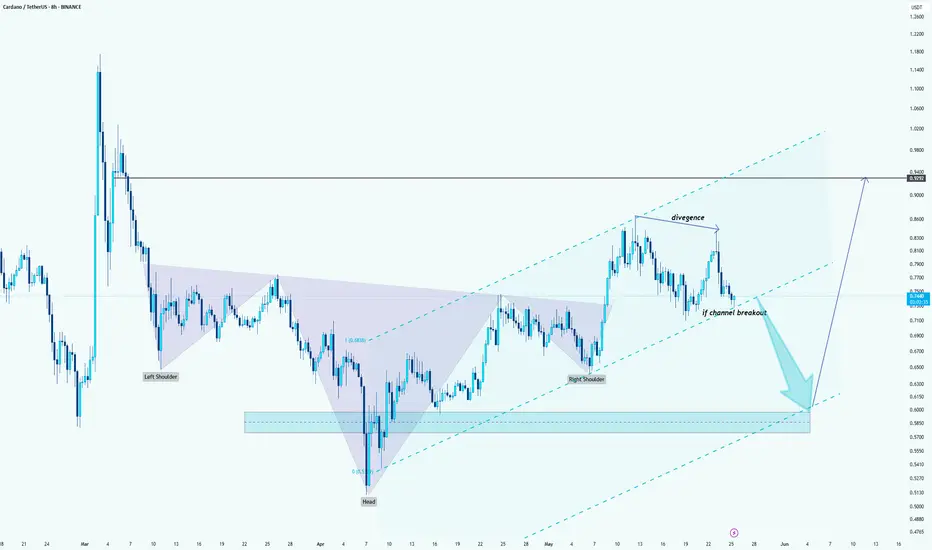
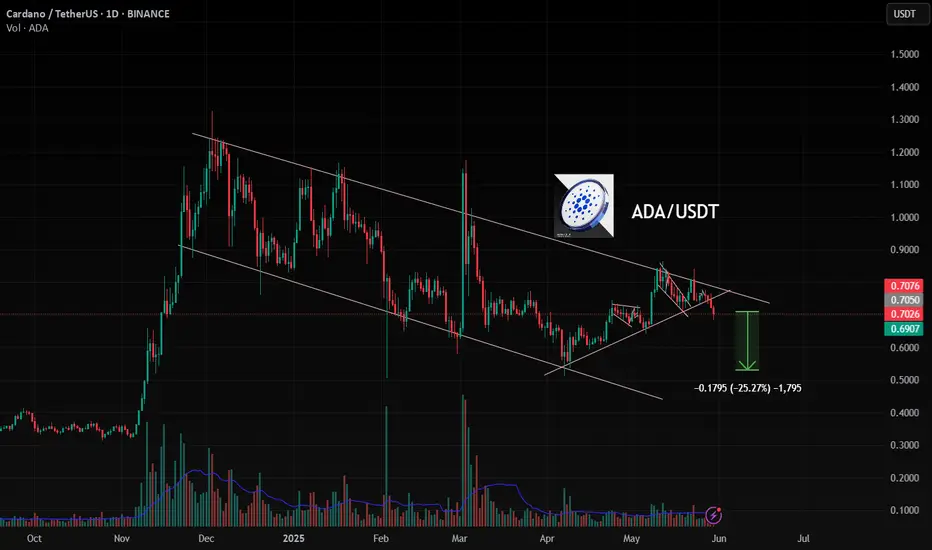
Bearish Divergence Warning: Will ADA Break the Channel?Hello guys!
Cardano has been trading within a rising parallel channel after forming a clear Inverse Head and Shoulders pattern, triggering a bullish breakout. However, recent price action has shown signs of weakness, especially with a noticeable bearish divergence between the price and RSI.
What I see:
The price is approaching the lower boundary of the ascending channel.
A channel breakout to the downside could lead to a deeper correction toward the $0.58–$0.62 support zone (highlighted area), which aligns with previous consolidation and the neckline of the inverse H&S.
If bulls defend the channel and push price higher, a potential rally toward the $0.93 resistance level remains in play.
⚠️ Keep an eye on the channel support and RSI behavior to anticipate the next move.
ADA SHORTReasons for the decline. 1- Strong weekly bearish candle - Liquidity and order block with the aim of buying have been identified - RSI is at the low 50 and moving average. My good friend, I would be happy if you could criticize or confirm my analysis.

Ada might just be forward to short Intermediate BSL taken and price structure broken further to the down; Ada might be better looking to fill the FVg after the displacement to the downside for a bearish continuation.

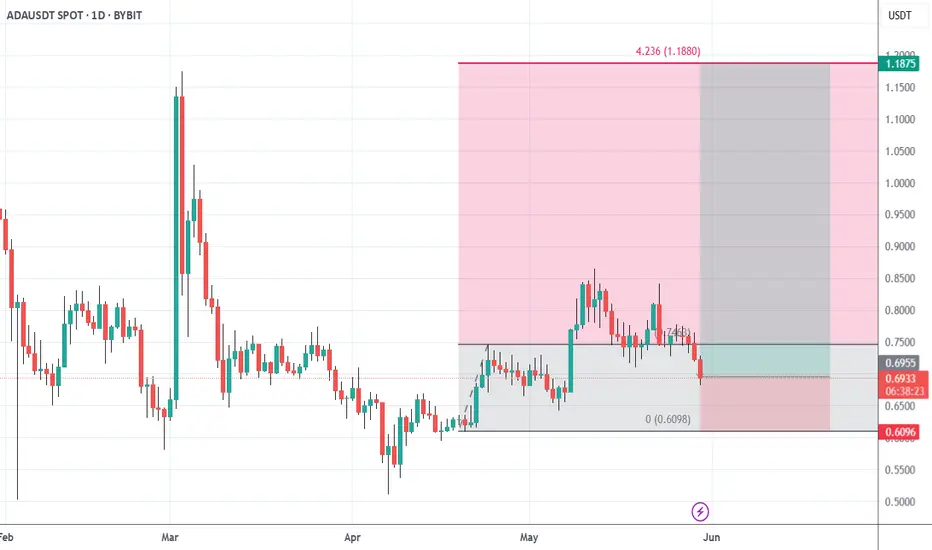
ADA/USDT: Potential Long Setup from Key Support ZoneTaking a closer look at a potential long opportunity on Cardano (ADA/USDT) with the following parameters:
Entry: Around $0.6938
Stop Loss: $0.6098
Take Profit: $1.1880
Technical Breakdown:
ADA is currently interacting with a critical price zone between $0.6800 and $0.7200. This area has demonstrated historical relevance, acting as both support and resistance in recent months, notably providing a floor for price action through mid-May. My entry anticipates this zone will once again attract buying interest after the recent pullback.
The stop loss at $0.6098 is strategically placed below the significant swing low established in late April. A breach of this level would likely invalidate the current market structure and could signal a more profound bearish continuation.
The take profit target at $1.1880 aims for the prominent highs last seen in early March. This ambitious target reflects an expectation of a strong recovery and implies a potential shift in momentum, possibly fueled by a confluence of technical strength and positive catalysts. The risk/reward ratio here is compelling, sitting near 5.8:1.
Fundamental Watch:
Keep a keen eye on Cardano-specific news. Developments in their ecosystem, progress on roadmap milestones like Voltaire or Hydra enhancements, or significant partnership announcements could provide the necessary bullish impetus for such a move. As always, broader market sentiment will also play a crucial role.
ADAUSDT: Targeting $1.5 Long Term Swing View| Comment Your View|Hello everyone,
The cryptocurrency price is approaching a major bullish zone where it is anticipated to reverse. Price momentum has been slightly bullish in recent times, possibly due to the release of economic data that is against the US Dollar. A weak US dollar has recently influenced the cryptocurrency market volume, resulting in all-time highs. We anticipate similar or increased volume in the future.
We would appreciate your support by liking and commenting on your views about the cryptocurrency pair. Please let us know in the comments if you would like us to analyse any other cryptocurrency or trading pair.
Best regards,
Team Setupsfx_
Daily tf confirmed strong bearish trend!As i said in previous idea for BINANCE:ADAUSDT the daily tf confirmed strong bearish trend and it will continue till reach 0.4$!
ADA , 1DAs BTC is Falling And BTC is given Breakout of Pattern in 4Hr , then Remaining coins will also fall drastically .
in 1D pattern of ADA USDT , it is Breaking Down as BTC is also given Break Down of Pattern
Follow for More Ideas like This
HolderStat┆ADAUSD above the $0.72 levelCRYPTOCAP:ADA broke the falling channel, replaced by a higher-low structure; consolidation near 0.75 sits atop trendline support. Maintaining 0.65 keeps bulls in control for a push toward the 0.90 resistance band flagged above.

ADA is getting ready to fly.The cup pattern is forming. If Alt Season takes hold, many of the major altcoins will take over the market liquidity.

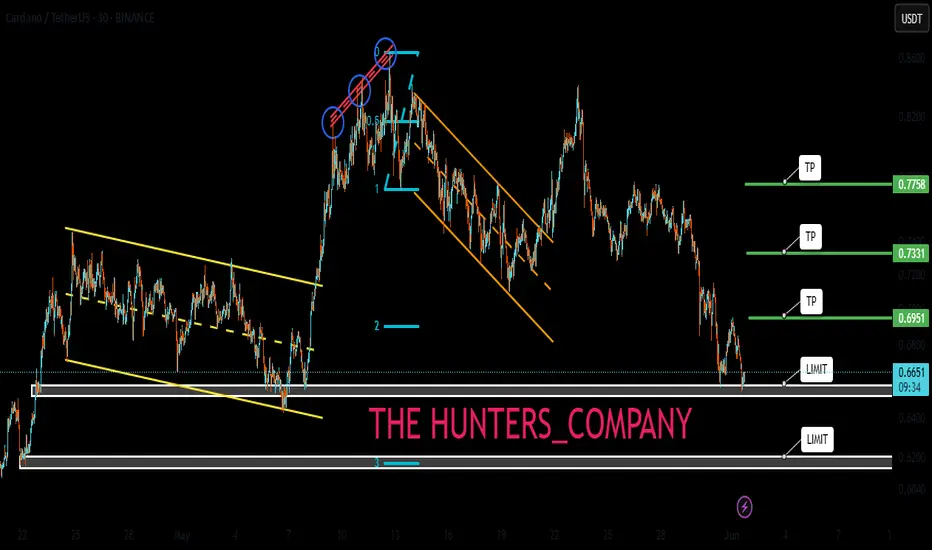
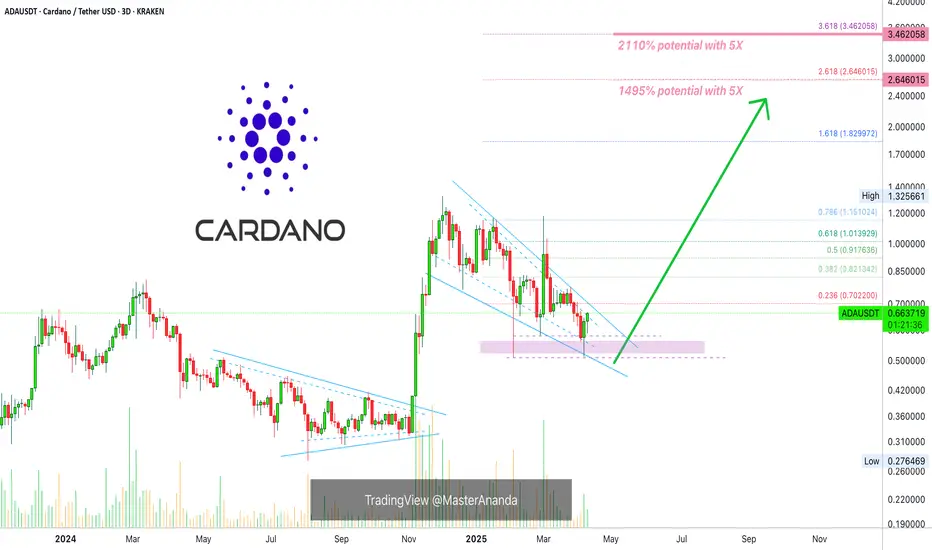
Cardano 5X Lev. Full PREMIUM Trade-Numbers (PP: 2110%)I want to share a trade setup that looks really good. It has relatively low risk with a very high potential for reward. The low risk is not based on the amount of leverage but the chart itself.
Notice the low 3-Feb., there is a higher low 7-Apr.
If you can open a position that is safe above the 3-Feb. low, then this would a low risk position and can work for the long-term.
The falling wedge pattern and the two green candles are also great. The previous session and the current active session.
Since we already looked at Cardano in detail, let's focus on the full trade-numbers for this chart setup. Most of the targets should hit within months.
_____
LONG ADAUSDT
Lev: 5X
Current price: $0.6637
Entry levels:
1) $0.6800
2) $0.6300
3) $0.6000
4) $0.5710
Targets:
1) $0.7000
2) $0.8213
3) $1.0130
5) $1.1508
9) $1.8300
12) $2.6500
13) $3.4620
Stop-loss:
Close weekly below $0.5600
Potential profits: 2110%
Capital allocation: 5%
_____
This chart setup can also be approached with 3X since it is already moving.
The amount of leverage you use will depend on your own risk tolerance.
Leveraged trading is high risk. High potential for rewards but also very high risk. This is a game not for kids. This is for adults. Mistakes can result in a major loss. Good decisions can result in big gains.
If you enjoy the content, consider hitting follow and leaving a comment.
Boost also to show your support.
Thank you for reading.
You are appreciated.
Your support is appreciated.
I am here working for you for the long-term.
Namaste.
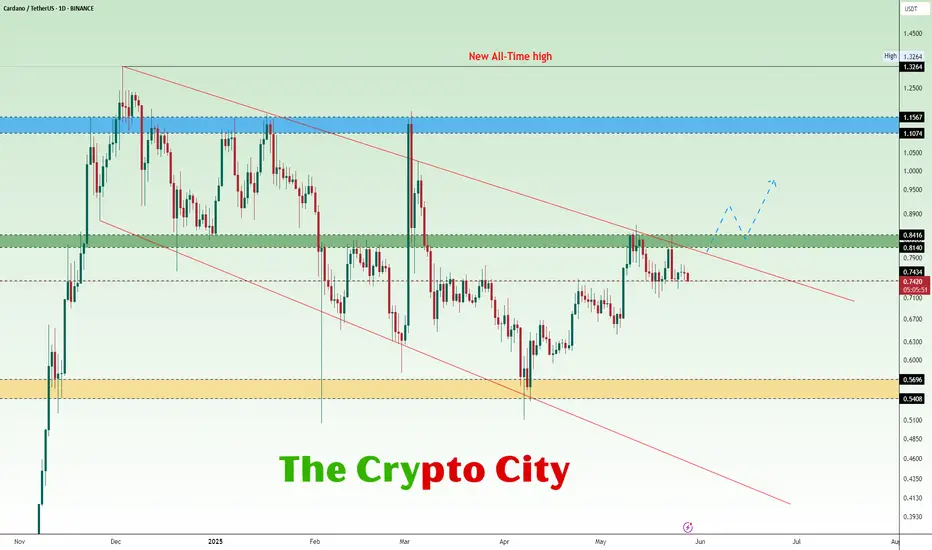
Cardano Explosive Move Ahead?The daily chart for ADA/USDT shows that Cardano is still trading within a clear descending channel, facing consistent resistance near the upper trendline. Recently, the price was rejected from a key resistance zone Green between $0.8140 and $0.8416. Despite several attempts, ADA has struggled to break above this level, reinforcing the bearish outlook. Strong support lies between $0.5408 and $0.5696 in Yellow, which previously held during a sharp decline in April. Unless ADA breaks above the descending trendline and holds above the Green zone resistance with strong volume, the downside risk remains, with potential for a retest of lower support levels.
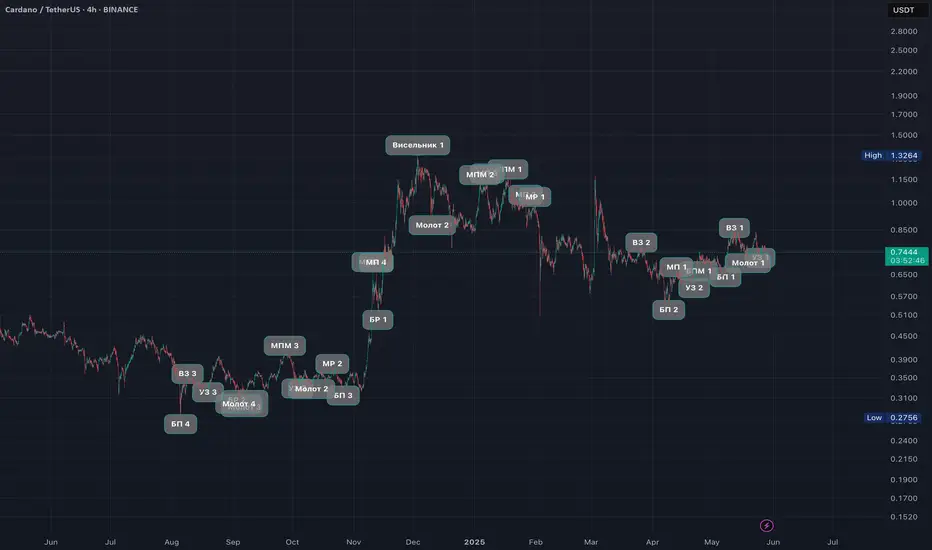
Candle PatternsLesson 2: Candle patterns for the home task
Time Frame 4H
1.Bullish Engulfing (4 instances)
2.Bearish Engulfing (4 instances)
3.Bearish Reversal (4 instances)
4.Bullish Reversal (4 instances)
5.Hammer (4 instances)
6.Hanging Man (4 instances)
7.Morning Star (4 instances)
8.Evening Star (4 instances)
9.Bullish Inverted Hammer (4 instances)
10.Bearish Inverted Hammer (4 instances)