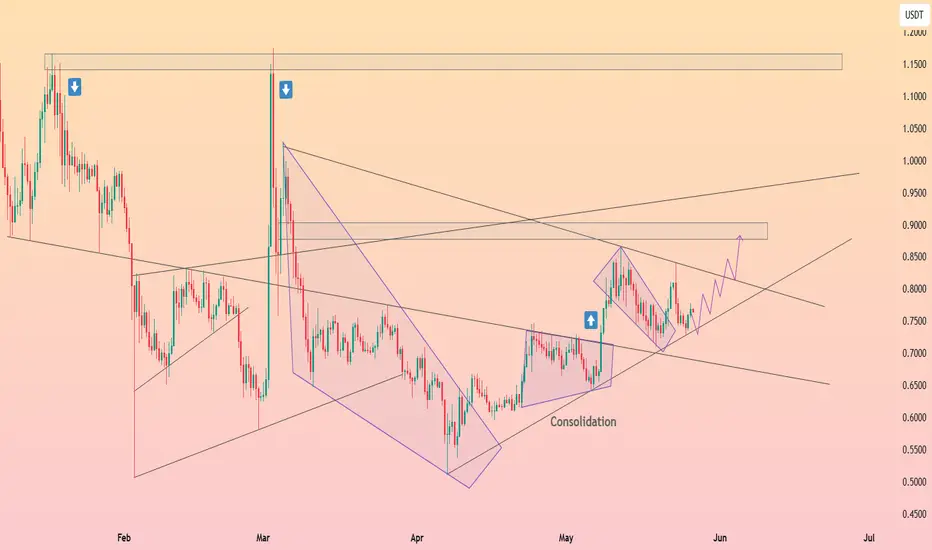
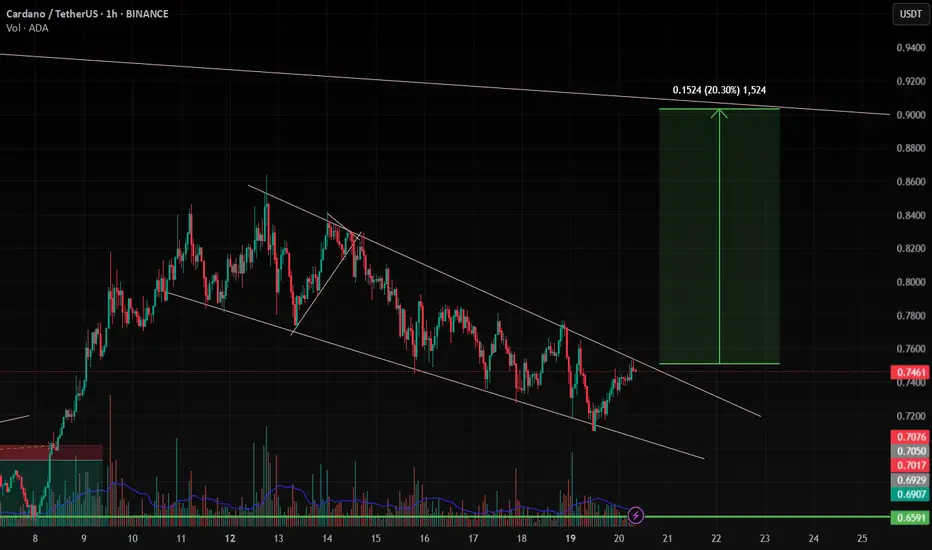
ADA - Time to buy again!The pattern has broken, and now I expect the price to rise to $0.93 . AB=CD.
Give me some energy !!
✨We spend hours finding potential opportunities and writing useful ideas, we would be happy if you support us.
Best regards CobraVanguard.💚
_ _ _ _ __ _ _ _ _ _ _ _ _ _ _ _ _ _ _ _ _ _ _ _ _ _ _ _ _ _ _ _
✅Thank you, and for more ideas, hit ❤️Like❤️ and 🌟Follow🌟!
⚠️Things can change...
The markets are always changing and even with all these signals, the market changes tend to be strong and fast!!
ADAUSDT.P trade ideas

HolderStat┆ADAUSD Cardano’s ascending revivalCRYPTOCAP:ADA — Big falling wedge flipped to upside; price stair-steps through consolidation clusters along an accelerating support beam. Holding 0.78-0.80 keeps 0.90-0.95 target box in play, with 0.72 trendline as fallback. Structure still favors higher-highs path.
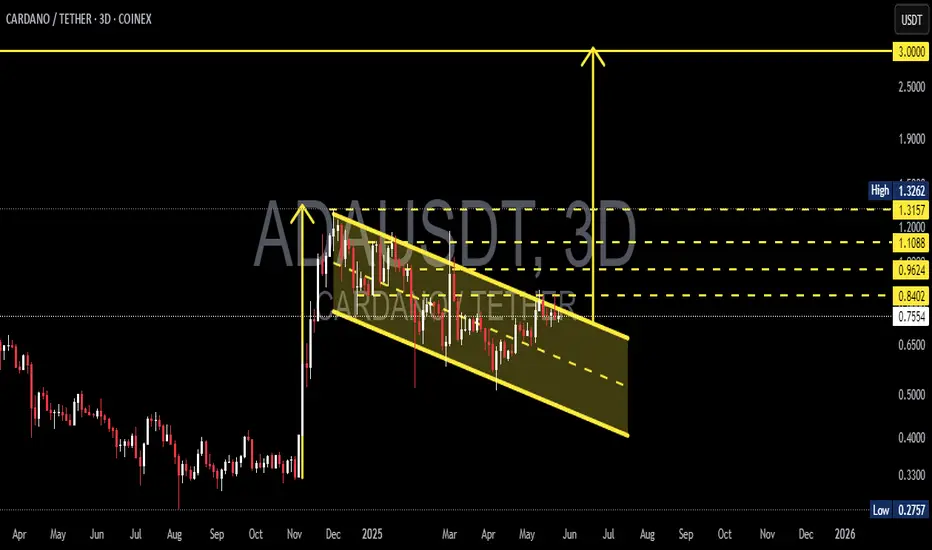
ADAUSDT 3D Analysis ADA ~ 3D Analysis
#ADA Buy after successfully breaking through this resistance line with a short-term target of at least 10%++, long-term target $3
TradeCityPro | ADAUSDT Is It Time to Buy Cardano?👋 Welcome to TradeCityPro Channel!
Let’s dive in and analyze one of the market’s favorite coins, Cardano (ADA), which is in a strong position compared to most altcoins and is holding at higher resistance levels.
🌐 Overview Bitcoin
Before starting the analysis, I want to remind you again that we moved the Bitcoin analysis section from the analysis section to a separate analysis at your request, so that we can discuss the status of Bitcoin in more detail every day and analyze its charts and dominances together.
This is the general analysis of Bitcoin dominance, which we promised you in the analysis to analyze separately and analyze it for you in longer time frames.
Bitcoin Chart
📊 Weekly Timeframe
On the weekly time frame, ADA, like SOL, SUI, XRP, and most of the top ten coins in the market, is still in a better situation, with the price fluctuating at higher levels.
After being rejected at 1.1983 and losing support at 0.7959, we experienced a sharp drop to 0.50, driven by panic in the market due to Trump and U.S. tariffs on other countries.
Currently, in the weekly time frame, we’re still at higher levels compared to most of the market, and we can expect a strong move going forward. It’s worth noting that breaking 1.1988 will provide the best trigger for a buy.
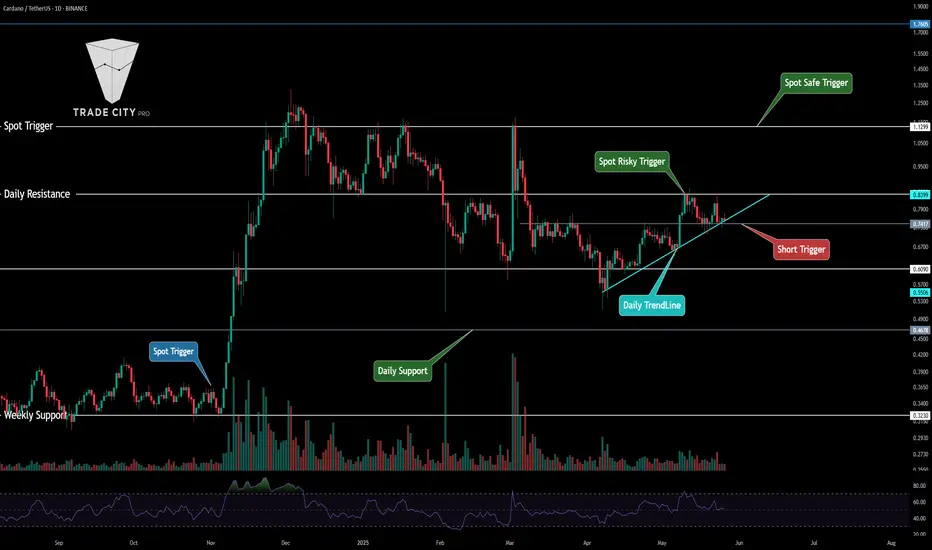
📈 Daily Timeframe
Interesting things are happening on the daily time frame, and we’re clearly still at higher levels than other altcoins. If the market itself undergoes a trend change, we can be ready for a long trigger sooner.
After breaking 0.8204 and losing the 0.236 Fibonacci level, we experienced a sharp decline that also saw high volume. I expected that after this volume, we’d transition from volatility to forming a range box, and that’s exactly what’s happening. We’re forming a box between 0.6777 and 0.8204, but if today’s daily candle closes as it is, the downtrend will continue!
Additionally, after this event, we had a break of the support floor that turned out to be a fakeout, leading us to establish a new support level. Currently, our most important support is 0.6090, and we’re moving along a daily trendline. If we bounce from this trendline and break the 0.8419 resistance, it will be the best trigger for a buy. On the other hand, if the support breaks and we lose the 0.7417 low, we can go for a short position.
📝 Final Thoughts
Stay calm, trade wisely, and let's capture the market's best opportunities!
This analysis reflects our opinions and is not financial advice.
Share your thoughts in the comments, and don’t forget to share this analysis with your friends! ❤️
ADA: Bigger move is coming! If you're looking to trade ADA at the moment, here's a quick setup that you might find helpful!
The idea is: Buy when the price breaks above $0.865 and take profits at the levels shown in the chart.
Targets:
1. $0.9
2. $0.98
3. $1.03
-------------------------------------------
About our trades:
Our success rate is notably high, with 10 out of 11 posted trade setups achieving at least their first target upon a breakout price breach (The most on TW!). Our TradingView page serves as a testament to this claim, and we invite you to verify it!

Cardano (ADA) Rectangle + Internal Uptrend (1D)BINANCE:ADAUSDT has spent months ranging between ~$0.51 and ~$1.15, and the structure now clearly qualifies as a rectangle pattern.
After a 3rd touch on support in April, Cardano is showing strength with steady higher lows and a reclaim of a key High Volume Node (HVN).
Key Levels to Watch
• Main Demand: ~$0.51-$0.58
• Rectangle Support: ~$0.51
• Rectangle Resistance: ~$1.15
• Internal Uptrend Support: Rising diagonal from April
• HVN Zone: ~$0.75 — key volume cluster
• Rectangle Midline: ~$0.83 — also a previous S/R
• Main Supply: $1.10–$1.32
Measured Target
If price breaks above $1.15 with volume, the rectangle measured move points to ~$1.80.
Context
ADA has respected this range for nearly half a year. A breakout could mark the start of a macro bullish leg.
Triggers
• Bullish: Clean daily close above $1.15 with volume → $1.80 target activated. For a safer entry, it could be worth waiting a full breakout from the main supply above $1.32.
• Bearish: Breakdown of the ascending trendline and HVN → Potential return to ~$0.51. Failure to hold that level could lead to further downside to the previous ~$0.30 demand zone.

ADA Is Approaching a Trap Zone ? Yello Paradisers, are you watching how ADA is slowly coiling up near a crucial level while pretending nothing’s happening? Don’t be fooled — this is the calm before the storm, and the next move could wipe out the unprepared.
💎#ADAUSDT is currently respecting a well-established ascending channel. We’ve already seen three meaningful reactions at the ascending support, each triggering fresh bullish momentum. At the same time, the price is pressing just above a key demand zone around the $0.73–$0.74 region. This level remains absolutely critical for the bulls to defend if the structure is to remain intact.
💎What adds strength to this setup is #ADA’s current trading position above both the 50 EMA and 200 EMA on the daily timeframe. This reinforces the short-to-mid-term bullish bias. The 50 EMA is starting to slope upward, signaling that momentum could be gradually building, while the 200 EMA sits well below as solid structural support.
💎As long as the price continues to respect the ascending support line and stays above the demand zone, we expect a continuation move toward the $0.8728 moderate resistance. A successful break and close above that could open up the next leg toward $1.0011, where a strong supply zone sits waiting.
💎The real danger lies below $0.6495. A daily close under this level would not just invalidate the current setup it would completely shift market structure and expose ADA to deeper downside, likely towards the $0.60 area or lower.
Discipline, patience, robust strategies, and trading tactics are the only ways you can make it long-term in this market.
MyCryptoParadise
iFeel the success🌴

ADA/USDT (1H Timeframe)Current Price:
$0.7694 (up +1.28%)
Key Observations:
1. Ascending Trendline:
The price is moving along a clear ascending trendline, showing short-term bullish momentum.
The price is making higher highs and higher lows.
2. Immediate Resistance Zone:
Price is approaching a resistance zone around $0.79–$0.80.
This area could act as a strong supply zone.
3. Support Zones:
Minor support near $0.757–$0.760 (recent breakout zone).
Major support lies between $0.740–$0.745.
4. Moving Average:
Price is trading above the blue EMA line, indicating buyers are currently in control.
Possible Trading Scenarios:
Bullish Scenario:
If the price holds above the ascending trendline and breaks the $0.78 resistance:
Long Entry: Above $0.780
Target 1: $0.79
Target 2: $0.82
Stop Loss: Below $0.765
Bearish Pullback Scenario:
If the price gets rejected from $0.78–$0.79 and breaks below the trendline:
Short Entry: Below $0.760
Target 1: $0.750
Target 2: $0.740
Stop Loss: Above $0.770

ADA/USDT -1H
Leverage: 5x–10x
Time Horizon: Within 7 days
---
Entry Zone:
0.7750 – 0.7800 USDT
Targets:
TP1: 0.7480 (+3.5%)
TP2: 0.7290 (+6.0%)
Stop Loss:
0.8440 (-8.9%)
Risk-Reward Ratio:
TP1: ~1:2.6
TP2: ~1:4.5
---
Technical Justification:
Strong resistance zone at 0.7750–0.78 visible across all timeframes.
RSI in 15m and 1h timeframes is in overbought territory → potential pullback.
Stochastic RSI is also peaking in lower timeframes.
In the daily chart, price is near a long-term descending trendline — a key resistance.
Volume weakening near resistance zone.
---
Risk Management Note:
If you're using 10x leverage, size your position so your account risk is capped at ~2–3%.
Invalidation: If a daily candle closes above 0.8130, this setup is no longer valid.

Alert!!! Very very strong bearish trend is coming!If the daily tf confirms its bearish trend the ada may see 0.40$ until next month!! When it confirms i will let you know it in next idea.
#ADA/USDT#ADA
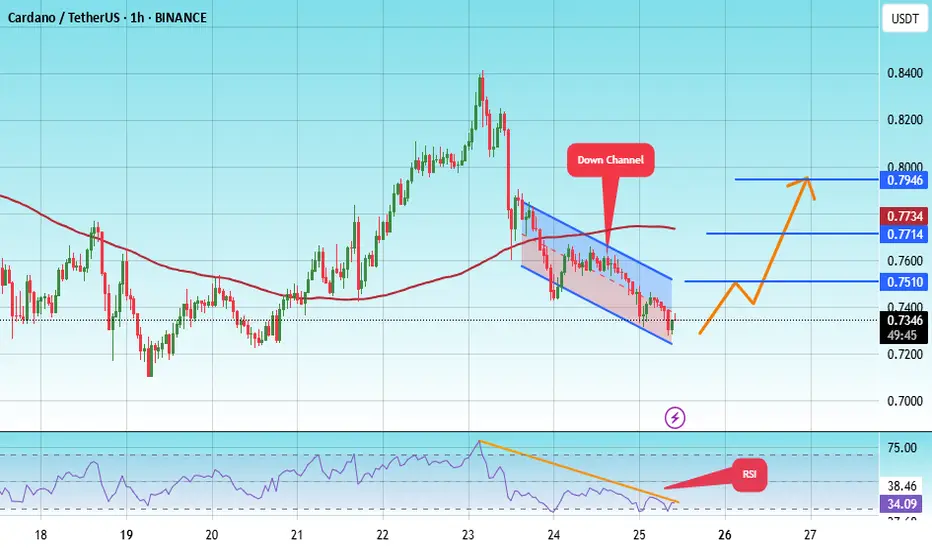
The price is moving within a descending channel on the 1-hour frame, adhering well to it, and is heading for a strong breakout and retest.
We are experiencing a rebound from the lower boundary of the descending channel, which is support at 0.7200.
We are experiencing a downtrend on the RSI indicator, which is about to break and retest, supporting the upward trend.
We are looking for stability above the 100 Moving Average.
Entry price: 0.7358
First target: 0.7510
Second target: 0.7700
Third target: 0.7946
Cardano (ADA): Seeing Good Risk:Reward Trades That Can Be TakenCardano coin is back near a major resistance zone where we had multiple attempts of breakout happening and now the price is yet again showing some sort of weakness in the markets. We are waiting for 1 of 2 zones to be broken and secured in order to enter into a setup here.
More in-depth info is in the video—enjoy!
Swallow Academy

Cardano (ADA): Noticed Good Opportunity For 2 Short PositionsCardano is showing signs of weakness, where we see a good shorting opportunity on the 30M timeframe and the same goes for the daily timeframe.
More in-depth info is in the video—enjoy!
Swallow Academy

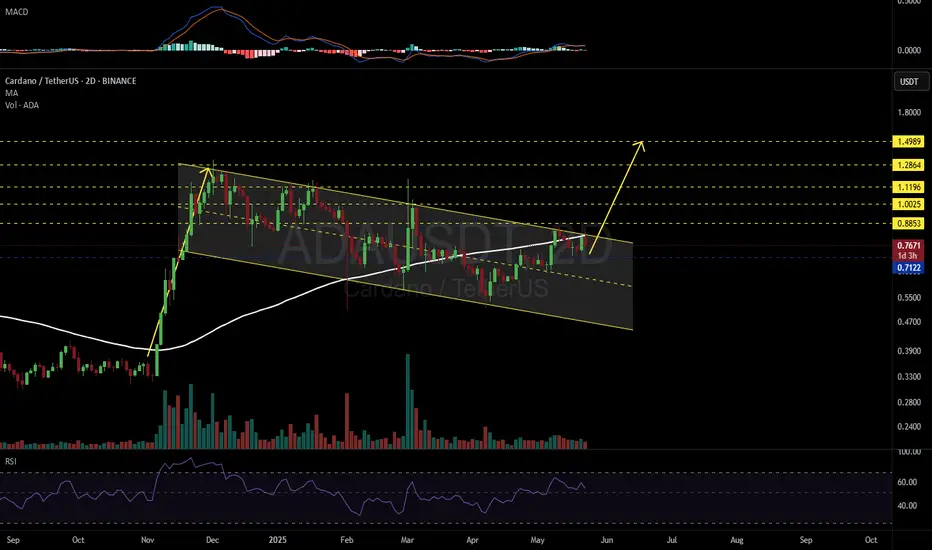
ADAUSDT 2D#ADA is moving inside a descending channel on the 2-day chart and was recently rejected from the channel resistance and the 2-day MA100.
Buying near the support level at $0.7122 could offer a solid opportunity.
In case of a breakout above the channel and the 2-day MA100, the targets are:
🎯 $0.8853
🎯 $1.0025
🎯 $1.1196
🎯 $1.2864
🎯 $1.4989
⚠️ Use a tight stop-loss.
Cardano (ADA): 4 Strong Signs of Upcoming DropCardano has had a good rally both to lows and highs but we still see the dominance from sellers, which means we might see further movement to lower zones as long as sellers dominate the 4 points that we told you in the video!
More in-depth info is in the video—enjoy!
Swallow Academy

Cardano (ADA): We Are In Bullish Trend | Reaching Pressure PointCardano is in the bullish trend where, on smaller timeframes, we are seeing a good small scalp that can be taken, but be careful...on the 4-hour timeframe, we are approaching the pressure point between the resistance, EMAs, and bullish trend.
More in-depth info is in the video—enjoy!
Swallow Academy

HolderStat┆ADAUSD kept the $0.7 levelCRYPTOCAP:ADA reversed a three-month slide with a textbook falling-wedge breakout and now oscillates inside a tightening flag above the 0.72 USDT backbone. Bulls guard successive higher lows along that trend beam; maintain it and the pattern’s target aligns with the 0.90-0.95 supply cap highlighted overhead. A dip toward 0.68 would simply revisit wedge support before any larger drive.

ADAUSDT , 1HrPattern is looking Good , If BTC is Sustaining Above 1,06,834 this level then , This ADA pattern will Give a Good Breakout ,
Enter only When Upper Trendline is Breakout
Take Your Own Risk According to your Capital .
Follow for More Ideas Like This
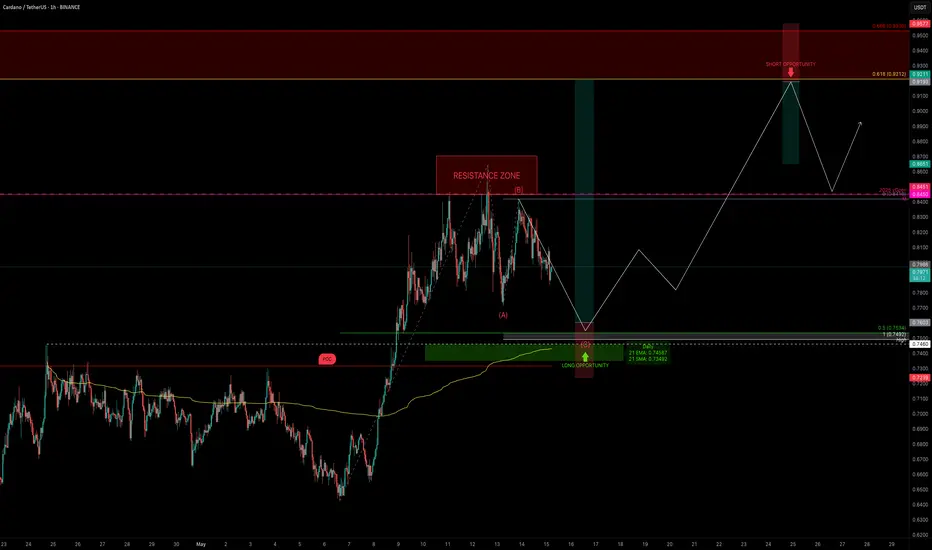
ADA Correction Nearing Completion — Trade It Like a ProADA is respecting structure beautifully and currently consolidating after completing a 5-wave impulse move. The key question now is: where are the next high-probability trade setups?
Let’s break it down step by step.
Market Structure & Elliott Context
ADA has completed a full 5-wave bullish sequence, and—as expected—is now in a correction phase. This appears to be forming a classic ABC correction.
Using the Fibonacci retracement tool:
0.5 retracement of the entire move sits at → $0.7534
This aligns perfectly with the previous swing high at $0.746 — a level that has yet to be retested
The 1:1 trend-based Fib extension of a potential ABC correction puts Wave C at → $0.7492
Confluence Check:
This entire support zone (~$0.75) is stacked with technical alignment:
✅ Previous swing high: $0.746
✅ 0.5 Fib retracement: $0.7534
✅ 1:1 extension: $0.7492
✅ Daily 21 EMA: $0.7455
✅ Daily 21 SMA: $0.7347
✅ Point of Control (POC): ~$0.7318
✅ Anchored VWAP: Also sitting in this zone
✅ Pitchfork golden pocket: Aligns as dynamic support
All of these support indicators point to one thing: this ~$0.75 zone is a high-probability long entry area.
🟢 Long Setup
Entry zone: Ladder between $0.77 – $0.75
Average entry: ~$0.76
Stop-loss: Below $0.7318 (under POC)
Target: $0.9212 (0.618 retracement of the recent down wave)
R:R: ~5:1
Potential upside: +22%
🔴 Short Setup (on Rejection Only)
Entry: $0.9212 (0.618 Fib retracement of downtrend)
Stop-loss: Above 0.666 Fib → ~$0.958
Target: previous swing high or yearly open
R:R: ~1.4:1 (it can be adjusted tighter upon confirmation)
This short setup isn’t ideal in terms of R:R unless we see clear rejection. But with confirmation — like an SFP, bearish engulfing, or divergence — the stop can be tightened, making the risk-to-reward much more favourable.
📘 Educational Insight: Why Structure Beats Emotion
In trading, the strongest setups occur where multiple tools converge—Fib levels, EMAs, VWAP, volume zones, and past price action. When these align, it’s not about guessing—it’s about preparing.
The key is to wait for structure to come to you, not the other way around. Patience allows clarity. Clarity allows precision. And precision pays.
💡 Final Thoughts
The plan is clear. Levels are set. Now it’s just observation and discipline.
Good trades don’t chase attention — they present themselves to those who wait.
___________________________________
If you found this helpful, leave a like and comment below! Got requests for the next technical analysis? Let me know.
ADA/USDT: Bullish Move Ahead ? (READ THE CAPTION)By examining the #Cardano chart on the 3-day timeframe, we can see that the price is currently trading around $0.80. If it holds above $0.71, we can expect more upside. The expected return for Cardano is around 30% in the short term, 47% in the medium term, and 85% in the long term.
Please support me with your likes and comments to motivate me to share more analysis with you and share your opinion about the possible trend of this chart with me !
Best Regards , Arman Shaban

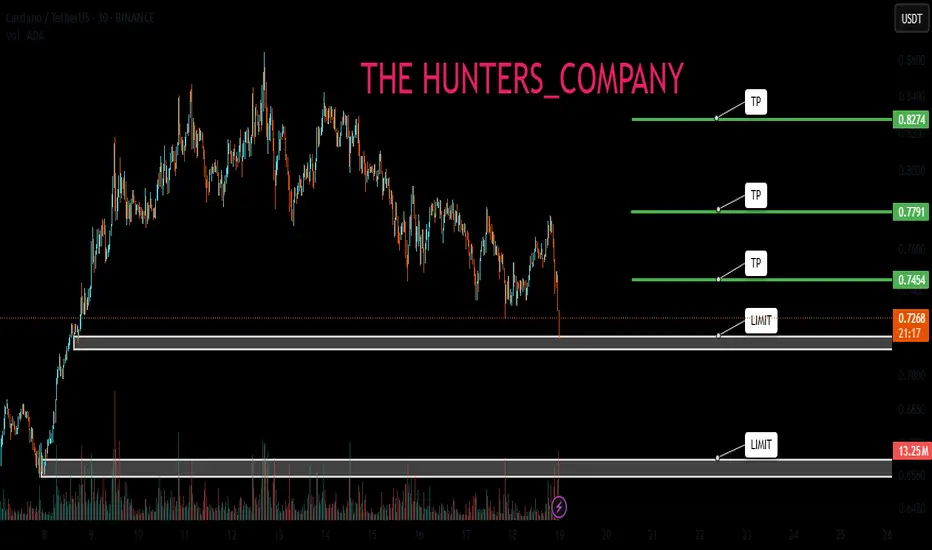
Be prepared for everything...Hello dears
Given the recent growth, the price is stuck in a range and now that it has reached the bottom of the range, there are two options:
1_The price grows from here and hits our target.
2_The price continues to fall and falls to the support area below and our second buying step is activated and grows from there.
Buy a step and be ready for anything.
*Trade safely with us*
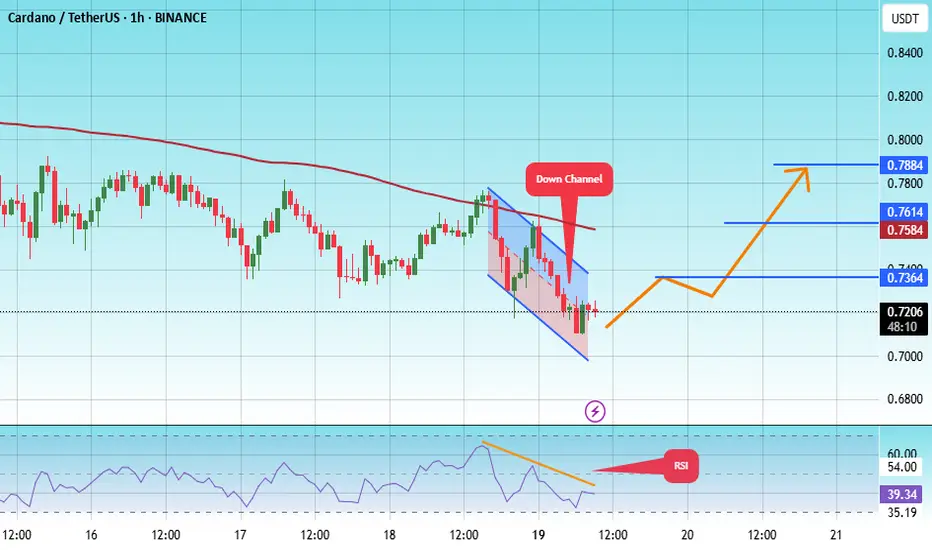
#ADA/USDT#ADA
The price is moving within a descending channel on the 1-hour frame, adhering well to it, and is heading for a strong breakout and retest.
We are seeing a bounce from the lower boundary of the descending channel, which is support at 0.7025.
We have a downtrend on the RSI indicator that is about to break and retest, supporting the upward trend.
We are looking for stability above the 100 moving average.
Entry price: 0.7045
First target: 0.7364
Second target: 0.7584
Third target: 0.7884
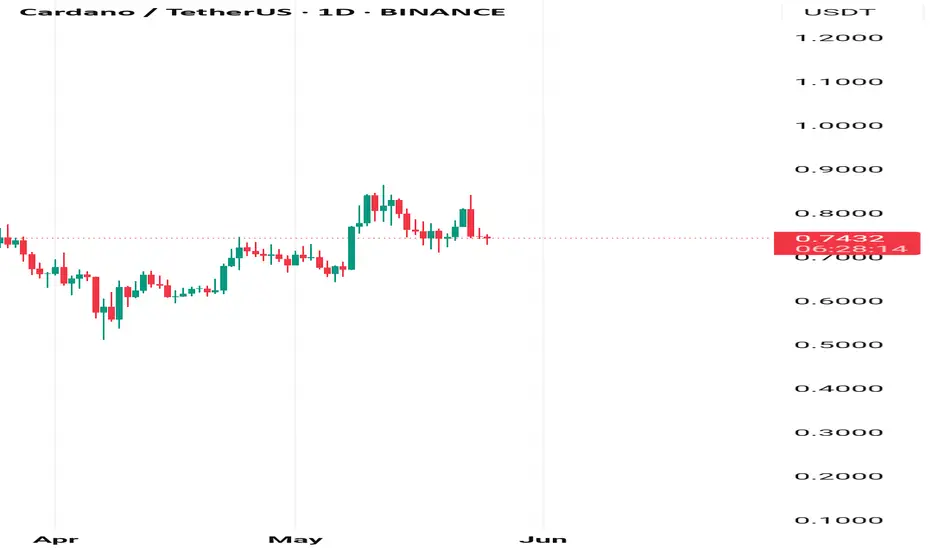
ADAUSDT WeeklyLet's see the chart on higher timeframes a bit also for once. Let us examine the bigger levels and bigger picture.
