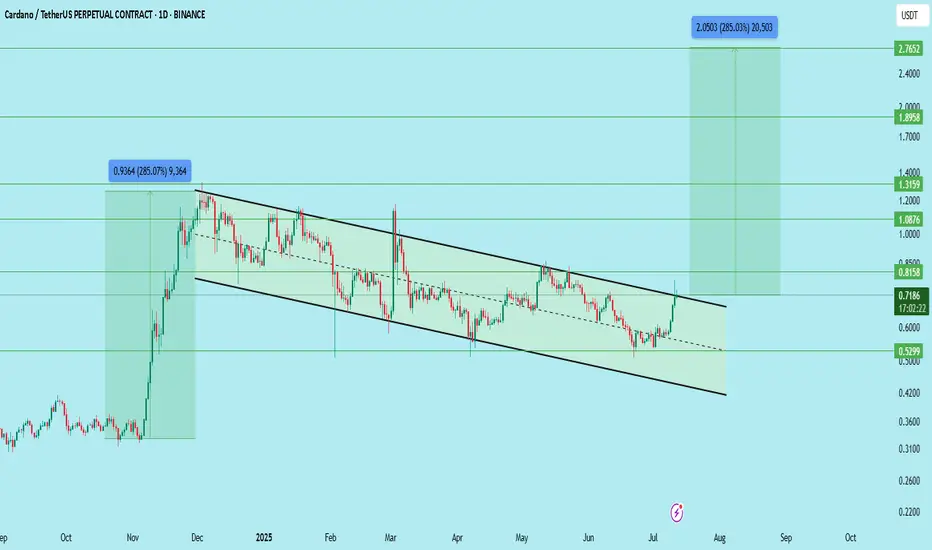
TradeCityPro | ADA Eyes Breakout from Bearish Channel Top👋 Welcome to TradeCity Pro!
In this analysis, I want to review the ADA coin for you. The Cardano project is one of the oldest and most popular projects in crypto.
🔍 The coin of this project has a market cap of 22.21 billion dollars and is ranked 10 on CoinMarketCap.
📅 Daily Timeframe
On the daily
Related pairs
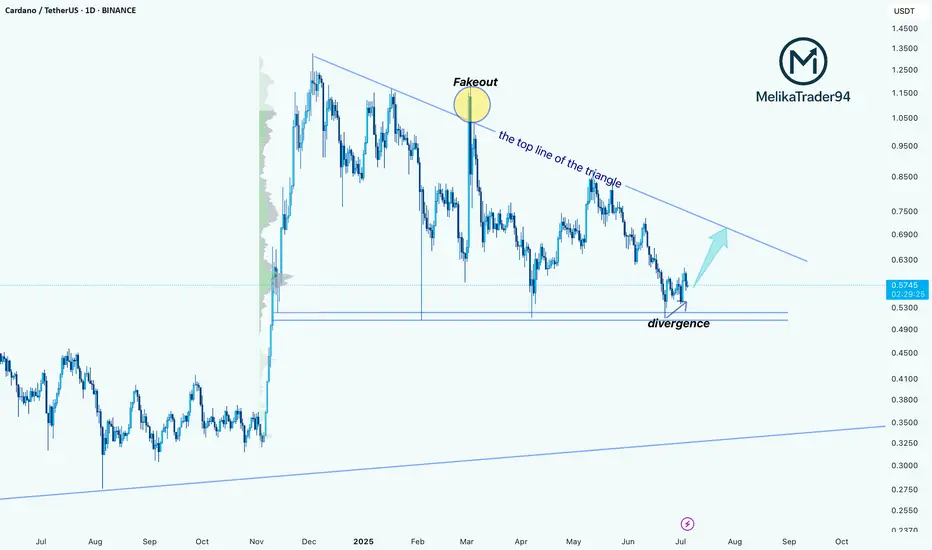
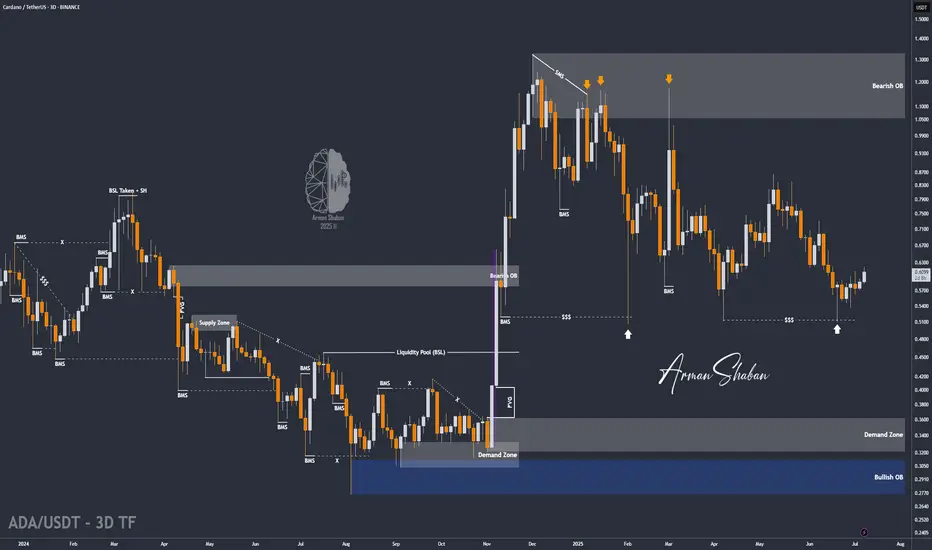
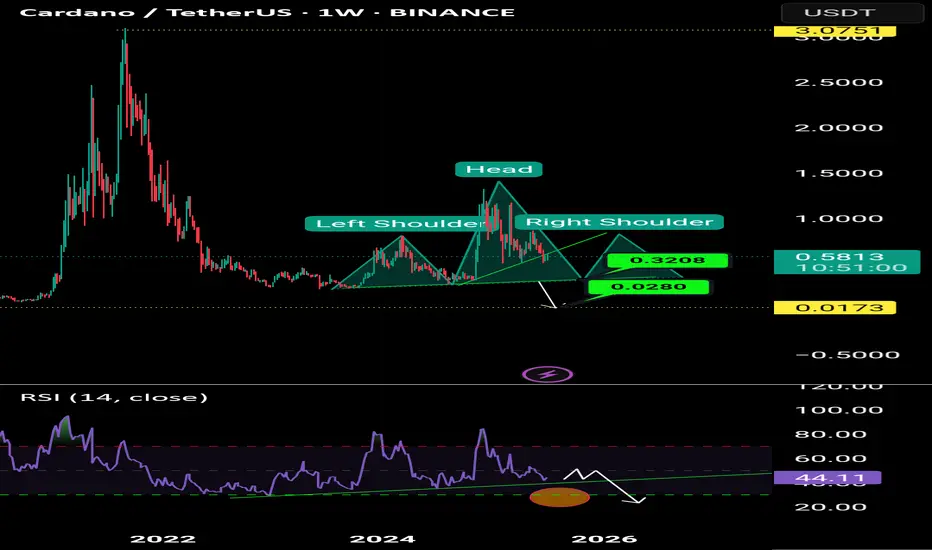
Cardano Forming Potential Reversal Structure Inside TriangleHello guys!
Cardano’s been stuck inside this big descending triangle for months. We had a fake breakout a while back that totally failed.
Now, price is back at support and showing bullish divergence. That’s usually a sign sellers are getting tired.
If buyers step in here, I’m expecting a move bac
Cardano Ultra Bullish Confirmed, $1.83 Next (Easy) TargetThis is it. This is the signal you've been waiting for and the strongest possible signal across the Cryptocurrency market. Cardano is now moving above MA200 on the weekly timeframe, on a full green candle, as Bitcoin produces a very strong new all-time high. Simply put, this is the best ever.
Carda
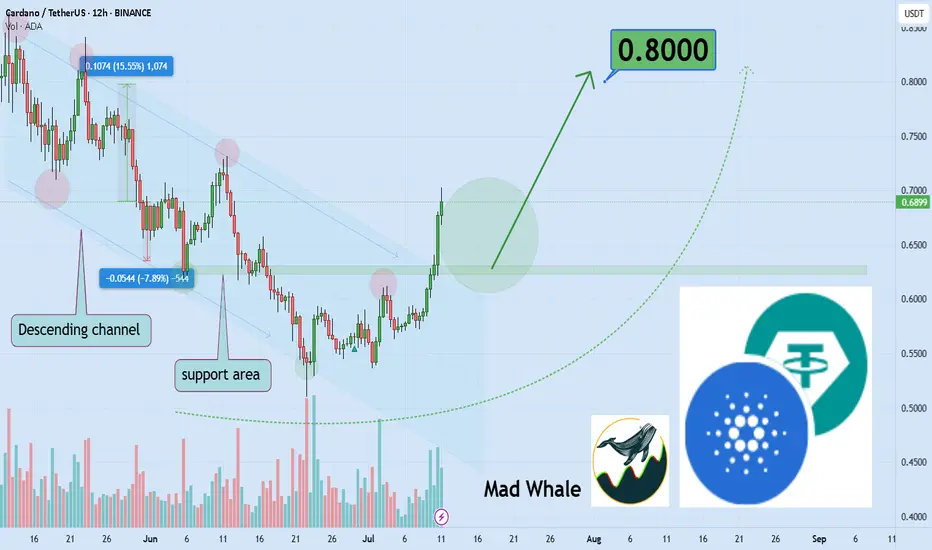
Will Cardano’s breakout drive a 15% surge to $0.80?Hello✌
let’s dive into a full analysis of the upcoming price potential for Cardano 📈.
BINANCE:ADAUSDT has broken out of its descending channel with strong volume, indicating a potential bullish reversal. Price is currently near a key support level, setting the stage for further upside. A move to
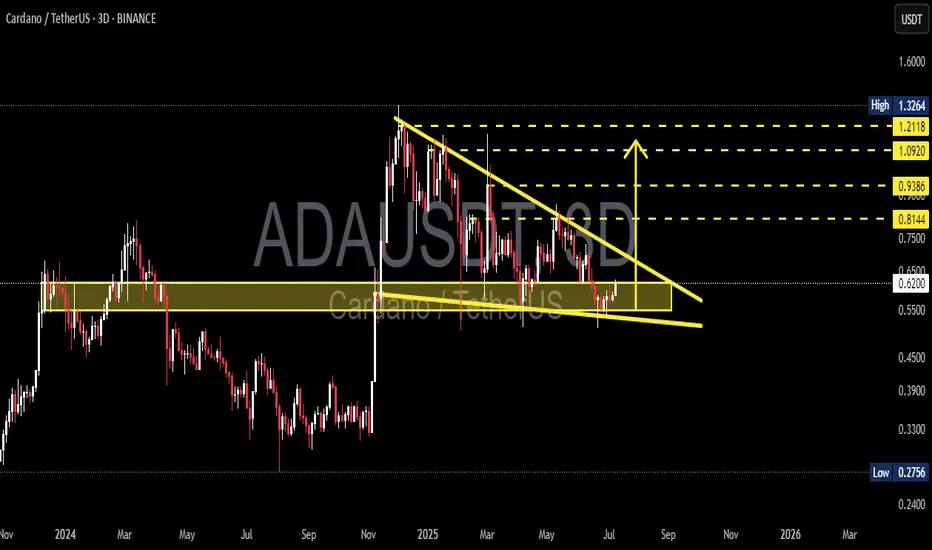
ADA/USDT Ready to Explode? Watch This Symmetrical Triangle
🧠 Detailed Technical Analysis:
Cardano (ADA) is currently consolidating within a well-defined Symmetrical Triangle pattern on the 3-day chart. This pattern is formed by a series of lower highs and higher lows, indicating compression and indecision in the market — a classic setup for a strong break
ADA/USDT : ADA Rally in Motion – Over 20% Gain and More to Come?By analyzing the Cardano (ADA) chart on the 3-day timeframe, we can see that after revisiting the $0.57 zone, the price once again followed the previous analysis and encountered strong buying pressure—rallying up to $0.61 so far.
The return from the previous entry has now exceeded 8%, and the overa
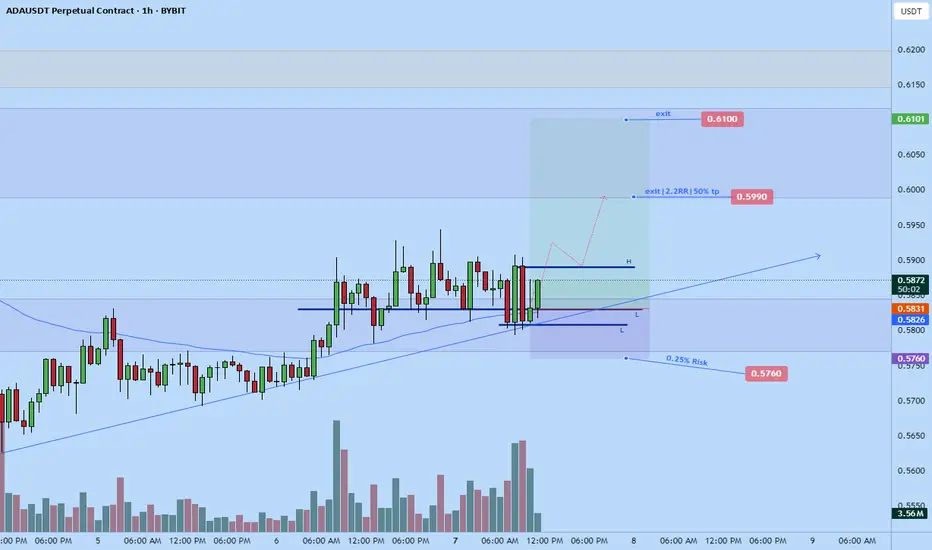
ADA long $0.6-$0.61Recently opened a long position on ADA. On the htf which is where I usually filter my trades it looks good. Looks like we at daily Hl area getting ready to push up. As am typing its spiking up.
Time sensitive
Stop: $0.5760
TP1: $0.5990
Tp2: $0.6100
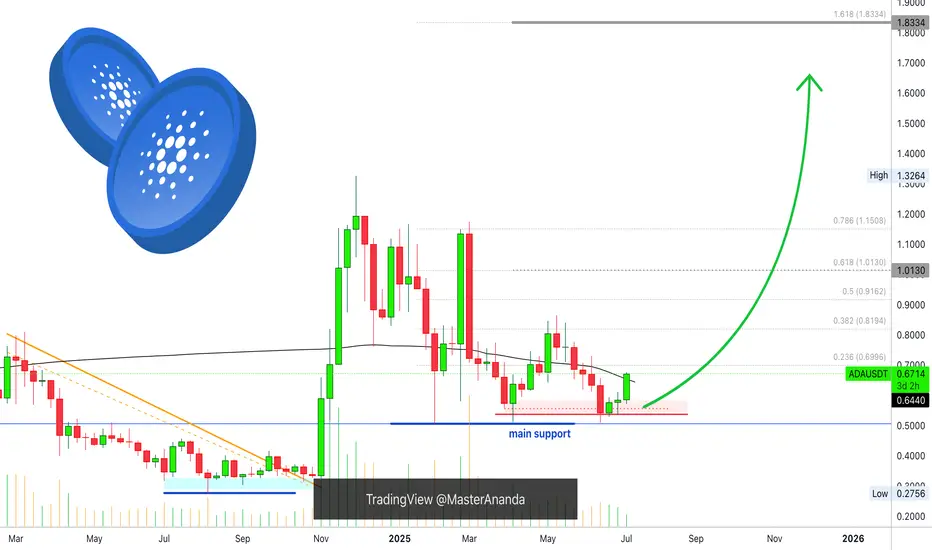
ADA Daily Update · Moving Averages · 262% Target ExposedGood morning my fellow Cryptocurrency trader, I know you are having a wonderful day because the market is doing great. We looked at Cardano together on the weekly timeframe and this is a big picture but what about short-term? Where are prices headed next? The next target, resistance/support and the
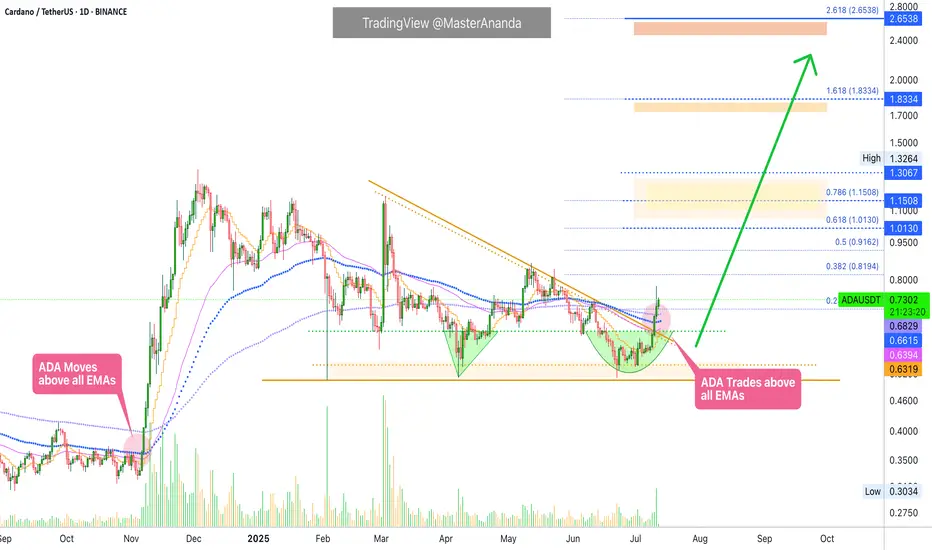
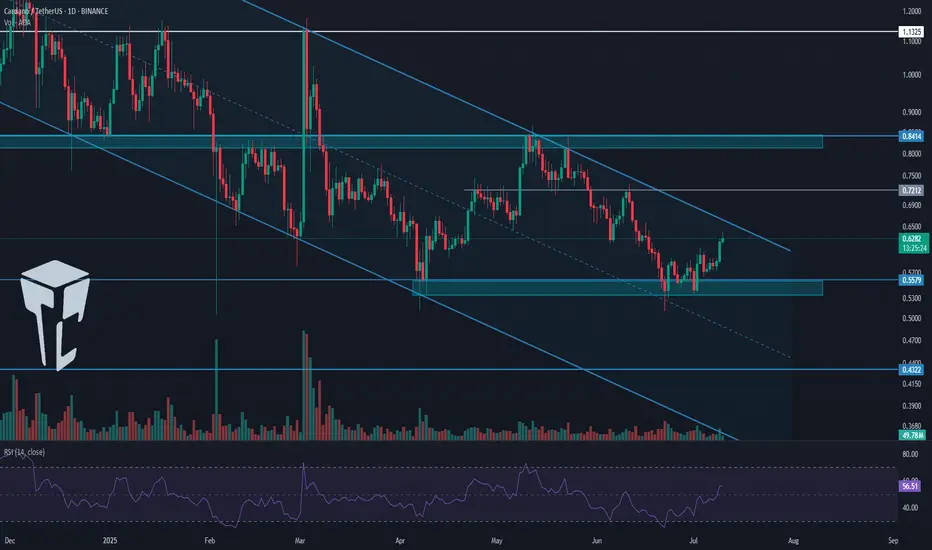
$ADA/USDT — Potential Long-Term BreakoutCardano is showing a major breakout from a long-standing descending channel on the daily timeframe.
Structure:
Downtrend channel respected for ~7 months
Breakout confirmed with a strong bullish daily candle
Price hovering around $0.7192, above previous resistance
Support Levels:
$0.60
$0.5299
Resi
See all ideas
Summarizing what the indicators are suggesting.
Oscillators
Neutral
SellBuy
Strong sellStrong buy
Strong sellSellNeutralBuyStrong buy
Oscillators
Neutral
SellBuy
Strong sellStrong buy
Strong sellSellNeutralBuyStrong buy
Summary
Neutral
SellBuy
Strong sellStrong buy
Strong sellSellNeutralBuyStrong buy
Summary
Neutral
SellBuy
Strong sellStrong buy
Strong sellSellNeutralBuyStrong buy
Summary
Neutral
SellBuy
Strong sellStrong buy
Strong sellSellNeutralBuyStrong buy
Moving Averages
Neutral
SellBuy
Strong sellStrong buy
Strong sellSellNeutralBuyStrong buy
Moving Averages
Neutral
SellBuy
Strong sellStrong buy
Strong sellSellNeutralBuyStrong buy
Displays a symbol's price movements over previous years to identify recurring trends.
Frequently Asked Questions
The current price of Ada / USDT (ADA) is 0.75640 USDT — it has fallen −0.25% in the past 24 hours. Try placing this info into the context by checking out what coins are also gaining and losing at the moment and seeing ADA price chart.
Ada / USDT price has risen by 31.96% over the last week, its month performance shows a 20.79% increase, and as for the last year, Ada / USDT has increased by 86.31%. See more dynamics on ADA price chart.
Keep track of coins' changes with our Crypto Coins Heatmap.
Keep track of coins' changes with our Crypto Coins Heatmap.
Ada / USDT (ADA) reached its highest price on Aug 23, 2021 — it amounted to 3.20000 USDT. Find more insights on the ADA price chart.
See the list of crypto gainers and choose what best fits your strategy.
See the list of crypto gainers and choose what best fits your strategy.
Ada / USDT (ADA) reached the lowest price of 0.00800 USDT on Oct 26, 2019. View more Ada / USDT dynamics on the price chart.
See the list of crypto losers to find unexpected opportunities.
See the list of crypto losers to find unexpected opportunities.
The safest choice when buying ADA is to go to a well-known crypto exchange. Some of the popular names are Binance, Coinbase, Kraken. But you'll have to find a reliable broker and create an account first. You can trade ADA right from TradingView charts — just choose a broker and connect to your account.
Crypto markets are famous for their volatility, so one should study all the available stats before adding crypto assets to their portfolio. Very often it's technical analysis that comes in handy. We prepared technical ratings for Ada / USDT (ADA): today its technical analysis shows the buy signal, and according to the 1 week rating ADA shows the buy signal. And you'd better dig deeper and study 1 month rating too — it's strong buy. Find inspiration in Ada / USDT trading ideas and keep track of what's moving crypto markets with our crypto news feed.
Ada / USDT (ADA) is just as reliable as any other crypto asset — this corner of the world market is highly volatile. Today, for instance, Ada / USDT is estimated as 8.79% volatile. The only thing it means is that you must prepare and examine all available information before making a decision. And if you're not sure about Ada / USDT, you can find more inspiration in our curated watchlists.
You can discuss Ada / USDT (ADA) with other users in our public chats, Minds or in the comments to Ideas.