ADA (repeat the pattern)ADA /USDT
ADA keeps repeating its old patterns as it’s clearly obvious in my chart
Breakout is going on lower time frames
Looks like an easy 2X
ADAUSDT trade ideas

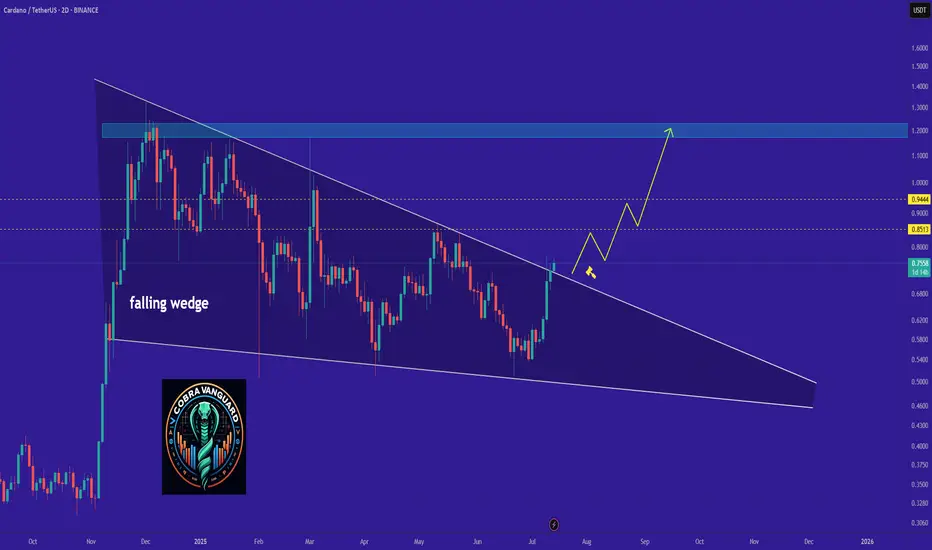
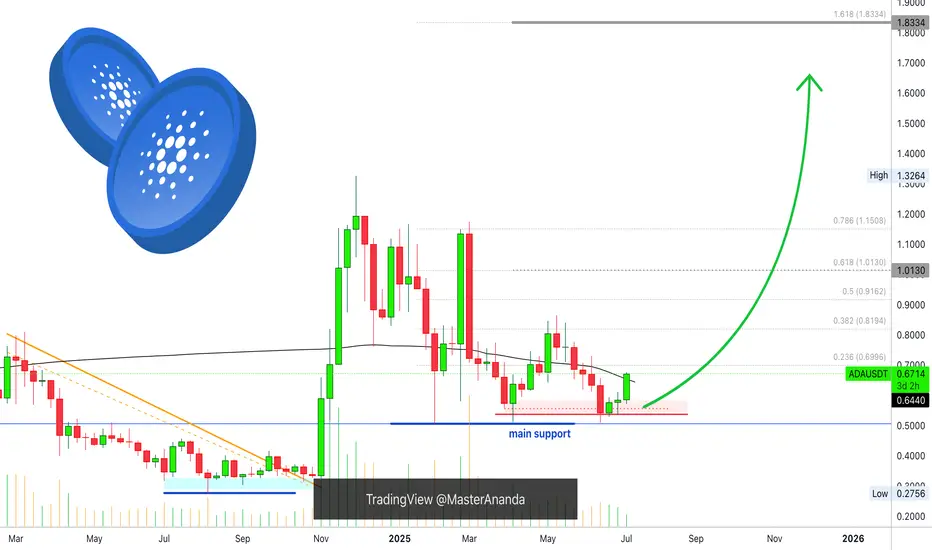
ADA - Time to buy again!The price has broken the wedge pattern, which means it can easily reach its previous high or even go higher.
Best regards CobraVanguard.💚
ADAUSDT: $1.50 Year End Target, Is It Possible? The price has remained steadily bullish, but we haven’t seen a strong bullish impulse in the daily timeframe yet. This suggests that we’ll likely reach the $1.50 price range. Please wait for the price to break out and then enter a trade when it shows confirmation. You can use smaller timeframes while taking any entry. Good luck and trade safely!
Like and comment for more!
Team Setupsfx_
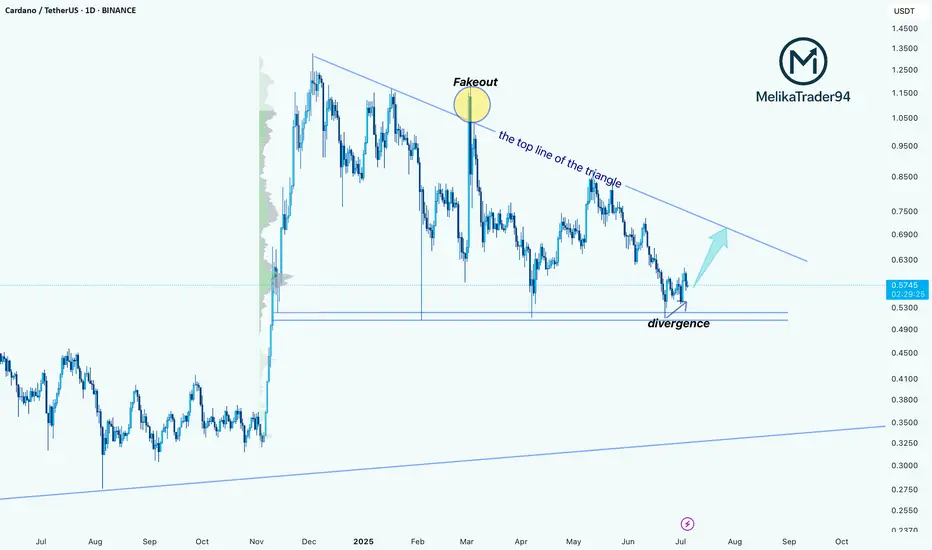
Cardano Forming Potential Reversal Structure Inside TriangleHello guys!
Cardano’s been stuck inside this big descending triangle for months. We had a fake breakout a while back that totally failed.
Now, price is back at support and showing bullish divergence. That’s usually a sign sellers are getting tired.
If buyers step in here, I’m expecting a move back up toward 0.67–0.70 (top of the triangle). But if it loses the 0.53 support, that setup’s off the table.
Bias: Leaning bullish
🎯 Target: 0.67–0.70
Invalidation: Clean break below 0.53
Let’s see how this plays out.
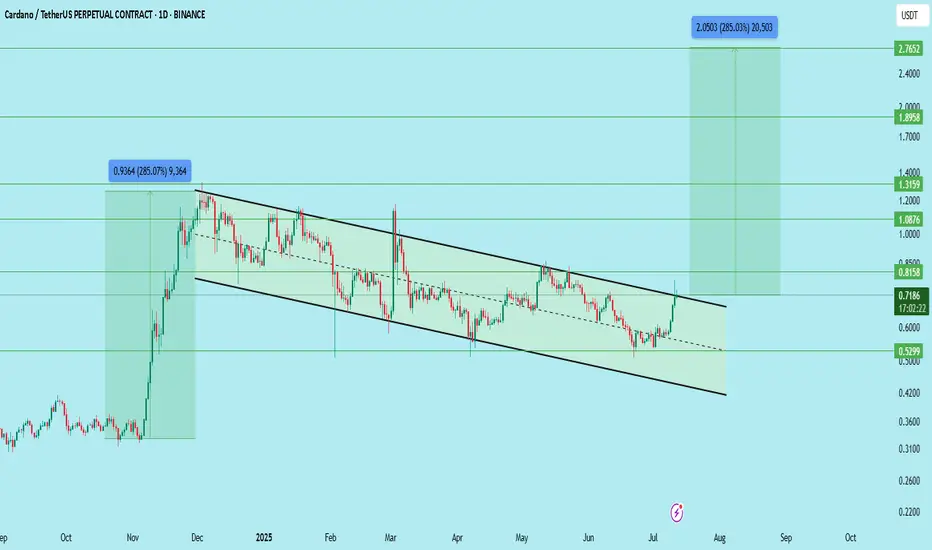
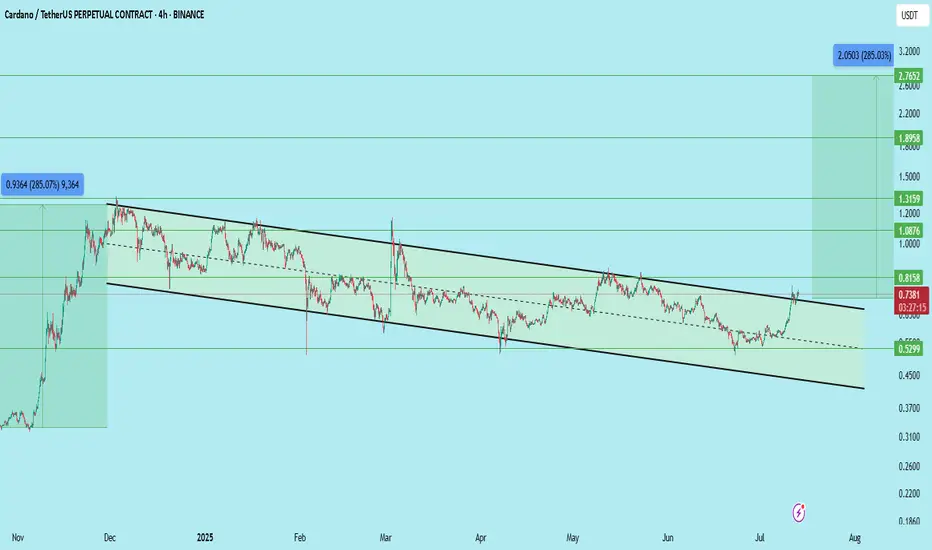
$ADA/USDT — Potential Long-Term BreakoutCardano is showing a major breakout from a long-standing descending channel on the daily timeframe.
Structure:
Downtrend channel respected for ~7 months
Breakout confirmed with a strong bullish daily candle
Price hovering around $0.7192, above previous resistance
Support Levels:
$0.60
$0.5299
Resistance / Long-Term Targets:
$0.8158
$1.0876
$1.3159
$1.8958
Ultimate target (Fib extension): $2.76+
Outlook:
The 285% potential move mirrors ADA’s past rally from similar conditions. If market sentiment continues improving and BTC holds above key levels, ADA might repeat history.
A pullback to $0.60–$0.66 could offer re-entry opportunities.
Bias: Bullish (long-term)
Caution: Not a trade setup—strictly an outlook. Watch BTC/ETH correlation.
DYOR | Not financial advice
Cardano ADA price analysis🪙 Five months ago, we published a medium-term trade for CRYPTOCAP:ADA , and the price still remains in the buying zone.
With the current growth, the price of OKX:ADAUSDT remains in consolidation, and when the correction begins, it would be very good if it stayed above $0.60.
😈 If you still have faith in the prospects of the #Cardano project, you can continue to hold or even buy #ADA during the correction.
Well, theoretically possible targets for the #ADAusd price are:
TP1 - $1.75
TP2 - $2.90
TP3 - $6.40
_____________________
Did you like our analysis? Leave a comment, like, and follow to get more

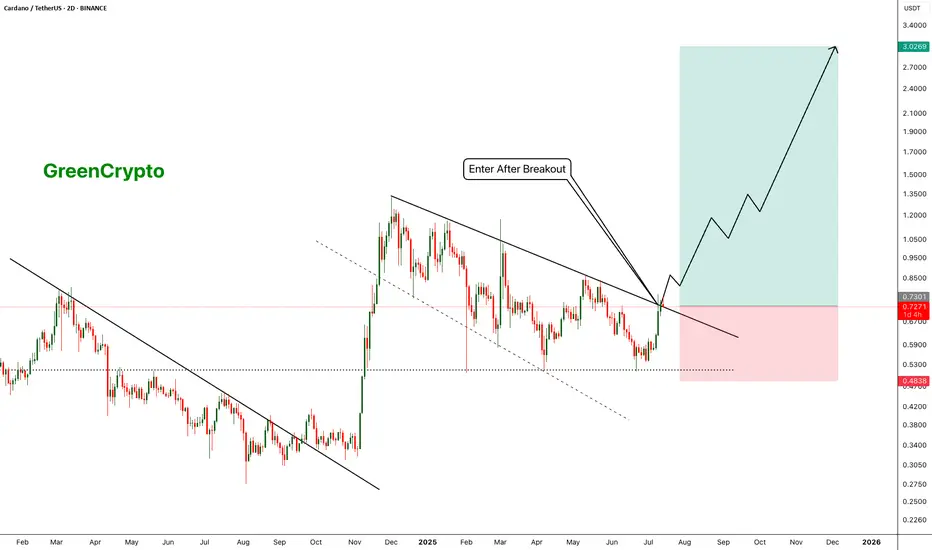
ADA - Beginning of something crazy- ADA is looking forward to the successfully breakout of the trendline resistance.
- A clean breakout from this resistance must to fuel the bullish trend.
- I'm expecting a target of 3$ from this trend.
Entry Price: 0.72
Stop Loss: 0.4838
TP1: 0.8602
TP2: 1.0342
TP3: 1.3379
TP4: 2.0144
TP5: 2.4818
TP6: 3.0329
Stay tuned for more updates
Cheers
GreenCrypto
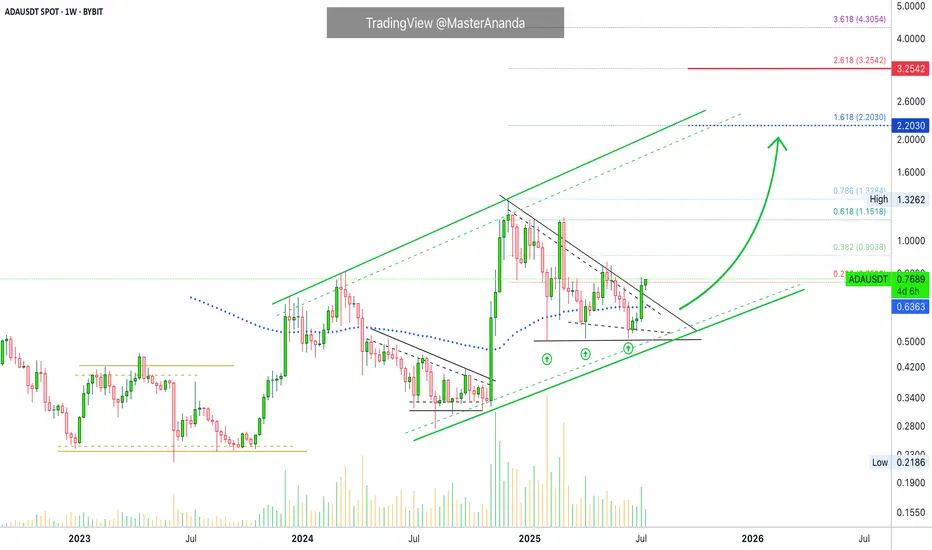
$2.2 Followed by $3.25 · Cardano Trend-Based Fib ExtensionCardano is a on a clear, and very strong, ascending channel rising since June 2023. We are clear, safe and confident about the bigger-broader market trend. An uptrend within a long-term bullish cycle.
After the peak in early December 2024 Cardano struggled to stay above EMA89—the blue dotted line on the chart—but this isn't the case anymore. After a triple-bottom, shy higher lows, last week ADAUSDT managed to break decisively above this level with a full green candle. This confirms the resumption of the late 2024 bullish wave.
Last week resistance was found at 0.236 Fib. extension. The weekly session closed right below it and this is shown as a thin tiny red dotted line on the chart. The current week is halfway through and ADAUSDT is now trading above this level. The bullish signal comes from the fact that the action is happening at the top of the candle; this is the fourth consecutive green week; the bullish bias is fully confirmed.
That is all there is. I just wanted to share a small update in support of our bullish bias based on chart data. You can rest easy knowing that the market will continue to grow.
Next target is $2.20 for 188%. Followed by $3.25 for 325%.
We use leverage on the big projects so the potential for profits can be multiplied by 5, 6, 7, 8, or 10X. The risk is higher of course, but so is the potential for reward. High risk vs a high potential for reward. You can always approach the pair spot if uncertain. If you lack experience but still want to join the ride, enjoy the rise, make money and have fun, you can buy spot, that is, buy and hold. The market will give you money if you are patient enough. This is the period where everything grows. Thanks a lot for your continued support. If you enjoyed the content consider hitting follow.
Namaste.
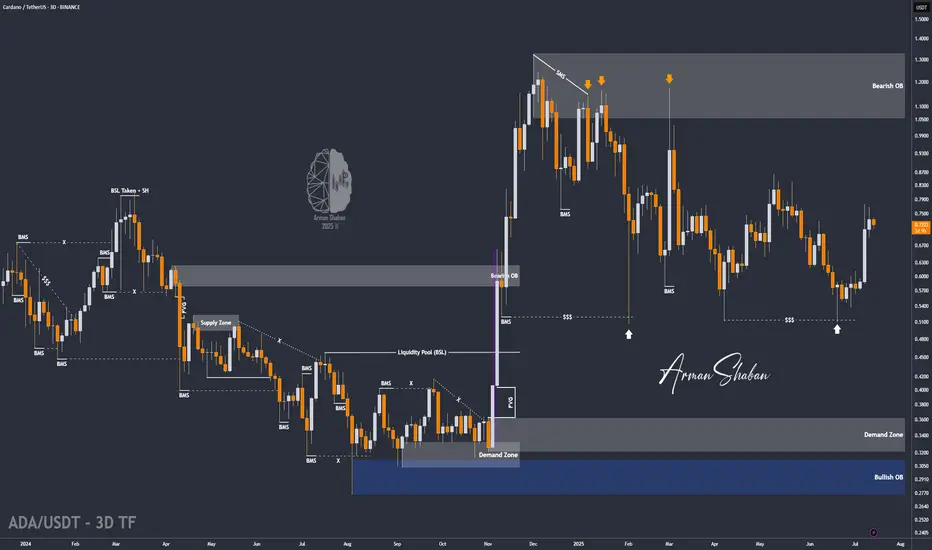
ADA/USDT : +50% in 21 Days, More Rise Ahead? (READ THE CAPTION)Over 50% growth in just 21 days — Cardano’s explosive rally continues, and the $0.76 target has now been hit! Since our last analysis, ADA has kept pushing higher, successfully reaching the next key level and bringing the total return from this move above 50%. Currently trading around $0.73, with strong bullish momentum still in play, I expect it won’t be long before we head toward the next targets. Upcoming levels to watch: $0.93, $1.05, and $1.33 — we’re getting closer to that 100% gain!
Please support me with your likes and comments to motivate me to share more analysis with you and share your opinion about the possible trend of this chart with me !
Best Regards , Arman Shaban
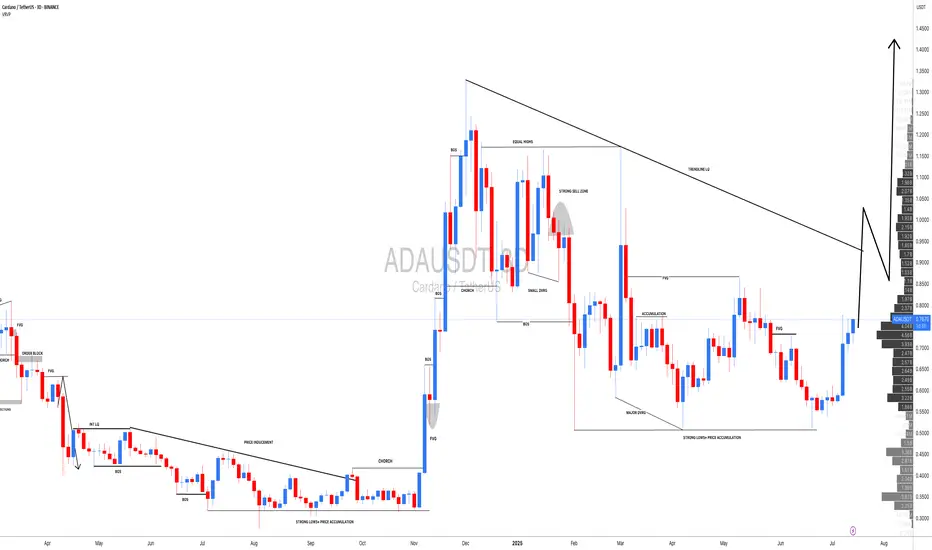
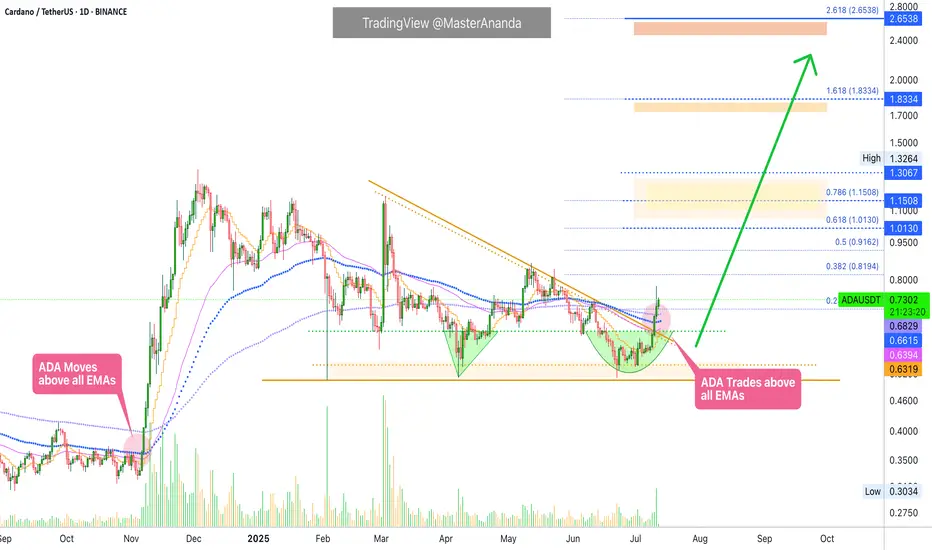
ADA Daily Update · Moving Averages · 262% Target ExposedGood morning my fellow Cryptocurrency trader, I know you are having a wonderful day because the market is doing great. We looked at Cardano together on the weekly timeframe and this is a big picture but what about short-term? Where are prices headed next? The next target, resistance/support and the moving averages of course.
I've been looking at the moving averages lately and this is a theme that I will continue for a few days, or weeks, once we exhaust it we use other indicators. You know we also like the RSI and MACD, candlestick reading, volume, chart structure, chart patterns, market cycle, etc. Marketwide action, subtle signals, market sentiment, on and on.
Cardano is already trading above many major moving averages but this is a recent event. First consider the fact that in late 2024 ADAUSDT grew 320% right after breaking above the same EMAs that I am showing you now.
ADA closed just recently above EMA89, EMA233, EMA55, etc. Only MA200 is missing and this is an important one but will soon break. I am not showing it here because the action is still happening below.
There is a rounded bottom. This alone is a reversal signal already confirmed because the action is happening above the base of the pattern. In April we had a triangular bottom and here we can see an alternation. In February it was a straight line. A straight line, a triangle and then a circle; interesting.
The bullish bias is confirmed and we are seeing straight up, the next target is 0.8194. Cardano has been green four days straight. Go back to November 2024... The possibility exist for continued growth. Day after day after day. At some point there will be a stop, can be a retrace or correction. Know that when this stop happens it is not the end. There will be several stops along the way but we are set for a strong new all-time high. You will need to be patient while holding but just make sure to aim high. Don't get greedy of course. If at some point you start to feel anxious, read on the topic, go out into nature or simple sell a small portion until you feel better. The best choice is to be prepared and this can be done by studying the charts and the market. If you have a good plan and a nice map you will do fine. If you are an advanced trader, I am sorry, let's get back to the chart.
$1.01, $1.30, $1.15. These are all resistance. So there will be some challenge around this price zone. Once it is conquered though the advance should be swift until 1.83. Another stop and then 2.65 which is the main target for 262%. Depending on how this level is handled we will update the chart and the targets. For higher targets look at earlier analyses or those on the weekly timeframe.
Thank you for reading.
Namaste.
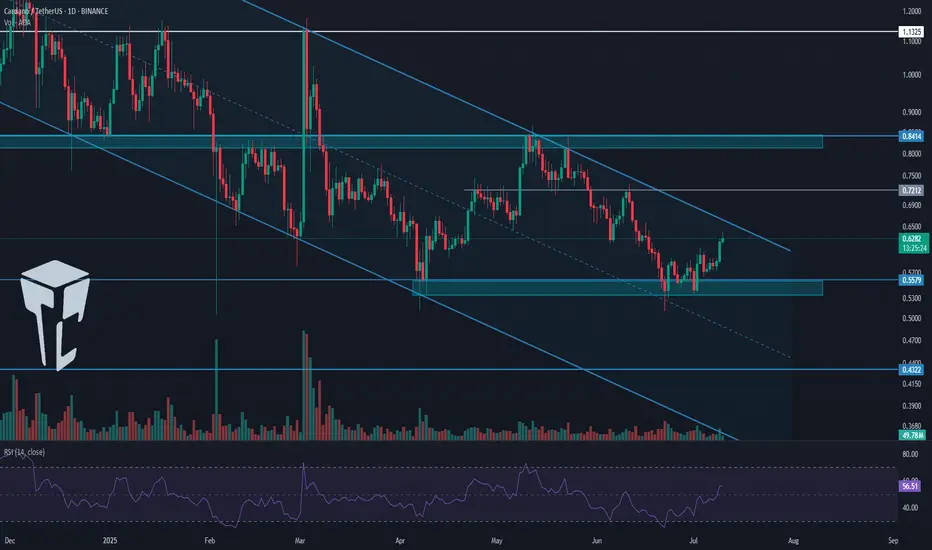
TradeCityPro | ADA Eyes Breakout from Bearish Channel Top👋 Welcome to TradeCity Pro!
In this analysis, I want to review the ADA coin for you. The Cardano project is one of the oldest and most popular projects in crypto.
🔍 The coin of this project has a market cap of 22.21 billion dollars and is ranked 10 on CoinMarketCap.
📅 Daily Timeframe
On the daily timeframe, ADA is moving downward within a descending channel and is currently trying to break out of the channel from the top after reaching a support zone.
⭐ One positive sign for buyers is that they didn’t let the price reach the bottom of the channel. Instead, they used the overlap between the midline of the channel and the key 0.5579 zone (marked as a support area) to stop the price from falling.
✨ However, as long as the coin is fluctuating inside this channel, the trend remains bearish. Holding the midline is not a sign of trend reversal yet, but it does indicate weakening of the current trend and may act as one of the bases for a future reversal.
✅ Looking at the RSI oscillator, we can see that each time the price tried to break the channel’s top, RSI reached the 70 area and got rejected, causing the price to drop.
⚡️ Currently, the price is very close to the top of the channel, but RSI has just broken above the 50 line and is moving upward. This is a bullish sign for buyers, as it shows there is still room for upward momentum, which increases the chance of a breakout.
🎲 The nearest trigger for confirming the breakout from the channel is the 0.7212 zone, which is a bit far, and the price will likely form a higher low and high before reaching it, confirming the breakout earlier.
💥 But based on the current data, the breakout trigger remains at 0.7212, and for spot buying, this is the first valid entry level.
👀 Personally, I’m not adding any altcoins to my portfolio right now, as Bitcoin Dominance is still in an uptrend. As long as this trend continues, large capital flows into altcoins are unlikely.
🛒 More reasonable triggers for spot entries would be a breakout above the 0.8414 supply zone. If I were to buy, I’d enter at this level. The final trigger is 1.1325, which is quite far from the current price, and if BTC Dominance continues upward, it could take several months to reach this zone.
🔽 If you already hold this coin in spot, your stop-loss can be set at a break below the 0.5579 level. A breakdown here would also provide a good short setup in futures, as the price could move toward the bottom of the box or the static level at 0.4322.
📝 Final Thoughts
This analysis reflects our opinions and is not financial advice.
Share your thoughts in the comments, and don’t forget to share this analysis with your friends! ❤️
From Liquidation to Withdrawal, It’s the MapDo you remember your first heavy loss? That exact moment when you realized trading isn’t just about patterns and candles?
This analysis is for you if you’re looking for a path to escape that liquidation pit and actually make your first real withdrawal.
No hype, no signals just a practical roadmap built on experience and mistakes.
Hello✌
Spend 3 minutes ⏰ reading this educational material.
🎯 Analytical Insight on Cardano:
BINANCE:ADAUSDT is testing a crucial daily support near the 0.38 Fibonacci retracement level, setting up for a potential 16% upside toward the key psychological and monthly resistance at $1. If this level holds, ADA could confirm bullish momentum and target higher levels soon. 📊🚀
Now , let's dive into the educational section,
🧭 It All Starts With the Tools
Before anything else, you need a compass and in trading, that compass is made of tools you can actually use on TradingView.
Here are some tools that serious traders never ignore, especially when analyzing crowd behavior and institutional traps:
Volume Profile (Fixed Range)
Shows you where money is actually concentrated, not just where price is. High-volume nodes often become breakout or breakdown zones in days ahead.
Liquidity Zones – Custom Indicators
Search for "liquidity" or "order block" in the Indicators section. There are tons of free community scripts that help you spot stop-loss clusters the exact places where the market loves to hunt.
Relative Volume (RVOL)
Tells you how strong the current market move is compared to its average volume. Is this a real breakout, or just noise? RVOL helps answer that.
Session Volume & Time-Based Boxes
Use drawing tools to box London, New York, or Asia sessions. This lets you track where real money enters. Time matters volume without time is meaningless.
Got the tools? Great. But now what? Let’s walk the path...
🚪 The Entry Point: First Liquidation
Almost every trader starts here: a signal, a rushed entry, a tight stop... then liquidation or a brutal margin call.
But that exact moment? It’s not your failure. It’s the beginning of your real journey.
Ask yourself:
Why did I take that trade?
What tool was available but ignored?
Was my position size reasonable or emotional?
Analyze this moment deeper than you analyze Bitcoin’s chart.
🔁 Repeat or Reroute?
This is the loop most traders never escape.
They stay stuck between losses because they don’t reflect, don’t learn, and don’t adjust.
What you should do instead:
Start a trade journal raw and honest.
Use TradingView as your lab, not just a chart. Practice, backtest, fail, and fix.
🧠 Turning Point: Where Your Mind Starts Trading
Once you stop chasing profit and start chasing clarity, things shift.
You begin spotting real triggers, real volume, and real market intent.
Here’s where tools become meaningful:
Use OBV to confirm volume alignment
Let RSI tell you about weakness before reversal
Follow EMA50/EMA200 to map trend structure
Not because someone told you to but because now you know why and when to use them.
🤑 The First Real Withdrawal Isn’t From Your Wallet
The first "withdrawal" isn’t a bank transfer.
It’s when you can walk away from the market without FOMO, without guilt, and without overtrading.
You now:
Accept risk, every single trade
Respect the market, not fear it
Have patience not because you're lazy, but because you understand timing
That’s the real payout.
📌 Final Thoughts
The path to becoming a trader starts with loss, grows with tools, and ends with discipline.
TradingView isn’t just for charts it’s your practice field.
Before chasing the next win, start by understanding your last mistake.
✨ Need a little love!
We pour love into every post your support keeps us inspired! 💛 Don’t be shy, we’d love to hear from you on comments. Big thanks , Mad Whale 🐋
📜Please make sure to do your own research before investing, and review the disclaimer provided at the end of each post.

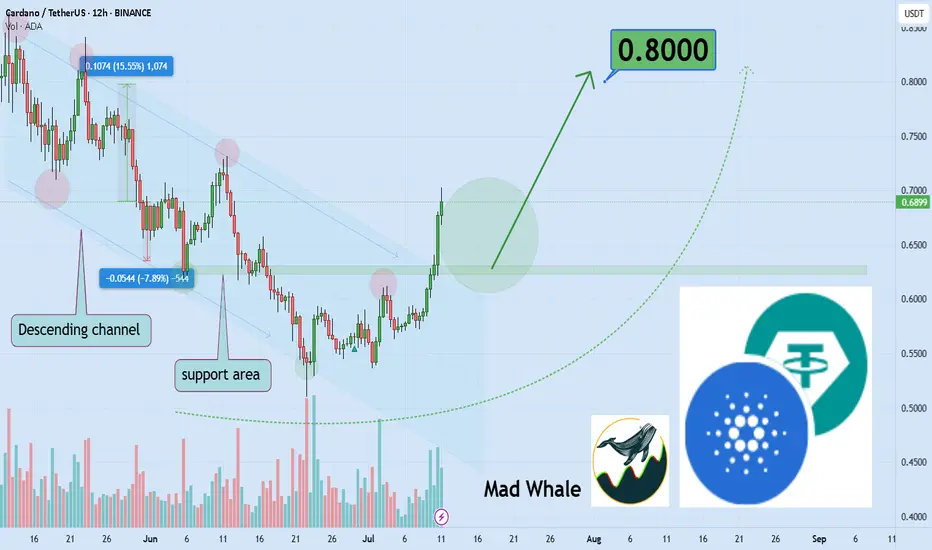
Will Cardano’s breakout drive a 15% surge to $0.80?Hello✌
let’s dive into a full analysis of the upcoming price potential for Cardano 📈.
BINANCE:ADAUSDT has broken out of its descending channel with strong volume, indicating a potential bullish reversal. Price is currently near a key support level, setting the stage for further upside. A move toward the $0.80 target, offering at least 15% gain, looks likely. 📊🔥
✨ Need a little love!
We pour love into every post your support keeps us inspired! 💛 Don’t be shy, we’d love to hear from you on comments. Big thanks , Mad Whale 🐋
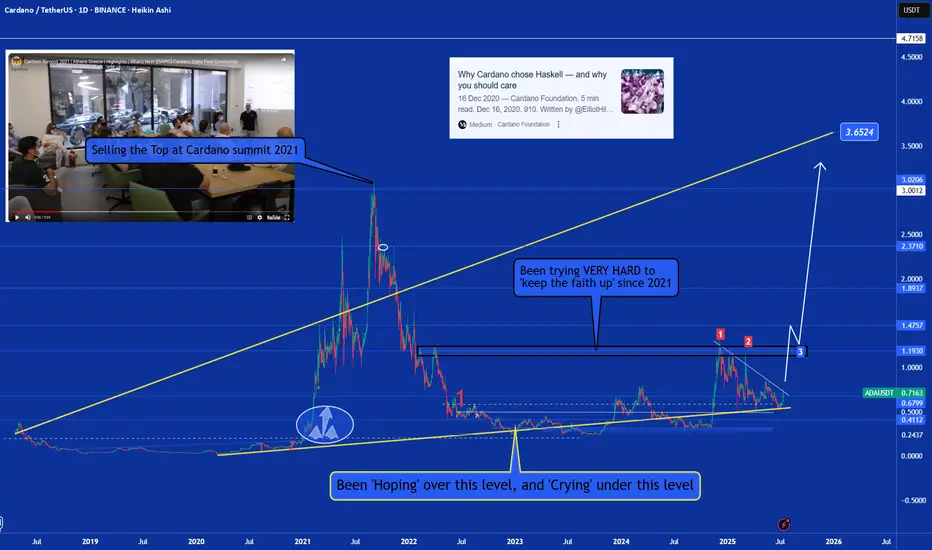
Cardano: Still Boring or Finally Ready to Move?🧐🔁 Cardano: Still Boring or Finally Ready to Move? 🚦📈
Welcome to the Altcoin Series, kicking off this weekend with none other than Cardano (ADA).
Later on I will explain why i will be 'Divorcing Alts' and just trade them, but that time will be at the cycle end, not now.
It’s Saturday, July 12th — a classic retail weekend after a solid macro pump. Salaries are hitting accounts, the charts are alive again, and it's time to look at structure over sentiment.
🔍 A Personal Note on ADA
I was fortunate to exit near the top during the Cardano Summit in Athens (2021) — not just due to chart structure, but after meeting with developers and understanding how deeply Haskell shapes this ecosystem. And what a challenge that seemed!
Haskell, while academically impressive, has proven difficult to scale, and in practice, it's slowed down development. Expectations were sky-high, but reality hit hard. And let’s be honest — Cardano has been boring for years.
But that boredom may be hiding something...
I’ve still been 'going Long' under key levels, because when you zoom out — Cardano is still U.S.-centric , regulation-aware, and deeply rooted . In a time when the U.S. might look to lead crypto adoption, especially with figures like Trump signaling support , Cardano could become part of that narrative.
⚙️ Technical Setup
The recent pump from Nov–Dec 2024 was rejected right at $1.193 — our second test of that critical resistance. But now, we’re staring down a potential third test, with Test #3 marked on the chart near $1.15, and this time, the context is shifting.
✅ TOTAL3 structure is bullish
✅ Retail energy is back
✅ Altcoin momentum is quietly building
🔑 Key Levels
Support Zone:
🟢 $0.70–$0.71 — the current base to hold
Target Zones:
🔹 $1.15–$1.19 — Third test of resistance
🔹 $1.47
🔹 $1.89
🔹 $3.02
🔹 Top Extension Target: $3.65
A break above that descending level could turn this "boring" coin into one of the cleanest long continuation setups of the cycle.
📌 We trade technicals, not hope:
✅ Buy over support
✅ Exit under resistance
✅ Control risk, always
So… will Cardano keep boring us? Or is it finally time for a show?
One Love,
The FXPROFESSOR 💙
ADA Analysis (3D)Here’s another clean and straightforward chart, this time on Cardano (ADA).
ADA has formed a large flag pattern, which looks poised for a breakout soon.
Just like the previous setup, nothing complicated here.
✅ Entry Idea:
Consider entering when the price breaks above the previous daily candle’s high.
All the key levels are already marked on the chart for easy reference.
Keep it simple,
Good Luck.
ADA - Monitor BreakoutWe have already seen ADA breakout of its symmetrical triangle, but if BTC does have a downswing we could see ADA retest the triangle as support to provide entries.
Retest would most likely align somewhere between $0.72-$0.74.
However the 1D RSI is showing tremendous strength with the bounce from the 70 level, so if there is no retest and price continues to breakout, our primary target would be around $1.14.

ADA is Still in Discount of the Discount by Lord MEDZ
As of the July 2025 monthly close, ADA/USDT remains deep in the discount zone—more precisely, within the lower 25% of the discounted portion of the overall Dealing Range. At a current price of $0.79, ADA is still presenting what I view as a high-R multiple opportunity, technically speaking.
The monthly chart shows that price has decisively respected the 50% Consequent Encroachment level of the previous monthly Fair Value Gap (FVG). This happened after a clean breakout and retest of the buy-side imbalance, confirming bullish intent from a macrostructure standpoint.
We are still significantly below the midpoint (50%) of the Dealing Range, with a long-term projection target of around $5.13, which represents a potential move of approximately 658% from current levels. That would take us back to the high of the Dealing Range, where premium pricing begins to dominate.
Key Highlights:
Current Price: $0.79
Dealing Range High Target: ~$5.13
% Move to High: ~658%
Context: Monthly structure, liquidity considerations, and premium/discount framework
Market Condition: Post-gap retest, structure remains bullish while in deep discount
This setup aligns with my long-term bias while ADA remains deeply discounted. Still, as always:
This is for my personal journaling purposes only. Not financial advice. Always DYOR.
— Lord MEDZ

Cardano Ultra Bullish Confirmed, $1.83 Next (Easy) TargetThis is it. This is the signal you've been waiting for and the strongest possible signal across the Cryptocurrency market. Cardano is now moving above MA200 on the weekly timeframe, on a full green candle, as Bitcoin produces a very strong new all-time high. Simply put, this is the best ever.
Cardano has been testing the same low since early February, for five months. Five months and this support held nicely and now the action is turning green. The correction is over; consolidation is over, now comes the resumption of the bullish wave.
The bullish wave will produce a major, major, higher high compared to early December 2024, a target of $1.83 in the coming months and this is not all. This is not the end of the bull market nor the bullish wave, this is just the start, mid-portion, we are set to experience growth long-term.
You can go all-in now. The altcoins bull market is already confirmed. Bullish momentum will start to grow. Feel free to buy and hold.
Thanks a lot for your continued support.
Namaste.
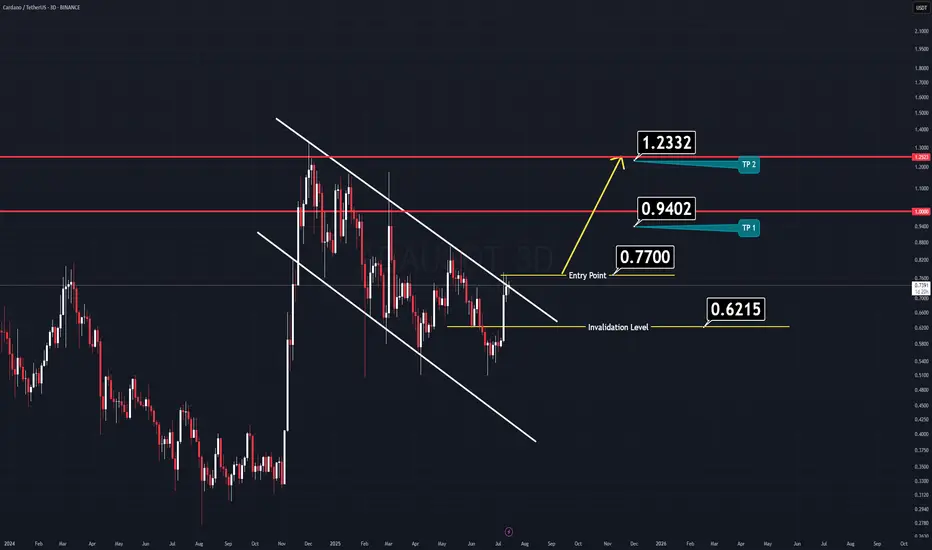
ADA: Keep an eye on this setup!If you're looking to trade ADA at the moment, here's a quick setup that you might find helpful!
The idea is: Buy when the price breaks above $0.775 and take profits at the levels shown in the chart.
Targets:
1. $0.82
2. $0.9
3. $0.98
-------------------------------------------
About our trades:
Our success rate is notably high, with 10 out of 11 posted trade setups achieving at least their first target upon a breakout price breach (The most on TW!). Our TradingView page serves as a testament to this claim, and we invite you to verify it!

ADA/USDT – Bullish Breakout & Retest ConfirmedCardano (ADA) has broken out of a long-standing descending channel and successfully retested the breakout level, showing signs of strong continuation.
Key Observations:
Price broke above the upper trendline of the multi-month falling channel
Retest of breakout zone around 0.74 held firmly
Momentum building after reclaiming key resistance at 0.8158
Entry: Current zone around 0.74–0.75 (post-retest)
Targets:
0.8158
1.0876
1.3159
1.8958
Final target: 2.7652
Stop Loss: Below 0.70 (based on retest invalidation)
This setup has a macro upside potential of over 285% based on the channel breakout projection.
As long as ADA holds above the breakout zone, this structure remains valid and could lead to a sustained rally.
DYOR | Not Financial Advice
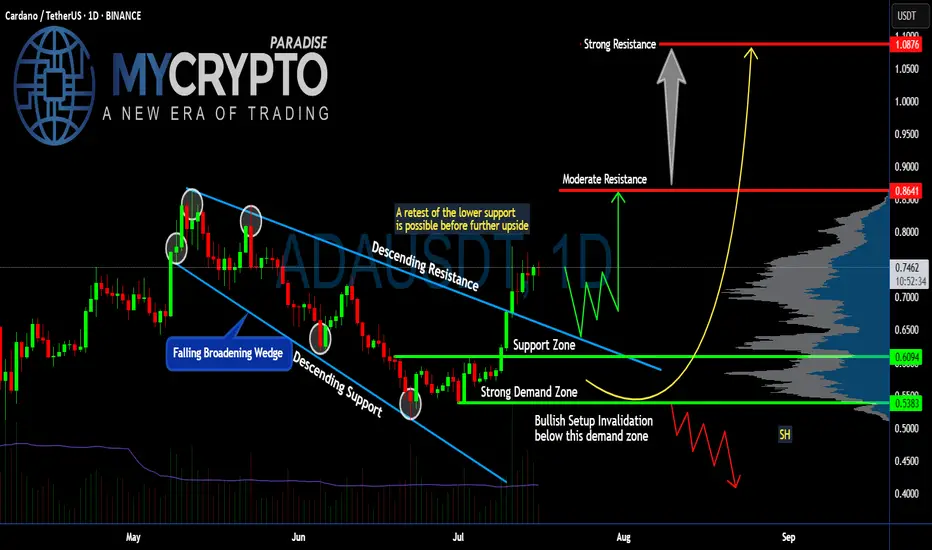
Is #ADA Ready For a Major Move or a Trap is Ahead? Watch this Yello, Paradisers! Is this breakout on #Cardano the start of a major upside move or just another bull trap waiting to flush out impatient traders? Let’s break down the latest #ADAUSDT setup:
💎After weeks inside a falling broadening wedge, #ADA finally broke above the descending resistance, signaling a potential trend reversal. The breakout above $0.70 has pushed the price toward the current $0.74 zone. The soaring volume and a positive broader market outlook reinforce our bullish bias. While this looks bullish, the key question is whether #ADAUSD will hold above its reclaimed support or retest lower levels first.
💎The structure is straightforward: #ADA reclaimed the support zone around $0.70 after bouncing strongly from the demand zone near $0.61–$0.60. This demand zone remains the critical area to watch—any healthy retest here would provide a high-probability continuation setup for bulls.
💎If buyers maintain control, the first target sits at the moderate resistance of $0.86. That’s where the next notable selling pressure is expected. But the real battle will take place near the strong resistance at $1.08—a zone where major distribution and profit-taking could occur.
💎However, the bullish setup becomes invalid if #ADAUSD loses the $0.61–$0.60 demand zone. A confirmed close below $0.538 would flip the structure bearish, signaling a potential continuation to lower lows.
Stay patient, Paradisers. Let the breakout confirm, and only then do we strike with conviction.
MyCryptoParadise
iFeel the success🌴
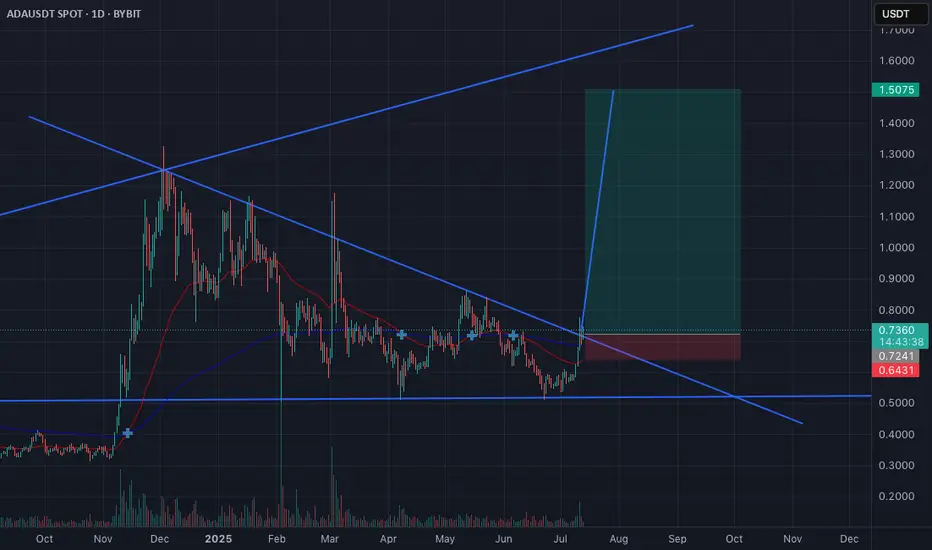
ADA LONG TRADE ADA has broken out of its long-term wedge pattern and looks poised for a move higher. With such a strong risk-to-reward setup, the trade makes sense even without a large position—especially important given the uncertainty around current tariff discussions.
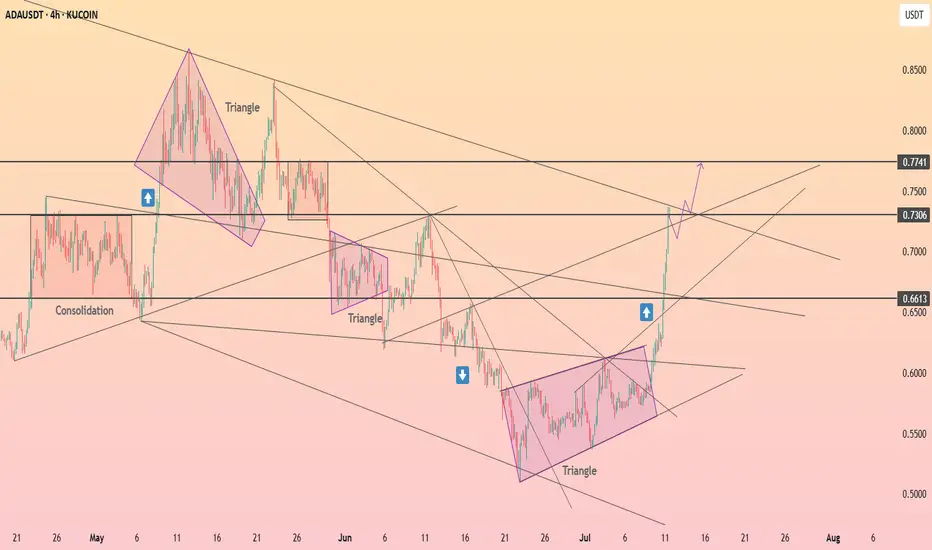
HolderStat┆ADAUSD seeks to $0.774KUCOIN:ADAUSDT recently broke out of a multi-week triangle formation on the 4H chart. The clean break above 0.66 has invalidated the previous downtrend and triggered a new leg higher. With ADA currently riding within an ascending channel, the path toward 0.73–0.75 remains open as momentum continues building.