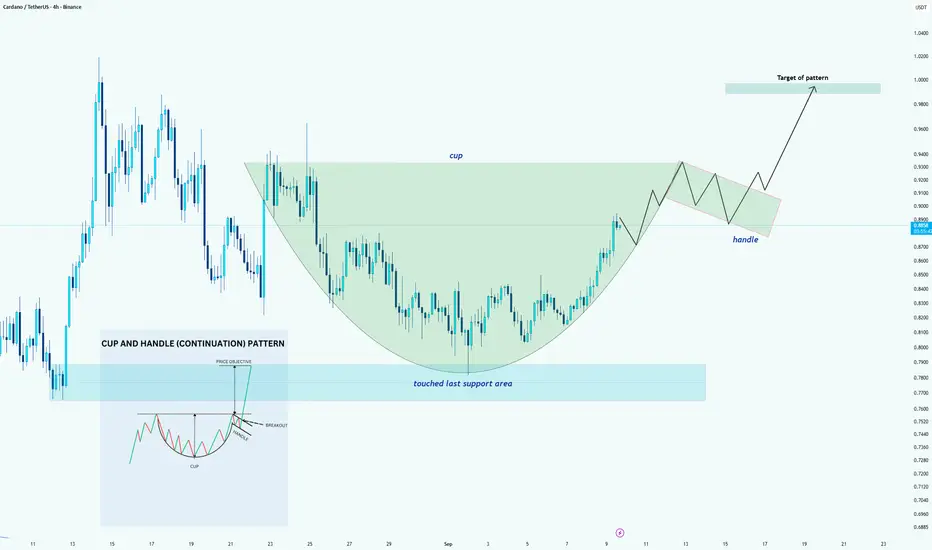
ADA/USDT – Cup & Handle PerspectiveHello guys!
Currently, the chart is showing the formation of a potential cup and handle pattern. The rounded bottom of the cup has already developed, suggesting that market participants are gradually regaining buying interest after the recent decline.
However, it’s important to note that:
The handle has not yet formed, and
A breakout confirmation is still missing.
This means the pattern is not yet validated —> it’s only a perspective and assumption at this stage. For the setup to confirm, we would need:
A consolidation forming the handle, and
A clean breakout above the neckline area.
If the breakout occurs with solid volume, the measured target of the pattern could push the price toward the $1.00 level, which also aligns with psychological resistance.
ADAUSDT trade ideas
From First Trade To Endless Cycle Of Loss (Trading Addiction)Most traders step into the market with a simple thought: “ Just one trade. ”
But when that first small position turns green, the brain celebrates with a rush of dopamine. That sweet moment tricks you into believing you have figured the market out. What feels like confidence is often the first step into a dangerous spiral : the trading addiction cycle.
Hello✌️
Spend 2 minutes ⏰ reading this educational material.
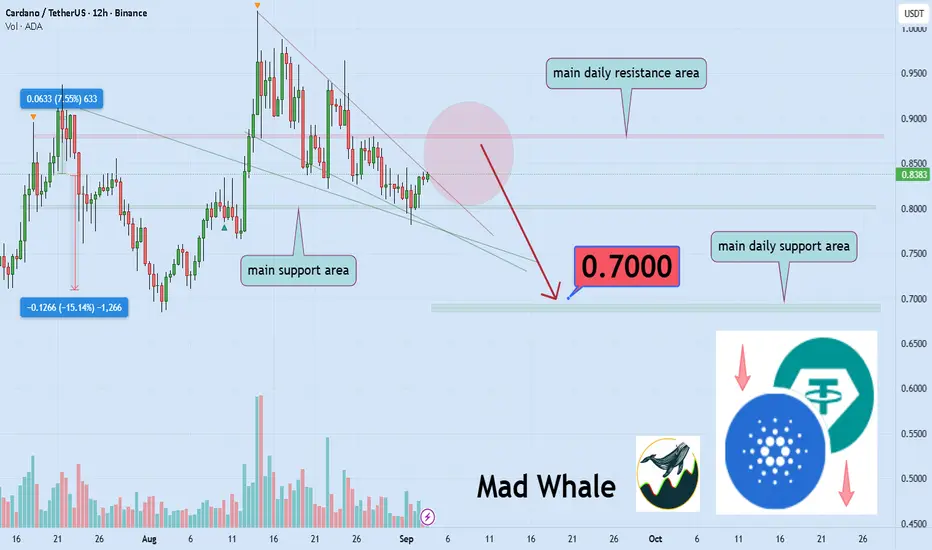
🎯 Analytical Insight on Cardano:
BINANCE:ADAUSDT has lost all key Fibonacci support levels 📉 and is approaching a major daily resistance. If the primary support, clearly marked on the chart, breaks, a drop of at least 15% could follow, targeting around $0.70 ⚠️.
Now , let's dive into the educational section,
🎯 Where It All Begins
It usually starts with harmless intentions like learning, experimenting, or just testing luck. The first quick win feels powerful. The brain records this victory as proof of skill, when in reality it’s often pure randomness. Instead of analyzing why the trade worked, traders rush to repeat the sensation of winning. That’s the invisible first hook.
💡 The Illusion of Small Success
Cognitive bias magnifies those early wins. Traders convince themselves they’ve cracked the code while the truth is they’ve only tasted noise. They stop focusing on analysis and instead chase the feeling. This is how harmless wins plant the seed of reckless entries, random positions, and overconfidence.
🌀 From Wins to Losses
After a few quick wins, overconfidence expands. Position sizes grow. That’s when the market turns. A simple correction wipes out days of profits, triggering the revenge-trading loop. The trader is no longer trading the chart; they’re trading their emotions.
⚠️ The Danger Zone
At this point, discipline disappears. The trader acts like a gambler chasing losses. Risk management is ignored, leverage climbs, and desperation sets in. The spiral accelerates until the account balance is drained.
🧩 The Role of Greed
Greed fuels this engine. After every gain, the brain whispers “more.” After every loss, it screams “get it back now.” That voice is why traders hold too long, re-enter too quickly, and burn capital faster than they ever expect.
🛡 The Real Meaning of Security
Many assume capital security is about wallets or exchanges. In reality, the biggest threat to your money is your own undisciplined mind. Safe investing means protecting yourself from yourself first. Without risk control, even the safest assets vanish.
🔄 The Endless Loop
Every loss tempts another entry. Every failed entry creates the belief “the next one will fix it.” This cycle is how most beginners and even many experienced traders lose their accounts long before they learn discipline.
🧭 The Way Out
Breaking free isn’t about finding a magic indicator or signal. The only way is a structured system, hard rules, and loyalty to them. Discipline is the seatbelt that keeps you alive when the market crashes. Without it, no strategy can save you.
🕹 TradingView Tools Against the Addiction Cycle
This is where TradingView tools can step in like a safeguard.
Alerts: Instead of staring at charts and forcing trades, let alerts call you only when your setups trigger.
Position Size Calculators and custom scripts: They prevent oversized entries that come from emotional overconfidence.
Volume Profile: Reveals zones where serious money moves, giving logic to your trades instead of raw impulse.
Trading Journal on charts: Annotating your own trades makes behavioral mistakes visible, showing you how emotions repeat.
These tools don’t just provide technical data. They create practical boundaries that break emotional patterns before they become addiction.
📌 Three Pieces of Advice to Escape the Trading Addiction Cycle
No profit is worth an undisciplined entry: If your only reason is “it feels right,” that trade is already lost.
Capital is sacred: Protect your principal above all. Profits come and go, but once the core is gone, the game ends.
Discipline beats strategy: The strongest traders are not the smartest, but the most consistent.
✨ Need a little love!
We pour love into every post your support keeps us inspired! 💛 Don’t be shy, we’d love to hear from you on comments. Big thanks , Mad Whale 🐋
📜Please make sure to do your own research before investing, and review the disclaimer provided at the end of each post.
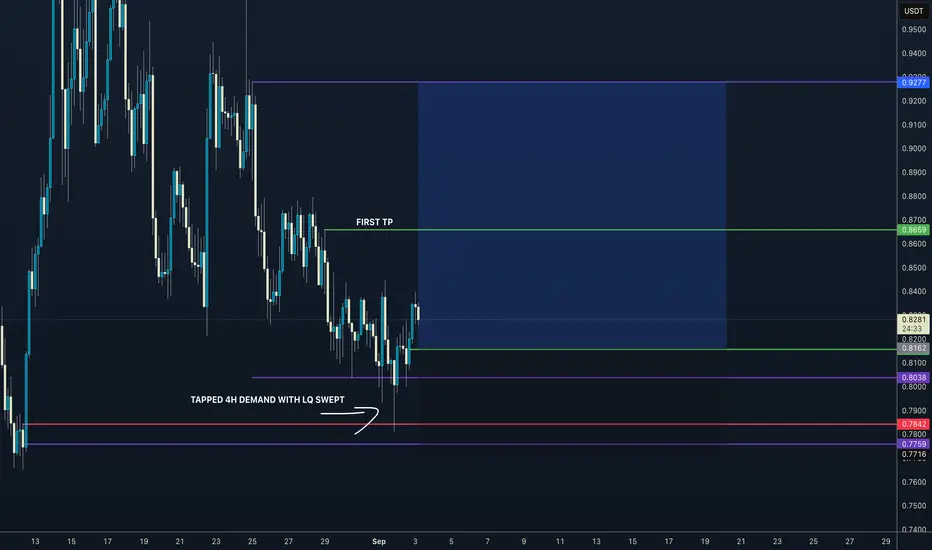
ADA WEEKLY LONGADA has tapped 4H while swept liquidity.
Weekly range has also been showed because previous weeks LQ has been swept and the weekly closed under the weekly close.
Im waiting for the next volumized OB to be tapped, this is seen with the green line on the chart as that would be my entry
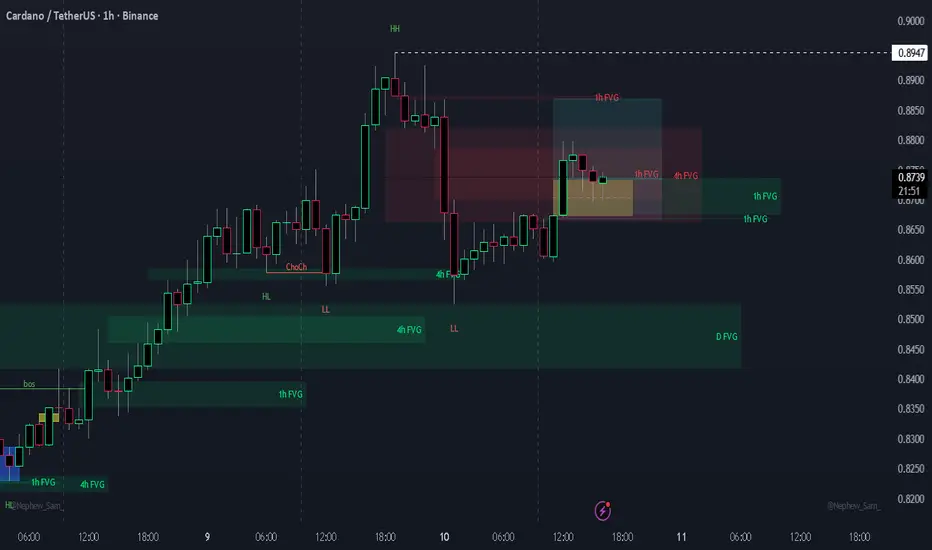
ADA/USDT 1HR time-frame
Coming off a BULLISH, DAILY FVG and painting a fresh, 1HR FVG, while respecting ORDERFLOW.
ADA/USDT, looks primed to challenge a 1hr BEARISH FVG and possibly yesterday's high.
🚩 Invalidation: If the Daily FVG breaks with a clear breakaway candle, this setup is void.
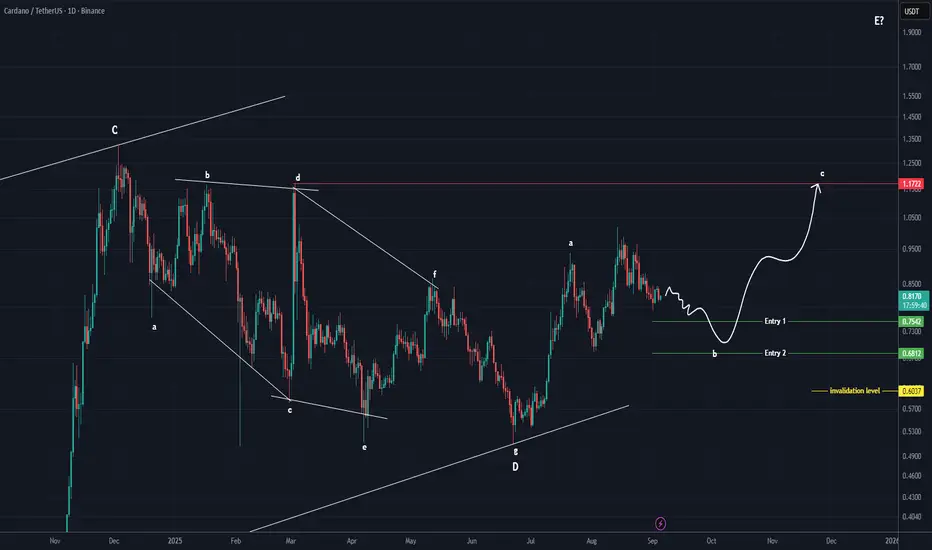
ADA Buy/Long Setup (1D)Cardano, in our view, is currently within a major bullish structure, with wave D having just completed.
It now appears that the price is inside bullish wave E.
We have identified two specific entry levels for re-entering Cardano. At each entry level, you can take one step into a buy position.
The target is around \$1.20.
Please note that this analysis is based on the daily timeframe, so it may take some time to play out.
The invalidation level is the same as our stop loss. If this level is reached, the setup will be invalidated.
For risk management, please don't forget stop loss and capital management
Comment if you have any questions
Thank You
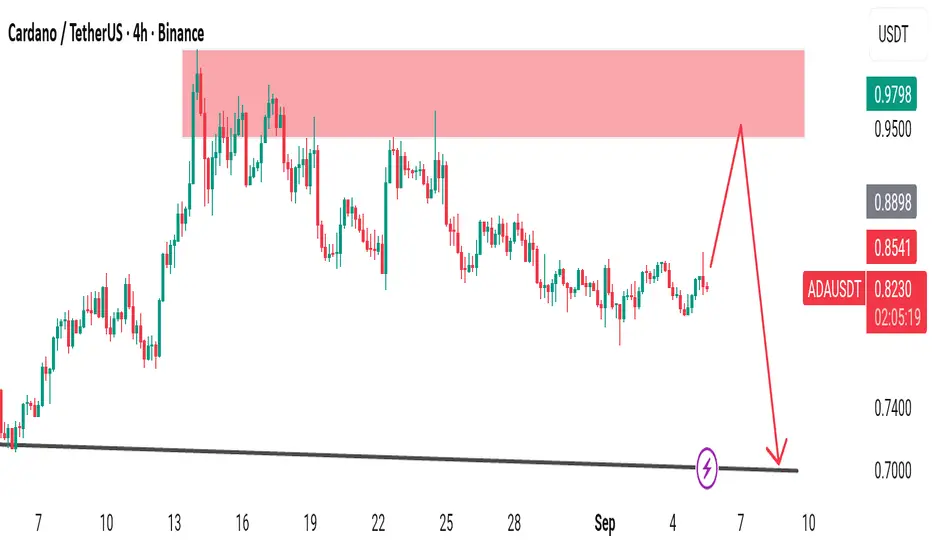
Cardano (ADAUSDT) 4H – Rejection Zone Ahead?Cardano has been trading sideways but is approaching a major supply zone (0.85 – 0.95).
This red area has acted as strong resistance in the past, and a fresh rejection here could trigger a sell-off back toward 0.70 support.
🔴 Resistance Zone: 0.85 – 0.95
⚫ Support Zone: 0.70 – 0.72
📉 Bias: Bearish if rejection confirms.
---
💭 What do you think, ADA traders?
Will Cardano break above the red zone this time? 🚀
Or are we set for another rejection and deeper drop? 📉
Drop your thoughts below 👇 and don’t forget to hit like ❤️
---
👉 This structure makes it:
Simple (levels marked clearly).
Engaging (questions force replies).
Sharable (clean chart, clear idea).
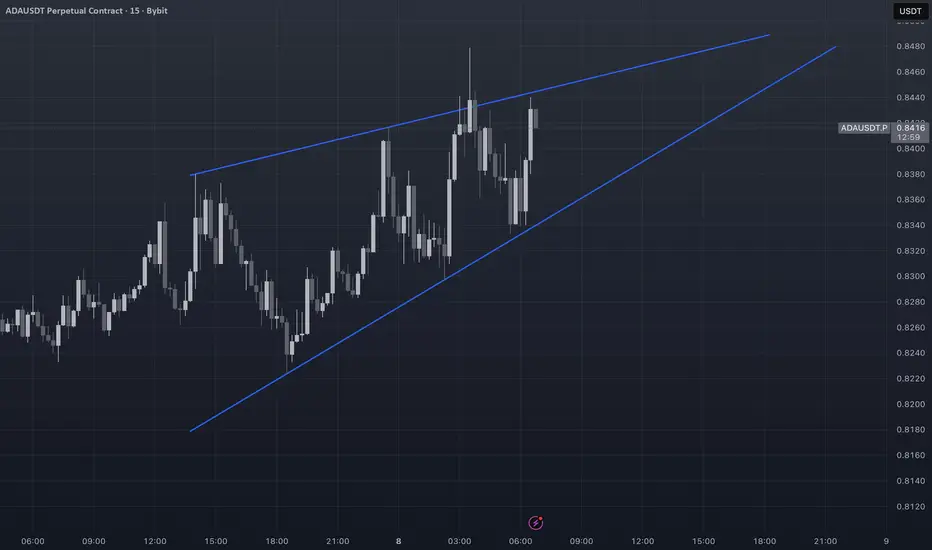
Ada on 15 min chartAnother bearish pattern forming on the 15 min chart can be a good daytrade/scalp if it close below the pattern .
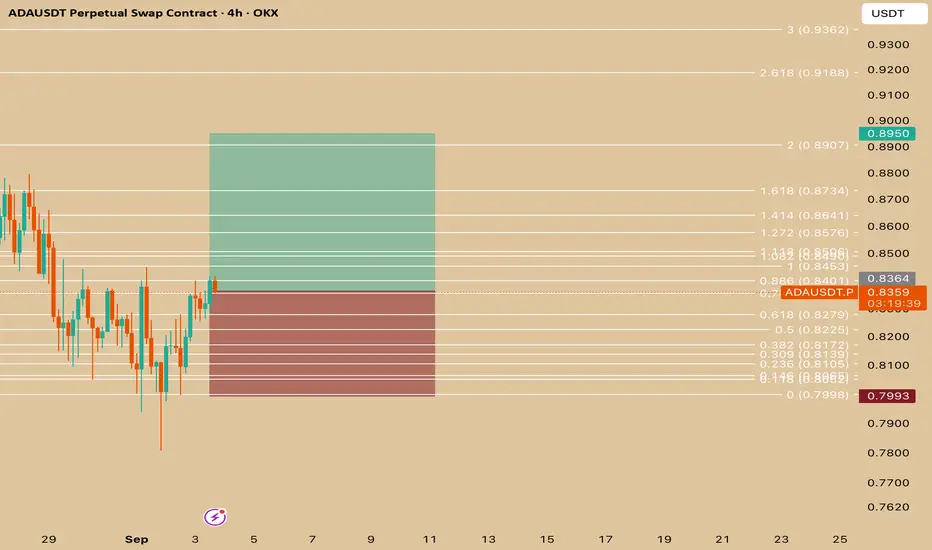
ADA/USDT1. Pair and Timeframe
Asset: ADA/USDT (Cardano vs. Tether)
Timeframe: 4-hour (H4)
Exchange: OKX (Perpetual Swap Contract)
2. Chart Tools Used
Fibonacci retracement & extension levels: Drawn across a recent move to identify potential support, resistance, and target areas.
Risk-to-reward setup: Green (take profit zone) and red (stop loss zone) box mark the trade plan.
3. Trade Setup
Entry Zone: Around 0.836 USDT (current price).
Stop Loss: Around 0.799 USDT (bottom of red box, just below the 0 Fibonacci level).
Take Profit: Around 0.895 USDT (top of green box, close to the 2.0 Fib extension).
4. Idea Behind the Trade
Price bounced from the 0.618–0.786 Fib retracement area (a common reversal zone).
The trader is betting that ADA will continue upward toward the 1.618 – 2.0 Fibonacci extensions.
The risk-to-reward ratio looks favorable (roughly 1:2 or better).
5. Key Levels
Support levels:
0.827 (0.618 Fib)
0.810 (0.236 Fib)
0.799 (strong support, stop loss area)
Resistance levels / targets:
0.857 (1.272 Fib)
0.873 (1.618 Fib)
0.890 (2.0 Fib, main TP)
0.918+ (extended target if bullish momentum continues)
✅ In summary:
This is a long trade setup on ADAUSDT. The trader expects ADA to move higher from ~0.836 toward 0.895 (and possibly beyond), while limiting downside risk with a stop loss below 0.80. The strategy is based on Fibonacci retracement/extension levels and recent price action structure.
Do you want me to also calculate the exact risk-to-reward ratio (RRR) for this trade using the entry, stop, and target?
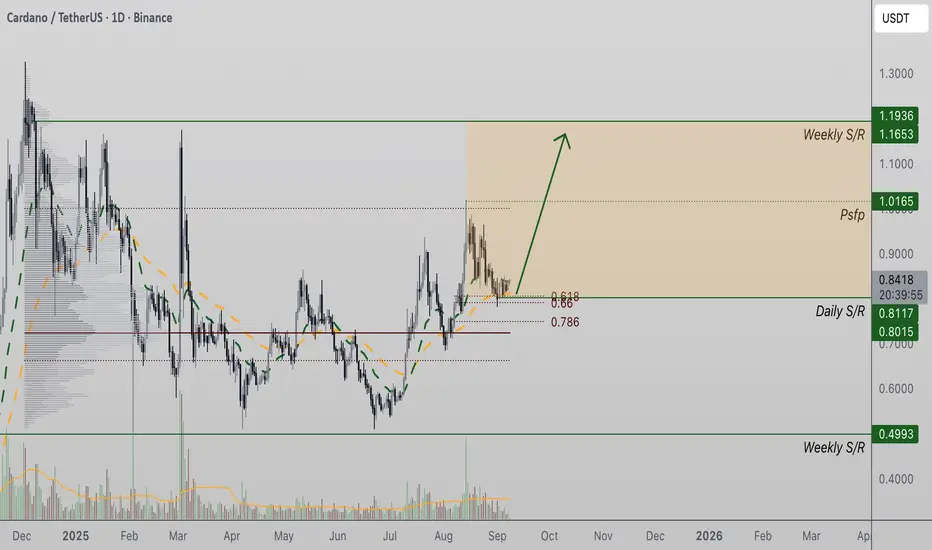
Cardano (ADA) Defends $0.81 Support, Targets $1.16 and BeyondADA price action has shown resilience at $0.81, a level supported by both the 0.618 Fibonacci retracement and daily timeframe structure. This confluence provides a strong foundation for bullish continuation, keeping the market structure intact despite the recent corrective move.
ADA Key Technical Points
- Support Zone: $0.81 combines 0.618 Fibonacci support with daily structural demand.
- Upside Targets: Initial objective lies at $1.16, with a broader target of $1.19.
- Market Structure: Higher highs and higher lows confirm ADA’s ongoing bullish trend.
Analysis
The $0.81 region has become a pivotal level for ADA. Its alignment with both Fibonacci and daily support makes it a strong foundation for price to base upon. The repeated ability of this area to absorb sell pressure highlights demand and reinforces the bullish narrative, even as volume temporarily declines.
From a structural perspective, Cardano continues to print higher highs and higher lows, confirming the strength of its bullish trend. Corrective moves into key support zones such as $0.81 are considered healthy resets within an uptrend rather than signals of exhaustion. This pattern of accumulation suggests buyers remain firmly in control of the broader trend.
Looking forward, the $1.16 region represents the next significant upside target. A decisive break above this level would further validate the bullish structure and clear the path toward $1.19. Both targets align with previous resistance levels and Fibonacci extension objectives, providing a clear roadmap for continued expansion once momentum returns.
What to Expect in the Coming Price Action
As long as $0.81 support holds, ADA remains firmly bullish. A rotation toward $1.16 appears likely, and a breakout beyond that level could drive price action toward $1.19 in the short to mid-term.
$ADA - bullish area above 0.800$ support. CRYPTOCAP:ADA - bullish area above 0.800$ support.
Back to 1.00$ soon? 📈
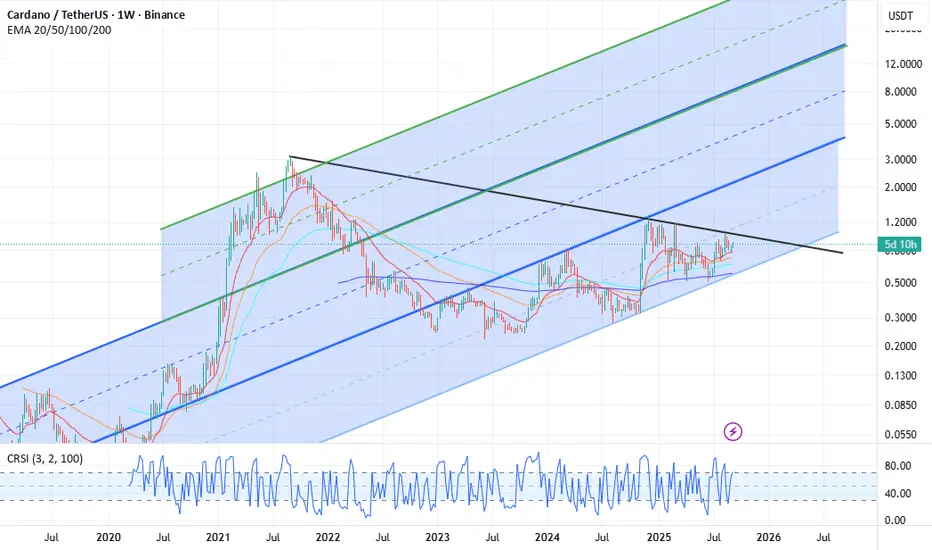
Cardano Ready for a Major Move – Huge Potential for $ADACardano has significant potential, but from a technical perspective we still need to see a decisive confirmation candle above the black trend line before a sustained breakout can be confirmed. If we break this trend line with strong momentum, the next mid-term targets are $1.20 and $1.60.
On the fundamental side, there is a strong pipeline of catalysts: BTC DeFi on Cardano enabled by its shared UTXO structure, the upcoming Leios upgrade for scalability, Hydra L2 for faster transactions, and the launch of the first Cardano partner chain Midnight, which focuses on privacy and selective disclosure to meet enterprise demand.
Looking further ahead, the possible targets for 2026 are in the $3 to $8 range, which align with the mid-line of the second ascending channel.
Considering both the technical setup and the fundamentals, I see substantial upside potential for Cardano in late 2025 and into 2026, with the possibility of outperforming BTC, ETH, and SOL as adoption and utility expand.
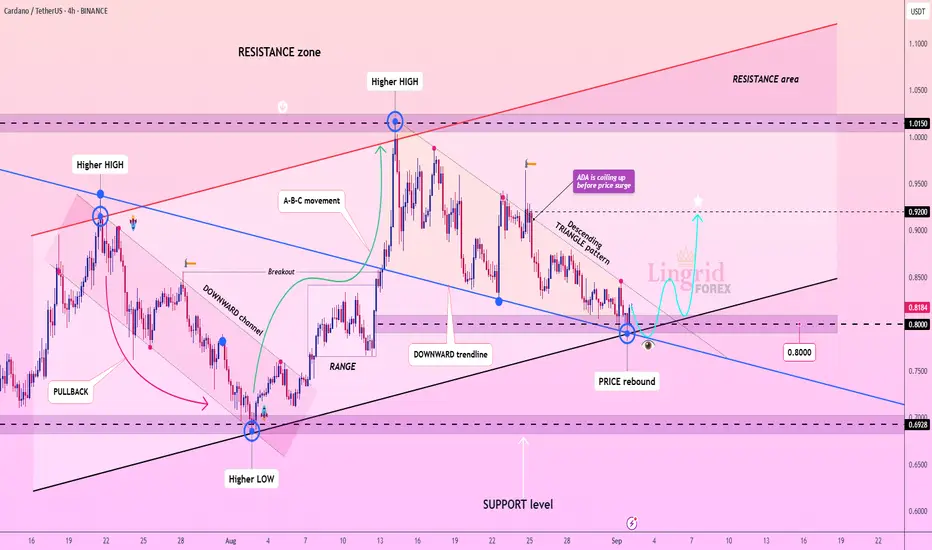
Lingrid | ADAUSDT Bullish Continuation Pattern From Key LevelBINANCE:ADAUSDT is rebounding from the $0.8000 support after retesting a descending triangle structure. The chart shows an upward projection forming after the price defended higher lows against the downward trendline. As long as $0.8000 holds, the outlook points to a continuation toward $0.9200. This setup aligns with broader bullish recovery momentum from the higher-timeframe support zone.
📉 Key Levels
Buy trigger: Break and hold above $0.8500
Buy zone: $0.8000–$0.8200
Target: $0.9200
Invalidation: Close below $0.8000
💡 Risks
Breakdown of $0.8000 support would invalidate bullish momentum.
Macro-driven weakness in risk assets could pressure ADA.
A sharp Bitcoin reversal could drag altcoins lower regardless of local setup.
If this idea resonates with you or you have your own opinion, traders, hit the comments. I’m excited to read your thoughts!
Cardano (ADA): Still Bullish | Price Above Moving AverageCardano (ADA) has been repeating the same pattern for years now — strong accumulation, reclaim of EMAs, and then explosive upside moves.
If history continues to rhyme, the recent reclaim near $0.80 might be setting up the next big leg up. Previous recoveries from similar zones have given us +160% to +240% gains, and if this momentum continues, we could be looking at another 200%+ run from here.
More in-depth info is in the video—enjoy!
Swallow Academy

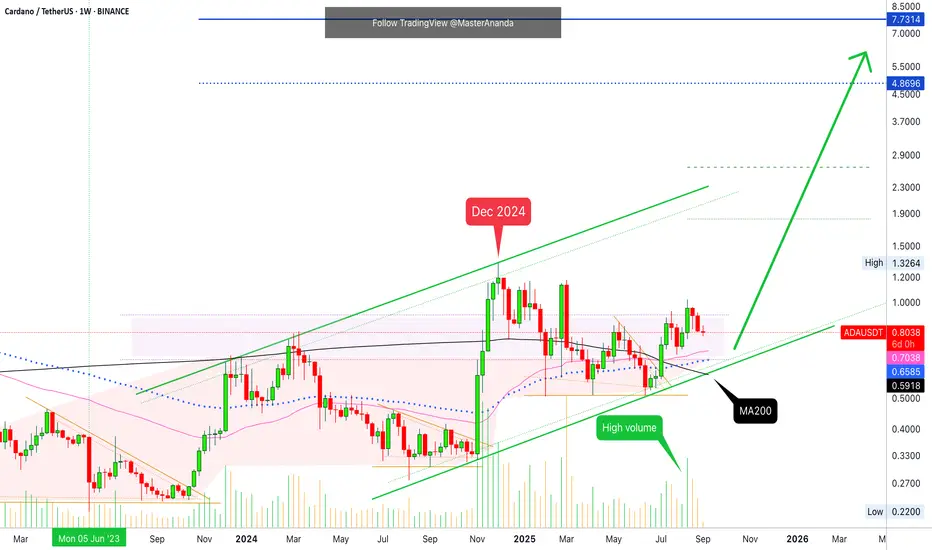
Cardano Above Support, Safe · Bullish Action Will ContinueHere we have Cardano with a bullish chart and market conditions.
ADAUSDT weekly has been trading above EMA55, EMA89 and MA200 for weeks. Seven weeks to be exact. As the action happens above these levels, bearish momentum and sellers pressure has been very weak. Naturally, weak bearish action favors the bulls.
The highest volume bar since the strong March drop and rejection happened in August and it was bullish. Two weeks closed red recently and yet again there is low bear volume.
EMA55/89 and MA200 long-term are just too strong support. These are not being tested by the way. Three weeks red and yet ADAUSDT continues with local higher lows and ready to grow.
These weeks are just a small pause, which is great. When the market is growing long-term as ADA is doing, there is never any hurry, the market grows but fluctuates with prices rising and dropping with the classic upward bent.
Remember, Cardano has been growing since June 2023, it is a rising trend. The last major move and high was an advance that ended in December 2024.
It's been nine months. This is all the consolidation we need for a new and strong advance.
An advance tend to happen every 6-10 months. 10 months being the maximum and Cardano is now at 9. You know what this means? We are getting very close.
2025 produced a triple-bottom pattern. This is a very strong bullish signal.
The 16-June 2025 week (22-June) marks the final low and the break above MA200 7-July marks the start of the 2025 bull market bullish wave.
Cardano is already, right now, on a path to hit a new all-time high. This will be happening within a few months at max—or less.
Thank you for reading.
Namaste.
ADA/USDT 1W chartbreakout.................................
support $ 0.234
TARGETS ARE GIVEN IN THE CHART
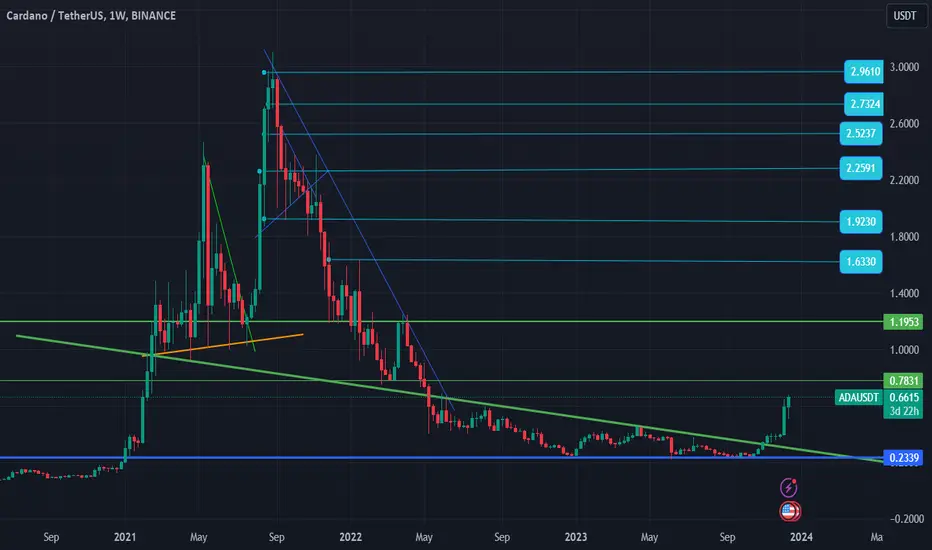
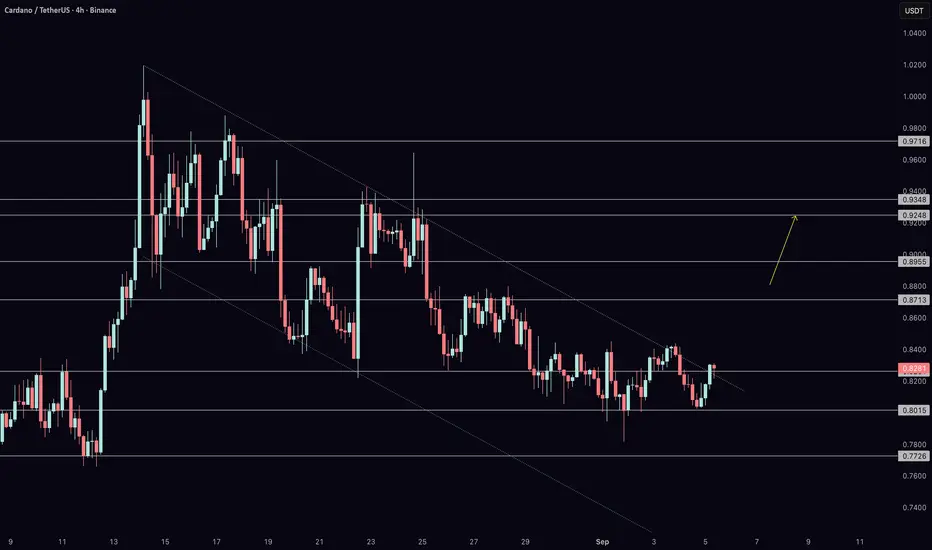
Cardano (ADA) Cardano (ADA) is showing potential for an upward move towards the $1.1882 price level.
This move could be initiated by a break of the downtrend line, drawn from point C (part of the highlighted price pattern). Traders should wait for a confirmation of this trendline break with high trading volume to increase the likelihood of this scenario succeeding.
Good luck
NEoWave Chart
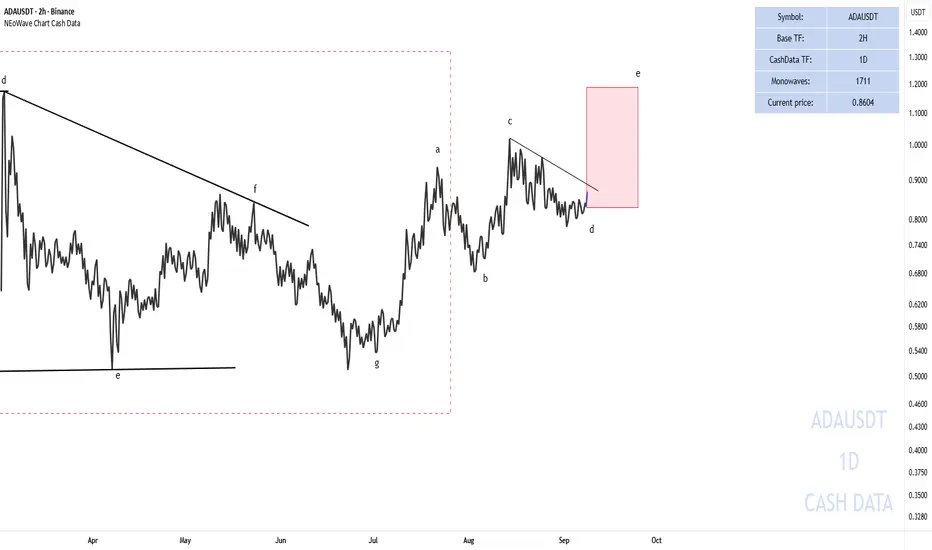
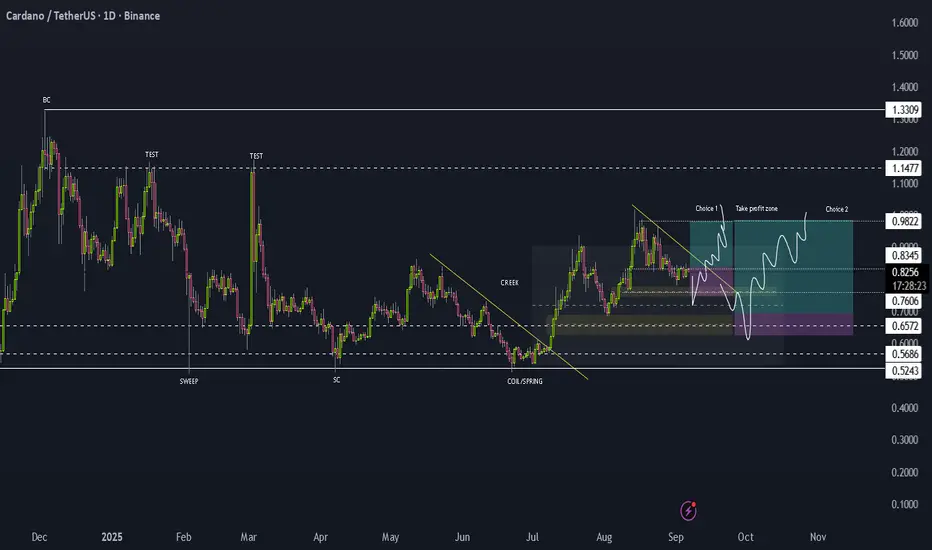
ADA/USDT possible long senarios I have marked up my chart with 2 possible scenarios. If choice one fails, move onto choice two. If both fail, move on. All the best.
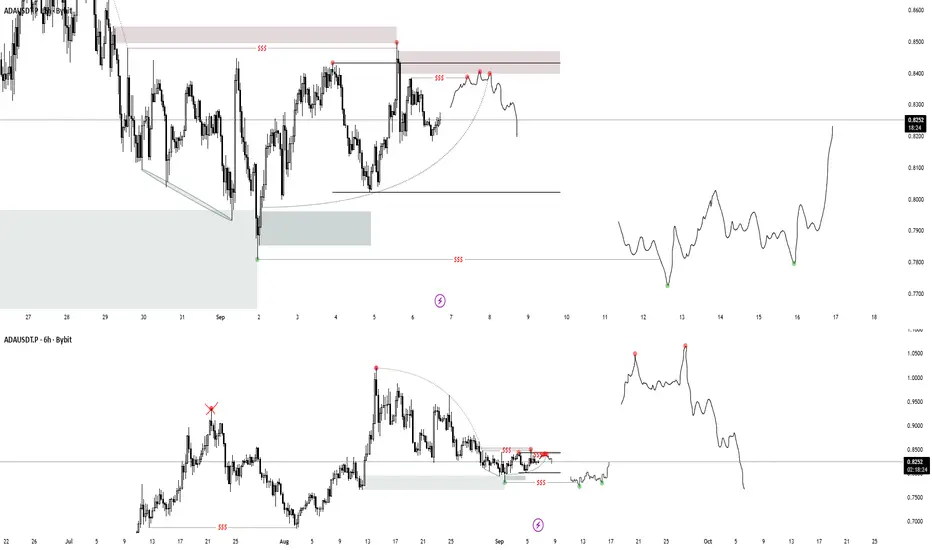
ADA RangeI continue to monitor a potential distribution on ADA, focusing primarily on finding an accumulation to push the price back to the highs. In this local 5-day range, I'm waiting for a confirmation/invalidation of this distribution to deviate the low and accumulate. The extreme supply looks good for a model 2, but a model 1 could also be possible. Confluence via BTC and USDT.D would be ideal. Since the preplanning extends far into the future, I will most likely adjust this again if I have time.
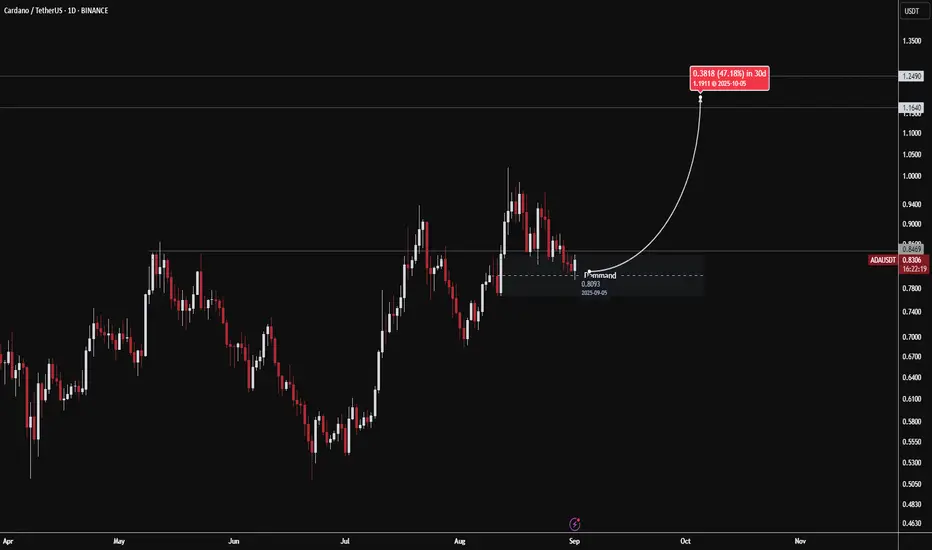
$ADACRYPTOCAP:ADA 💰
I'm very interested in CRYPTOCAP:ADA or Cardano. I see good potential here. It could bounce into the current demand area, which could be used for spot entry.
The ADA/USDT chart shows the price is again in the 0.80–0.81 demand zone.
If it rebounds, the target is an increase to 1.16–1.19 USDT (approximately +47% in 30 days).
However, if it breaks below 0.80, demand fails, and the price could continue to fall.
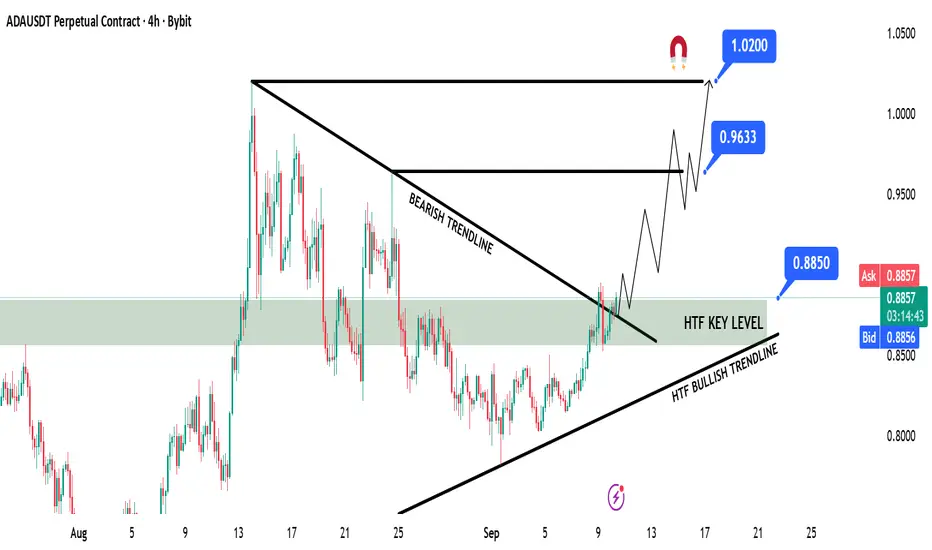
ADA – Cardano Swing Long IdeaADA – Cardano Swing Long Idea
📊 Market Sentiment
Market sentiment remains strongly bullish as the FED is expected to deliver a 0.25% rate cut, with speculation building for a possible 0.5% cut in September. Monetary policy shifts are being driven by both inflation trends and weakening labor market data. The latest August and September job reports were soft, signaling that the economy is cooling rapidly. This environment continues to fuel expectations for a major bullish run in the weeks ahead.
📈 Technical Analysis
Price found support on September 1st at the bullish HTF trendline and has been moving upward since.
Price is currently at the HTF Key Resistance level, showing accumulation rather than sharp rejection, with deviations pushing upward. This indicates strength and a bias toward higher prices.
📌 Game Plan
1)Watch for a daily close above the bearish trendline.
2)Look for the HTF Key Resistance to be broken and confirmed with a daily close above.
🎯 Setup Trigger
Entry after the retest of the HTF Key Resistance level ($0.885).
📋 Trade Management
Stoploss: Daily close below HTF Key Level ($0.85 area)
Targets:
TP1: $0.96
TP2: $1.02
💬 Like, follow, and comment if you find this setup valuable!
⚠️ Disclaimer: This content is for informational and educational purposes only and does not constitute financial, investment, or trading advice. Always do your own research before making any financial decisions.
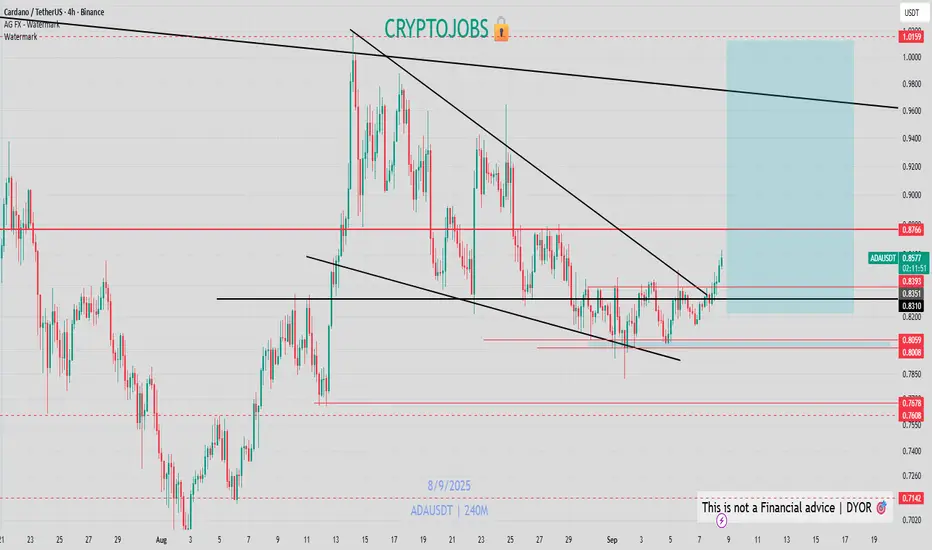
ADA Battles $0.82 – Can Bulls Break $0.87 Resistance?Cardano (ADA) is trading around $0.82–$0.83 on the 4H chart, holding above its key support but still capped under resistance. In today’s video, I focus only on the short-term price structure: support at $0.8157–$0.8014, deeper levels at $0.7724 and $0.7620, and resistance at $0.8484, $0.8710, and $0.9347. A breakout above $0.8710 would be a key step for ADA to confirm recovery momentum.
The mid-term bias remains for more upside, but ADA must prove strength step by step. With Bitcoin showing bullish signals this morning and today’s NFP release increasing volatility, ADA’s reaction at these levels will define whether bulls can take control or if we see another retest of support.
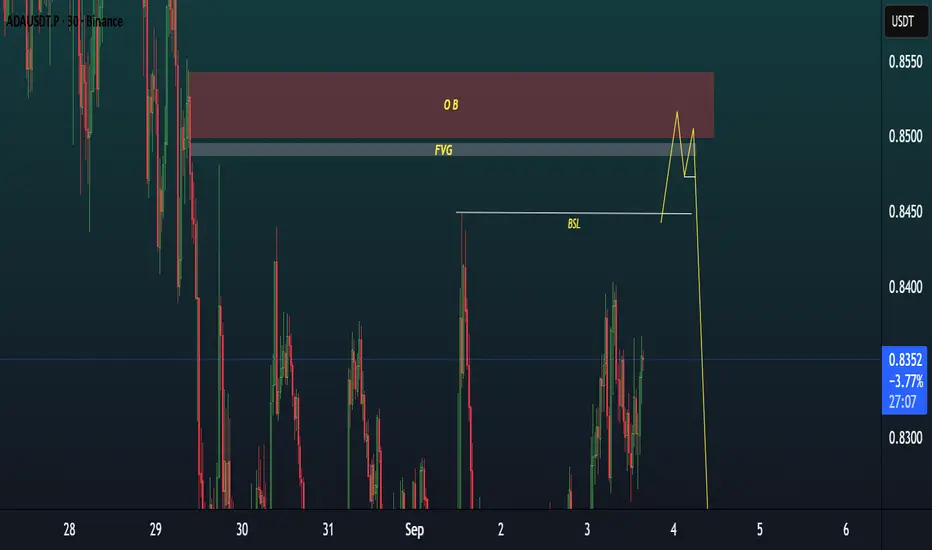
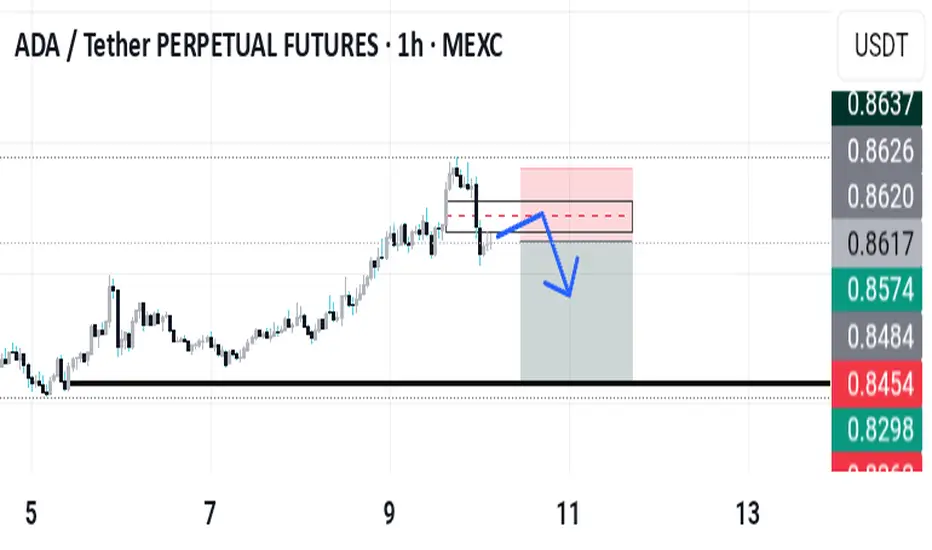
ADAUSDT TRADE SETUP.ADAUSDT | 30m | Bearish Bias
Structure: Price is approaching a Bearish Order Block (OB) aligned with an FVG (Fair Value Gap).
Liquidity: A Buy-Side Liquidity (BSL) sweep is visible before potential reversal.
Expectation: Possible short-term push into OB + FVG zone before rejection.
POI: Red OB + Grey FVG zone is key for reaction.