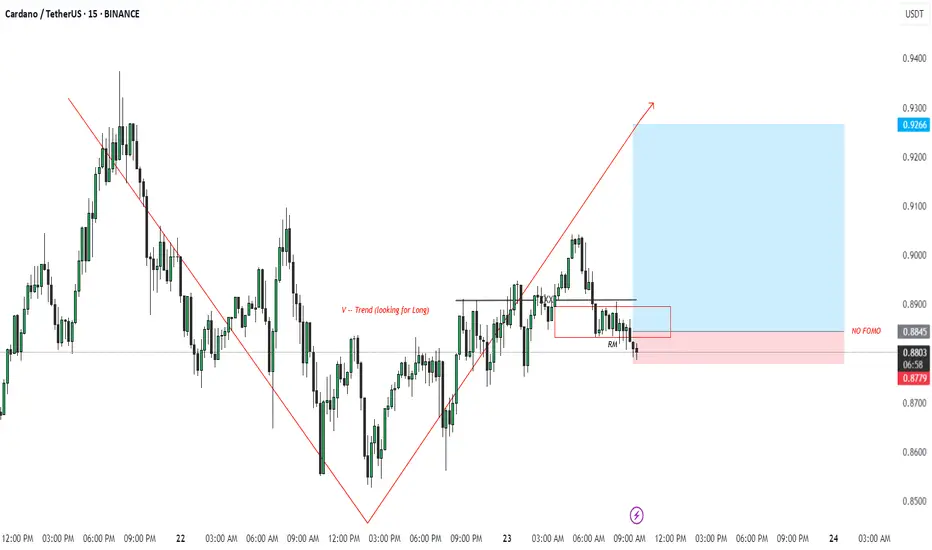
ADA/USDT Trade Idea – 15m (Following V–Trend Setup)Bias: LONG
🔍 Trade Breakdown:
V-Structure Identified:
Market formed a clear V-reversal structure, shifting from a bearish downtrend into a bullish uptrend. This is a key part of my setup — I look for these V-shaped reversals as confirmation of potential long entries.
Trendline Break + Structure Shift:
The red descending trendline was broken with strong bullish candles. Price also broke above a key structure level, confirming the bullish trend shift.
Risk Management Zone (RM):
Price pulled back into my Risk Management Zone (RM) — a demand zone marked by previous consolidation and imbalance. I do not enter on impulse, instead I wait for price to return to this zone for a safer entry.
NO FOMO Zone:
Highlighted in red — I avoid entering if price doesn't respect this zone. It helps me stay disciplined and avoid emotional trades.
Entry & Target:
Entry: Within RM zone (~0.8780–0.8845)
Stop Loss: Below RM zone (~0.8739)
Target: 0.9266
This gives a solid risk-to-reward setup in alignment with the trend.
✅ Strategy Checklist:
V-shaped recovery ✅
Structure break ✅
Pullback into RM ✅
No FOMO entry ✅
RR > 1:3 ✅
📌 Let the market come to you. Stay disciplined, trust the setup.
#ADAUSDT #CryptoTrading #VTrend #SmartMoney #PriceAction #NoFOMO #15mSetup #TradingView
ADAUSDT trade ideas
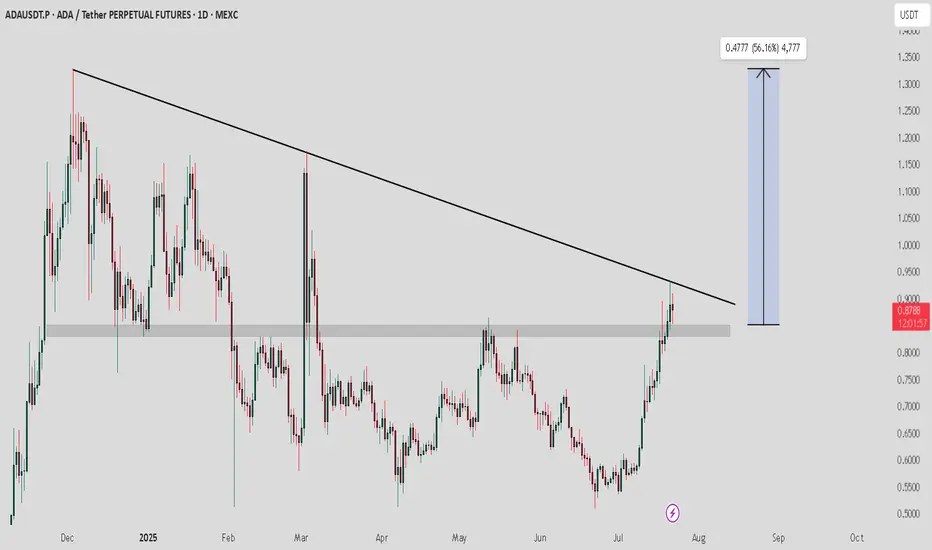
ADA (repeat the pattern)ADA /USDT
ADA keeps repeating its old patterns as it’s clearly obvious in my chart
Breakout is going on lower time frames
Looks like an easy 2X

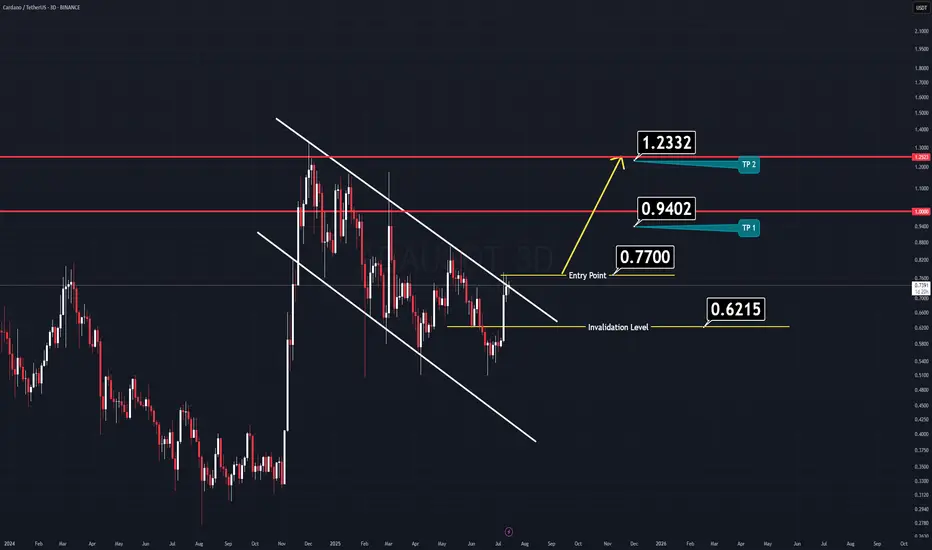
ADA / USDT lying on support ,ready to bounce and break trendlineADA/USDT broke above horizontal resistance and is now retesting from the trendline above. If it holds this support and bounces, a strong move toward $1.00, $1.20, and even $1.40 could follow. One to watch closely in the coming days.
ADA Analysis (3D)Here’s another clean and straightforward chart, this time on Cardano (ADA).
ADA has formed a large flag pattern, which looks poised for a breakout soon.
Just like the previous setup, nothing complicated here.
✅ Entry Idea:
Consider entering when the price breaks above the previous daily candle’s high.
All the key levels are already marked on the chart for easy reference.
Keep it simple,
Good Luck.
ADAUSDT BUY LONG ADAUSDT BUY LONG Weekly BISI
BullRun will starts it will going to moon for 4-5 month in daily tf .
Valid Mss with ValidOBI our buying zone .54 $ - .72 $ target atleast 7 - 10 $
holding for 3-5 month from buying , deeply buying from this weekly bisi , IF Market will more
correction then more opportunity to buy in deep , patiently wait for Enjoyable Returns
Just Hold & Enjoyyyyyyyyyyyyyyyyyyyy
~ KGB Priyabrta Behera ~
ICT Trader & Advance Mapping SMC Trader

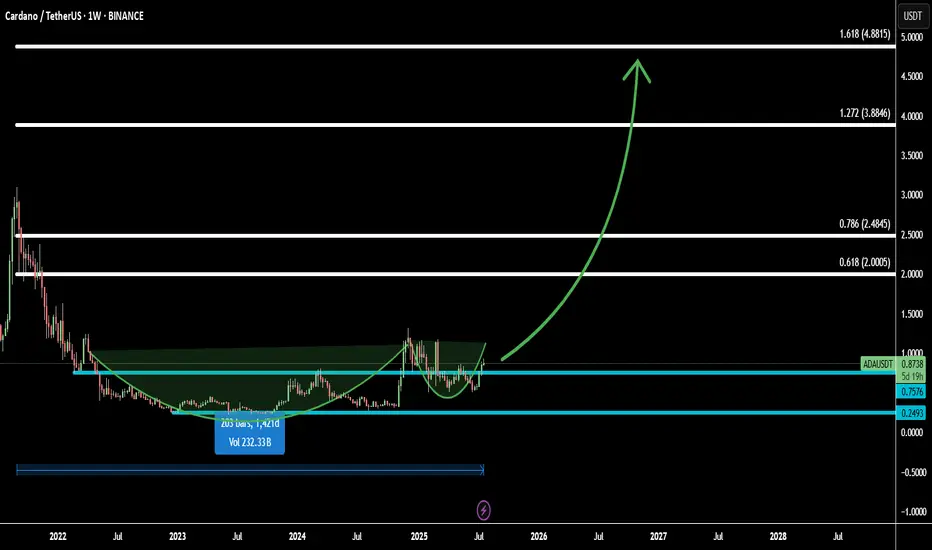
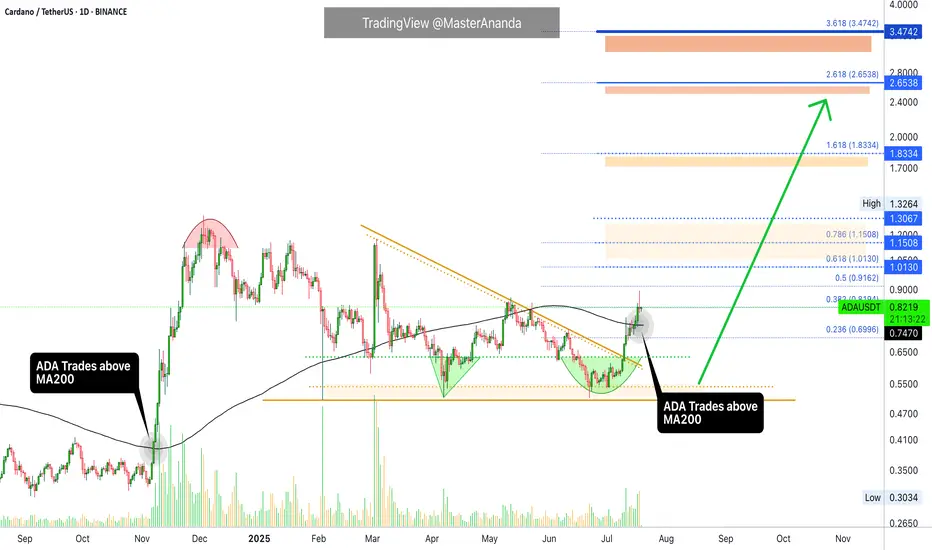
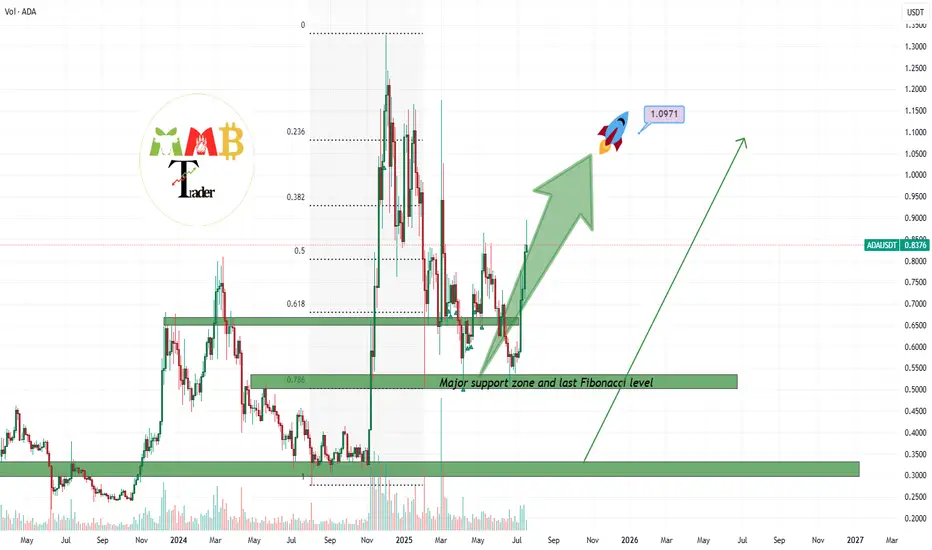
ADA Ready to Fly: Cup & Handle Pattern + Fibonacci TargetsCardano (ADAUSD) is forming a classic cup and handle pattern on the higher timeframe, signaling a bullish continuation setup that often precedes strong upward moves.
Combined with Fibonacci extensions, the breakout potential is high, with multiple target levels mapped out:
Target 1: 0.618 Fib – 2.0005 - confirms breakout strength
Target 2: 0.786 Fib – 2.4845 - momentum continuation zone
Target 3: 1.272 Fib – 3.8846 - full extension based on pattern measurement
Target 4: 1.618 Fib – 4.8815 - aggressive bull target for long-term holders
If ADA breaks the handle with strong volume, it could initiate a powerful rally. This setup is ideal for swing traders looking for a high-probability entry.
Let’s catch the next big move together! 🚀
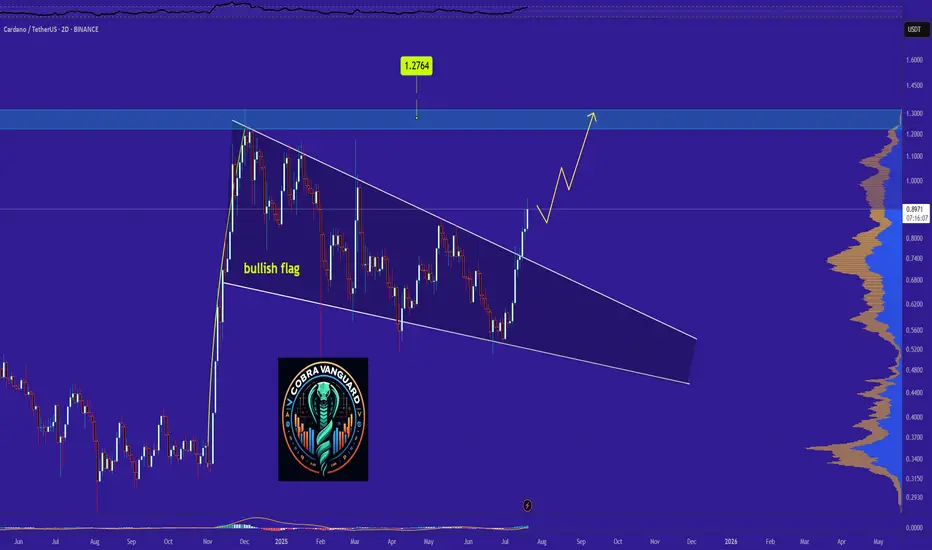
Why ADA Remains Bullish and Its Next Potential Move !The pattern has broken, and now I expect the price to rise to $1.27 . AB=CD.
Give me some energy !!
✨We spend hours finding potential opportunities and writing useful ideas, we would be happy if you support us.
Best regards CobraVanguard.💚
_ _ _ _ __ _ _ _ _ _ _ _ _ _ _ _ _ _ _ _ _ _ _ _ _ _ _ _ _ _ _ _
✅Thank you, and for more ideas, hit ❤️Like❤️ and 🌟Follow🌟!
⚠️Things can change...
The markets are always changing and even with all these signals, the market changes tend to be strong and fast!!
accordion to the moonhows and whys of the trade of way out of your IQ level,I'm an Iranian and i'm not going to make you muricans rich while you bomb my country. if it does break above it first high that it will form it becomes really high probability and that's why i published this.
ADA potential breakoutADA is near a breakout point on the daily timeframe. If we break out the triangle I have 2 targets.
Target 1: $1.135
Target 2: $1.325
Best of luck to all.

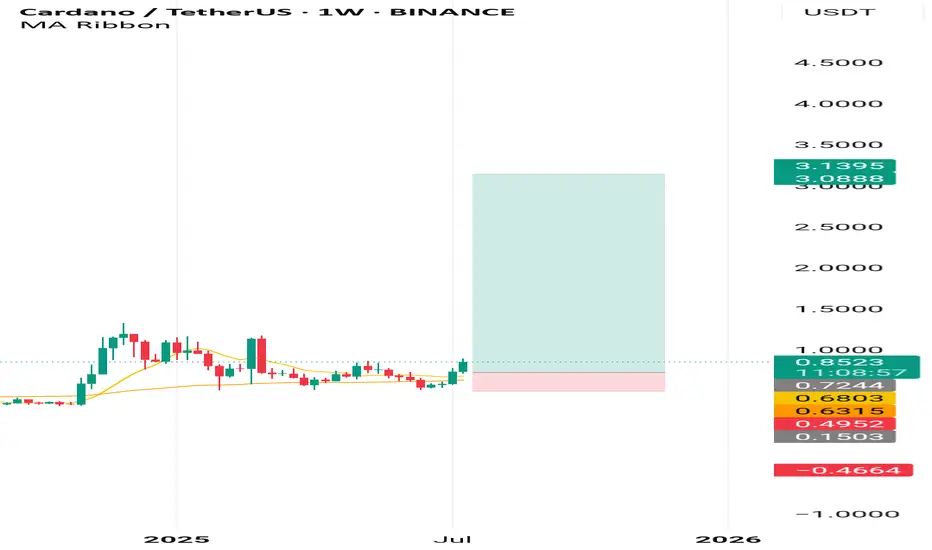
Cardano Update · Straight Up · New ATH & MoreCardano is easy to predict. We already have three great examples. Remember Bitcoin Cash? It has been growing straight up for 100+ days. Cardano will do the same. What about XRP? It is already trading at new all-time highs and Cardano is in the same group/category; big market capitalization. Then we have Ethereum which is the most recent example, as predicted, it is moving straight up. No retrace nor correction which is normal because it went sideways for months before the current bullish breakout.
Cardano has now four green weeks and this is the fifth one. This one will not be red which means straight up.
Technical analysis
I already told you about EMA55 and EMA89, weekly timeframe, ADA is trading above. MA200 as well. Notice the descending triangle on this chart. This was the consolidation period and it already broke bullish.
Targets & new all-time high
Expect ADA to continue growing until it hits the highest prices since 2021. $1.83 and beyond. Once this level is conquered, we can start rooting for a new all-time and this will happen with a high level of certainty.
Cardano will easily reach $3 and move beyond $4. I think it can go much higher...
I will do a new publication with updated new all-time high projections. The targets above are valid for the coming months.
Just a friendly update.
And thank you for your continued support.
(If you enjoyed this post, follow!)
Namaste.
Bullish Cardano Setup: $1.75, $2.20, $3 Price TargetsHello✌
Let’s analyze Cardano’s upcoming price potential 📈.
BINANCE:ADAUSDT , I expect a long-term upward bullish trend.
There are three main targets in this analysis: $1.75, $2.20, and a final target of $3. These targets could be reached within 2 to 6 years.
The current bullish channel may stay valid and continue moving upward.
✨We put love into every post!
Your support inspires us 💛 Drop a comment we’d love to hear from you! Thanks , Mad Whale🐋
🐋Many of the points and levels shown on the chart are based on personal experience, feeling, and over 7 years of research and daily study of crypto charts.
Some of the lines, channels, and price zones are drawn to make the chart easier to understand and to help imagine possible future price movements.
I’ve also included one very big drop in price even bigger than the others because in the crypto market, it’s common for prices to suddenly fall hard and push out small investors and traders with positions.
The targets on the chart are not guaranteed; they might be reached, or they might not.📚
📜Please make sure to do your own research before investing, and review the disclaimer provided at the end of each post.

Bull Flag Confirmed on ADA — Next Stop: $3!Cardano Breakout: Is the Downtrend Finally Over?
Cardano (ADA) has finally broken out of its long falling channel after months of sideways and downward movement. The current price is around $0.88 after a strong rally from the $0.45 zone.
Here’s what the chart shows:
ADA broke above the trendline that had been holding it down since late 2023.
Strong price momentum and a shift in structure suggest bulls are in control.
A large demand zone sits between $0.58 and $0.75, which now acts as support.
If the price stays above $0.78–$0.80, there’s a good chance for more upside.
What to expect next:
Price may pull back slightly to retest the breakout zone.
If that level holds, the next major targets are around $1.10 and $1.35.
If Bitcoin remains stable or altcoins gain strength, ADA could push even higher in the coming weeks.
Key Levels:
Support – $0.75, $0.68
Breakout Level – $0.80
Resistance – $1.10, $1.35
Overall, this breakout is an important shift. If the retest is successful, ADA might finally enter a new uptrend.

Cardano (ADA) Analysis – July 20, 2025The breakout above the $0.80 level was a major technical milestone for Cardano.
✅ The price not only breached the resistance, but also confirmed it with a strong daily close — clearly signaling that sellers have lost control of the market.
Now, we’re likely to see buyers step in and take over the trend.
🕒 For a more optimal and lower-risk entry, I suggest watching the $0.64 area.
There’s a strong possibility that liquidity around this zone could push the price aggressively toward $2.20, backed by solid bullish momentum.
🎯 This setup offers a promising upside — stay alert for confirmation signals.

ADA MY LOVE ✅ Profitable Trades Counted (Spot Swing):
418%
213%
75%
70%
💰 Approximate Cumulative Gain (Compounded Not Calculated)
= 776%+ gain from multiple swing trades
🧠 Your POV (as seen on chart)
“NO SL” indicates confidence in ADA’s long-term support zones.
trusted strong support accumulation areas (red zone) and rode through volatility.
Strong belief in continuation: yellow squiggly lines show an expectation of consolidation followed by breakout above $1.
📢 Note: “There are also multiple futures scalp trades not shown here.” – this shows you are aggressively compounding gains via different strategies.
🧠 My Technical POV on ADA (Bullish Outlook)
✅ Key Observations:
Price Recovery from macro bottom zone (~0.25–0.26).
Multiple Breakouts from falling trendlines.
Clean support-resistance flip around 0.52, 0.64, 0.81 zones.
Current price: ~$0.86, holding above mid-term trend support.
🎯 Future Key Levels:
Short-Term Targets: 0.89 (breakout level), then 1.1345
Mid-Term Targets: 1.3178, 1.60
Long-Term Potential: 2$ ,3$,5$ if BTC & ETH sustain bullish cycle
📈 Momentum:
Consolidation above 0.80 zone would likely trigger another explosive move
ADA remains undervalued compared to its 2021 ATH, making it a high R/R swing opportunity

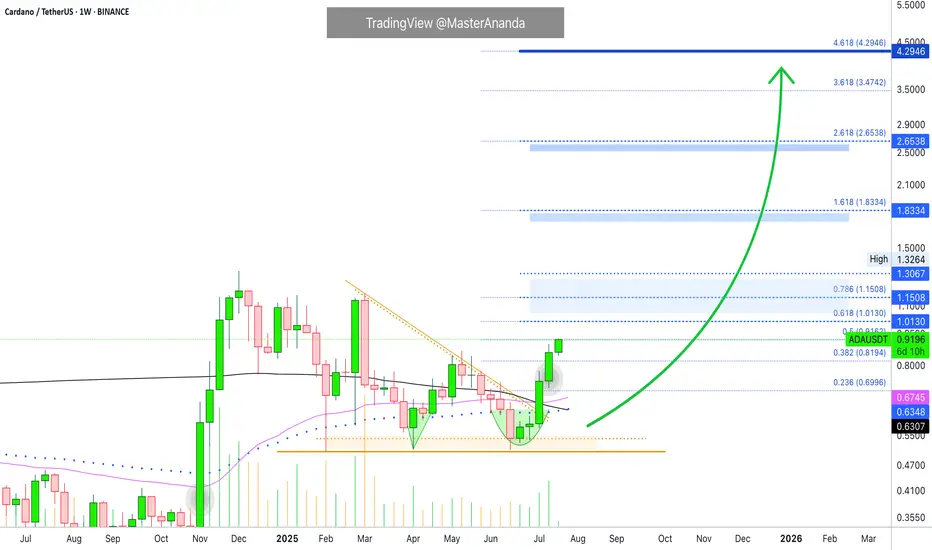
Biggest signal of the year!!! In weekly tf BINANCE:ADAUSDT started a bullish trend that can lead the price to atleast 3$! The last time that this happened in weekly tf price raised 1900%!!
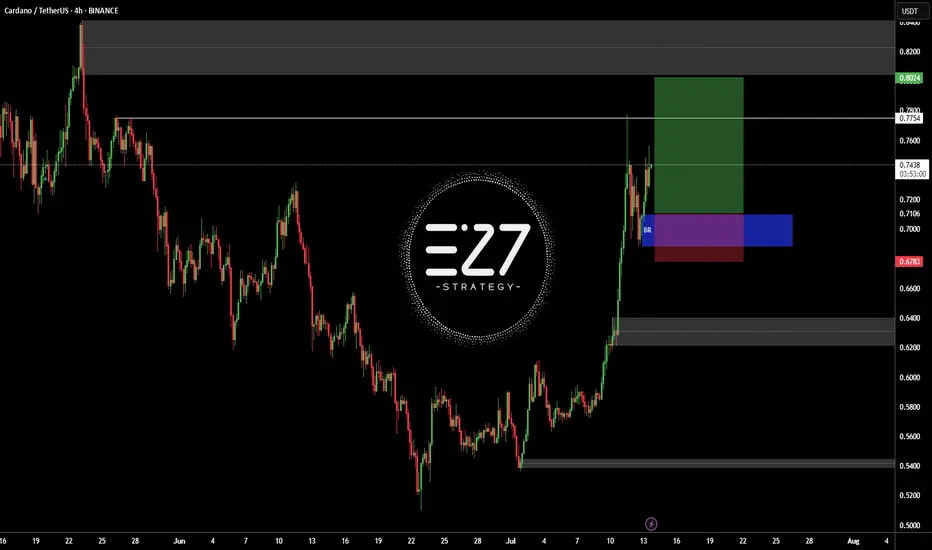
ADAUSDTBINANCE:ADAUSDT in up-trend and my open position buy in latest sowing low.
Best entry: 0.6952 - 0.7259
Target: 0.7754 - 0.8024
Stop loss: 0.678
Please control RISK management
Cardano Update · What Happens Now?I am going to assume that you read the XRP update I just published. While these are different pairs, my updates and publications are all related because I look at the entire market—for you—as a unit.
The situation with Cardano is different to XRP. Why? Because XRP already broke its previous bullish wave high while Cardano hasn't. This first tells us that Cardano has more room for growth and has less risk from a buyers standpoint. It can also be seen as Cardano being weaker or lagging behind in someway but I wouldn't give credit to this interpretation. The truth is that the market moves in unison but not at the exact same time.
May's high, reached first from the 7-April bottom, has been challenged but confirmed as resistance. This won't last long. It has been confirmed as resistance and we can easily see it by yesterday's red candle. This is normal. If you look at 14-July and 12-July, these days were also red yet Cardano continued growing. You can expect the same.
We can have one day red, two red days, three red days and nothing changes. The market is set to grow, is growing and will continue to grow in the coming weeks and months. Long-term growth and even beyond months. There is the possibility of growth extending to years similar to Bitcoin.
When a huge wave develops, we get a half year strong correction, a major higher low compared to the start of the phase followed by additional growth.
Let's get back to today and what is happening now.
ADAUSDT managed to break above MA200 16-July, just three days ago. This confirms a long-term growth process; it is now confirmed. This means that Cardano is on track to grow for 3-6 months minimum.
What we are seeing now is only the start of a major advance and the continuation—on a long-term basis—of the move that started in late 2024.
You can rest easy, sleep easy while you watch your profits grow. Cardano will continue growing, it will do great; you have my word.
Thank you for reading.
If you enjoy the content leave a comment just for this one, I will be sharing updates for you now, today, yesterday, tomorrow and for years to come.
Namaste.
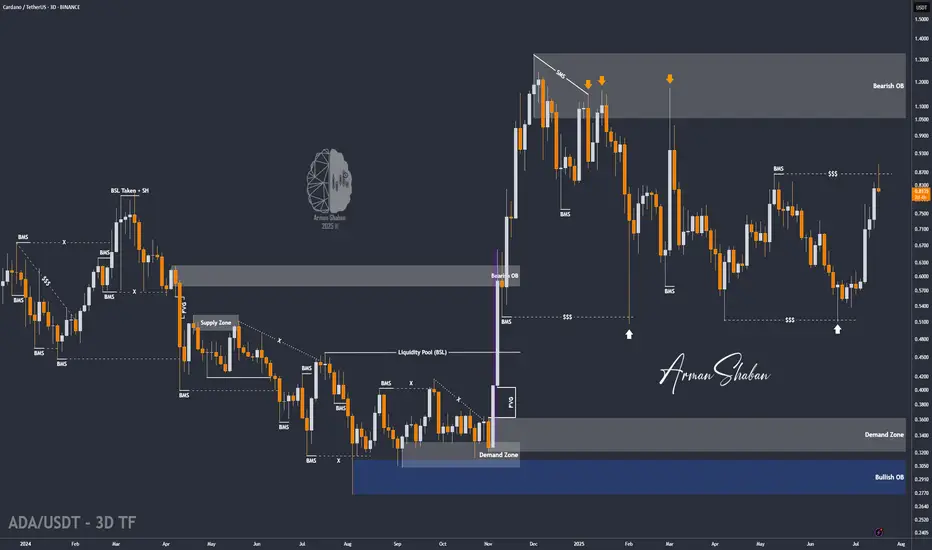
ADA/USDT | BIG Bullish Move Ahead! (READ THE CAPTION)By analyzing the Cardano chart on the 3-day timeframe, we can see that, as expected, the price continued its rally, reaching $0.89 before collecting liquidity above the $0.86 level and then facing a correction. Currently trading around $0.81, we expect the bullish trend to continue after this minor pullback. Key demand zones are at $0.78, $0.69, and $0.61. Based on the previous analysis, the next short- to mid-term bullish targets are $0.93, $1.05, and $1.33.
Please support me with your likes and comments to motivate me to share more analysis with you and share your opinion about the possible trend of this chart with me !
Best Regards , Arman Shaban
Major Move Ahead for ADA – Breakout or Breakdown?
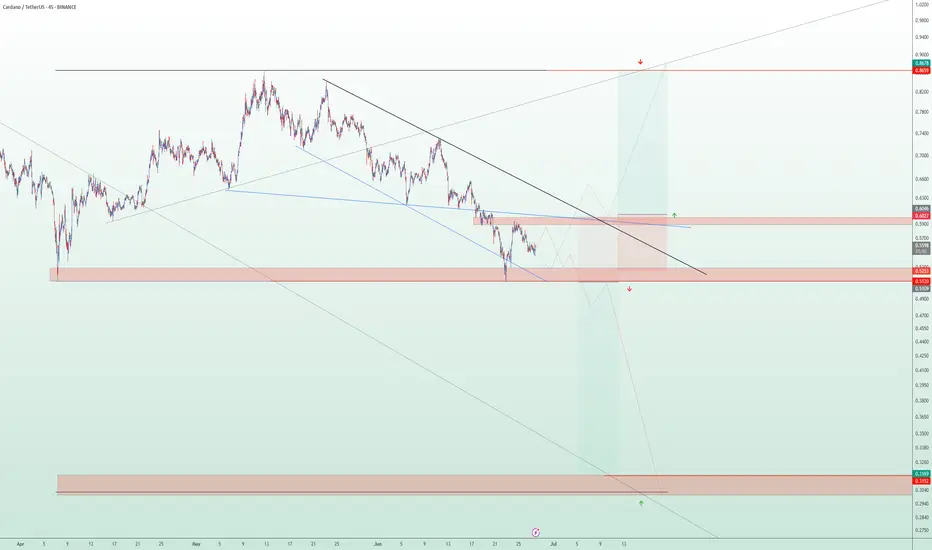
🔍 ADA/USDT Analysis – Dual Scenario Setup (BUY & SELL)
Currently, ADA is ranging between major supply and demand zones. Two clear scenarios are in play depending on how price reacts to key levels:
📈 Bullish Scenario (Long):
Entry: On breakout and confirmation above $0.6027
Target: $0.869 (major resistance zone)
Stop Loss: Below $0.523
Trigger: Break of descending trendline and solid structure above $0.6027
📉 Bearish Scenario (Short):
Entry: Around $0.5120 (rejection from supply zone)
Target: $0.315 (strong demand zone)
Stop Loss: Above $0.6027
Trigger: Failed breakout and rejection from $0.5120 level, with confirmation below it
📌 Based on the descending channel structure, this might have been the final leg of the downtrend, and a reversal to the upside could be underway. However, for confirmation, we prefer to wait for stronger price action signals before fully committing.
🛑 Always use risk management. Market remains bearish until proven otherwise.
ADAUSDT 1$ is not any more resistance for it, soon above itAs we mentioned before 0.5$ was strong enough to pump the price:
and soon our first target which was 2x and is 1$ will hit and even after that price can see more gain and 1$ or 0.80$ which is current price can be strong supports in future.
DISCLAIMER: ((trade based on your own decision))
<<press like👍 if you enjoy💚
Cardano (ADA): Good Trades That Can Be Taken | Waiting Is KeyWe are seeing the volatility kicking in on ADA, which could send us into a new BOS or MSB so we are waiting for confirmation, and as soon as we get it, we will be opening a position!
More in-depth info is in the video—enjoy!
Swallow Academy

From Liquidation to Withdrawal, It’s the MapDo you remember your first heavy loss? That exact moment when you realized trading isn’t just about patterns and candles?
This analysis is for you if you’re looking for a path to escape that liquidation pit and actually make your first real withdrawal.
No hype, no signals just a practical roadmap built on experience and mistakes.
Hello✌
Spend 3 minutes ⏰ reading this educational material.
🎯 Analytical Insight on Cardano:
BINANCE:ADAUSDT is testing a crucial daily support near the 0.38 Fibonacci retracement level, setting up for a potential 16% upside toward the key psychological and monthly resistance at $1. If this level holds, ADA could confirm bullish momentum and target higher levels soon. 📊🚀
Now , let's dive into the educational section,
🧭 It All Starts With the Tools
Before anything else, you need a compass and in trading, that compass is made of tools you can actually use on TradingView.
Here are some tools that serious traders never ignore, especially when analyzing crowd behavior and institutional traps:
Volume Profile (Fixed Range)
Shows you where money is actually concentrated, not just where price is. High-volume nodes often become breakout or breakdown zones in days ahead.
Liquidity Zones – Custom Indicators
Search for "liquidity" or "order block" in the Indicators section. There are tons of free community scripts that help you spot stop-loss clusters the exact places where the market loves to hunt.
Relative Volume (RVOL)
Tells you how strong the current market move is compared to its average volume. Is this a real breakout, or just noise? RVOL helps answer that.
Session Volume & Time-Based Boxes
Use drawing tools to box London, New York, or Asia sessions. This lets you track where real money enters. Time matters volume without time is meaningless.
Got the tools? Great. But now what? Let’s walk the path...
🚪 The Entry Point: First Liquidation
Almost every trader starts here: a signal, a rushed entry, a tight stop... then liquidation or a brutal margin call.
But that exact moment? It’s not your failure. It’s the beginning of your real journey.
Ask yourself:
Why did I take that trade?
What tool was available but ignored?
Was my position size reasonable or emotional?
Analyze this moment deeper than you analyze Bitcoin’s chart.
🔁 Repeat or Reroute?
This is the loop most traders never escape.
They stay stuck between losses because they don’t reflect, don’t learn, and don’t adjust.
What you should do instead:
Start a trade journal raw and honest.
Use TradingView as your lab, not just a chart. Practice, backtest, fail, and fix.
🧠 Turning Point: Where Your Mind Starts Trading
Once you stop chasing profit and start chasing clarity, things shift.
You begin spotting real triggers, real volume, and real market intent.
Here’s where tools become meaningful:
Use OBV to confirm volume alignment
Let RSI tell you about weakness before reversal
Follow EMA50/EMA200 to map trend structure
Not because someone told you to but because now you know why and when to use them.
🤑 The First Real Withdrawal Isn’t From Your Wallet
The first "withdrawal" isn’t a bank transfer.
It’s when you can walk away from the market without FOMO, without guilt, and without overtrading.
You now:
Accept risk, every single trade
Respect the market, not fear it
Have patience not because you're lazy, but because you understand timing
That’s the real payout.
📌 Final Thoughts
The path to becoming a trader starts with loss, grows with tools, and ends with discipline.
TradingView isn’t just for charts it’s your practice field.
Before chasing the next win, start by understanding your last mistake.
✨ Need a little love!
We pour love into every post your support keeps us inspired! 💛 Don’t be shy, we’d love to hear from you on comments. Big thanks , Mad Whale 🐋
📜Please make sure to do your own research before investing, and review the disclaimer provided at the end of each post.

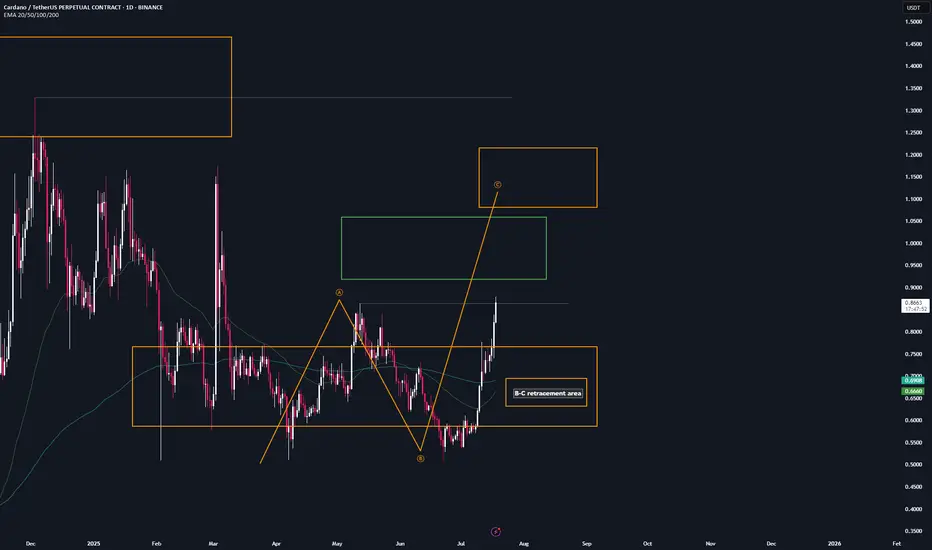
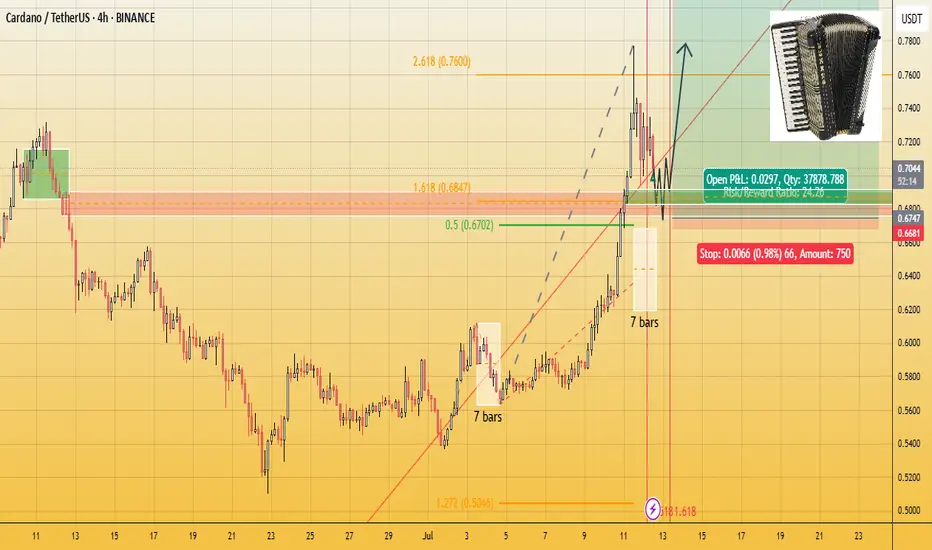
ADA | Trade setup📌 After the breakout from the last high at $0.86, a bullish sequence (orange) has now been activated.
📊 These setups typically occur no more than twice per year on any given altcoin, so I’ll be aggressively buying each level at the B-C retracement area.
Trademanagement:
- I'm placing long orders at each level. ((If the price continues climbing, I’ll adjust the trend reversal level (green) accordingly and update my limit orders.)
- Once the trade reaches a 2 R/R, I’ll move the stop-loss to break-even.
- From a 3 R/R onward, I’ll start locking in profits.
✅ I welcome every correction from here on —
but I won’t enter any new positions at these top levels.
Stay safe & lets make money