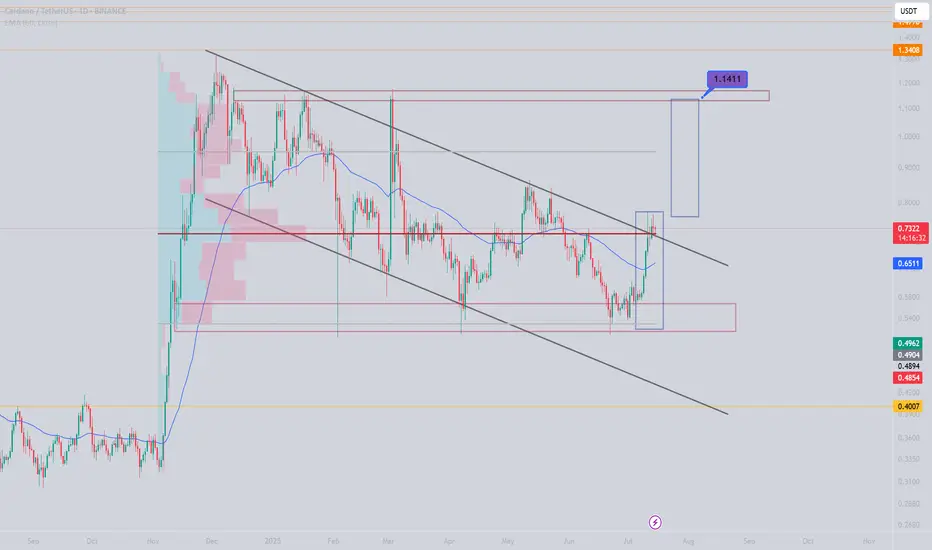
ADAUSDTWith the price stabilizing above the volume range and the descending channel, and if the market sentiment remains positive, we can expect growth to 1.14 in the first step and then 2.
ADAUST.P trade ideas
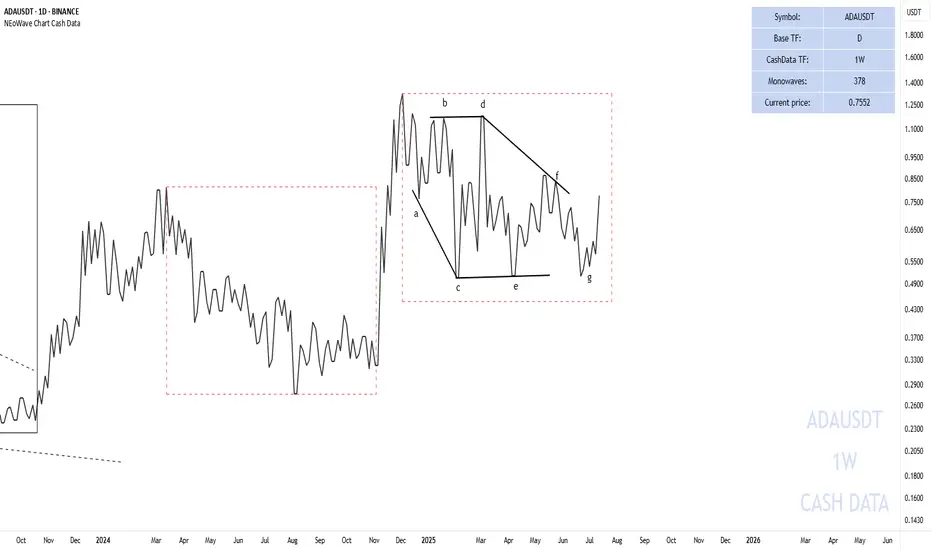
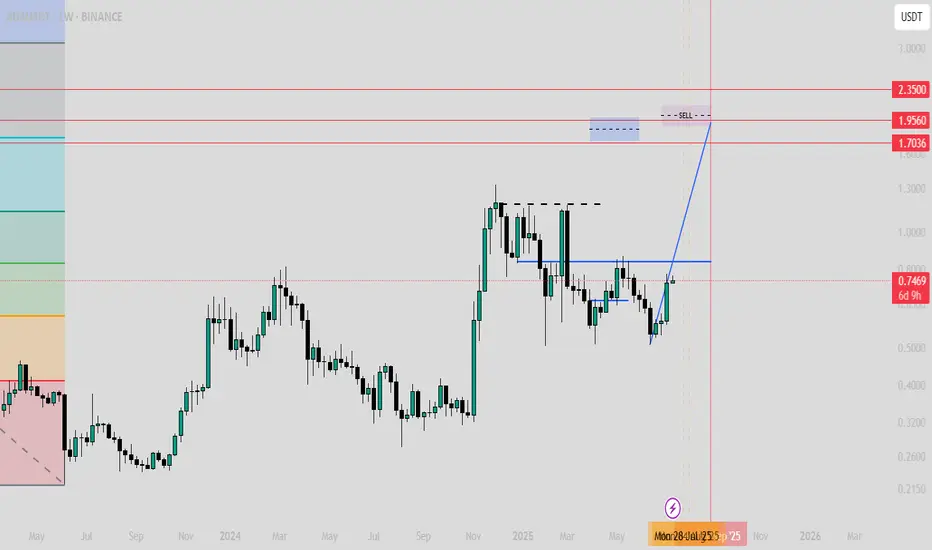
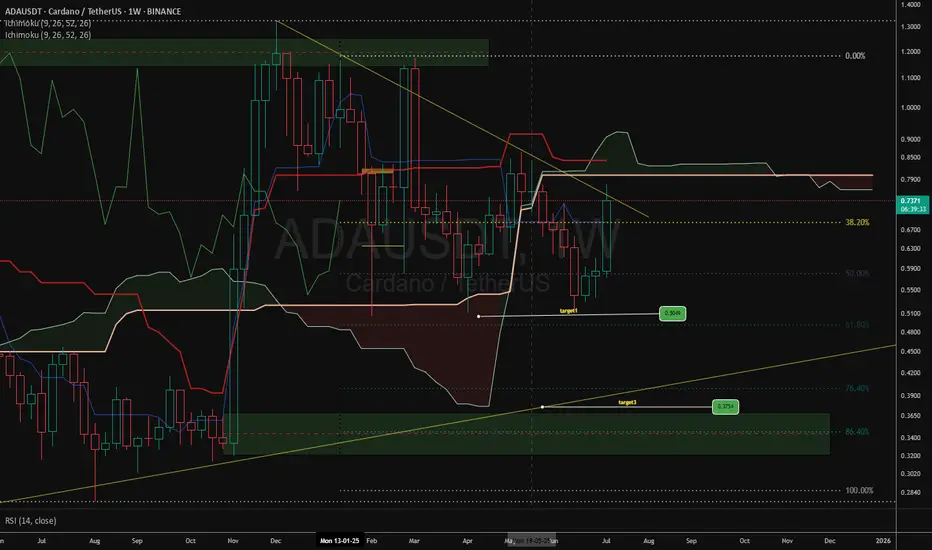
CARDANO WILL BE $2!Our first downside target was touched, but then it failed to reach the second target and the g-wave ended at 0.54.
Based on past price movement, we can expect the price to reach $1.5-$2.
Good luck
NEoWave Chart
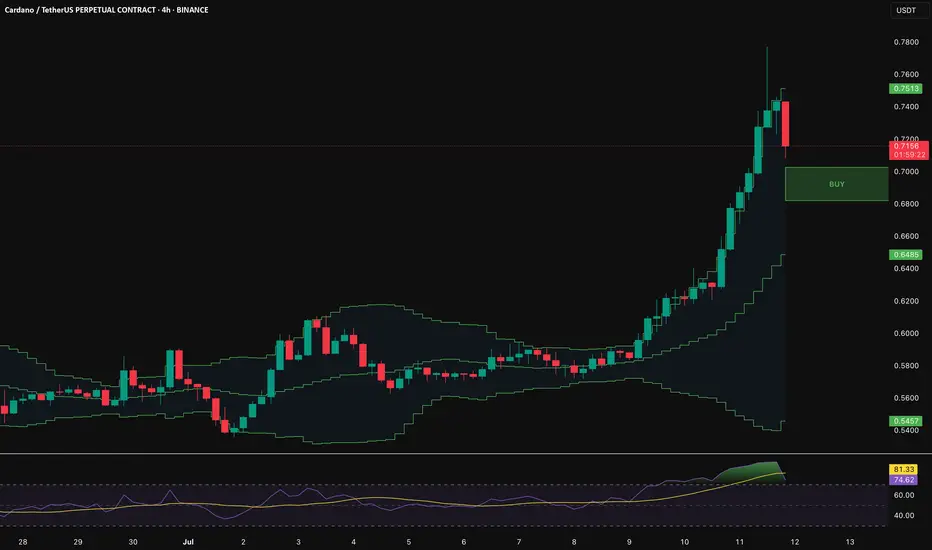
ADA broke the bull market support band and to the moonBINANCE:ADAUSDT
Typically this should be the first test after the broke out of bull market support band, I would expect it to be 5-10% around (at 4 h level) 20 EMA/SMA or Bollinger band MID. I will buy when 1 h RSI keeps nicely above 50 with a golden cross of stochastic RSI.
ADA/USDT Trading Ideahi traders
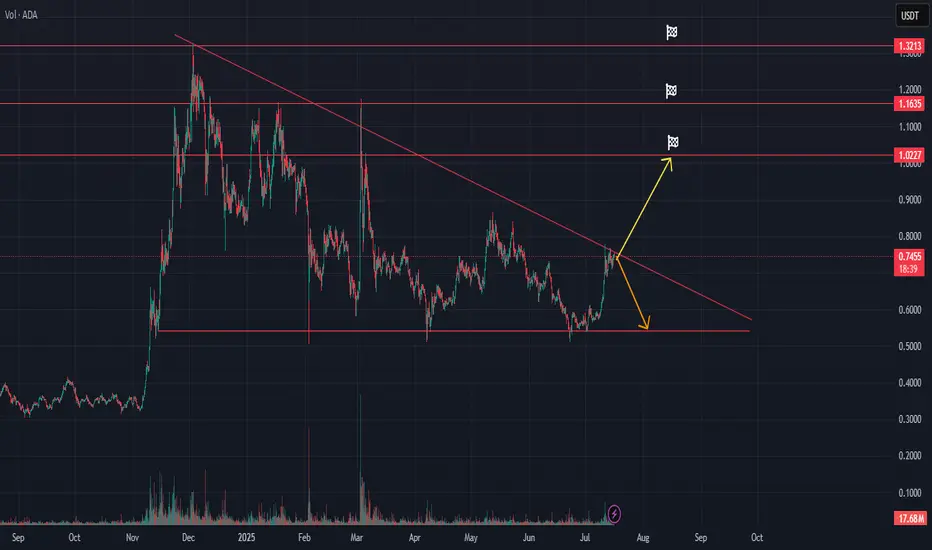
This technical analysis for Cardano (ADA/USDT) outlines a potential breakout or rejection scenario as the price tests a long-term descending trendline.
Key Technical Levels to watch:
Resistance:
$0.7467 (current test of descending trendline)
$1.0227 (primary breakout target)
$1.1635
$1.3213
Support:
~$0.60 (horizontal support zone)
Trendline: The chart features a long-term descending trendline from the February/March 2025 highs. ADA is currently approaching this resistance after a sustained rally from sub-$0.60 levels.
📈 Bullish Scenario:
If ADA breaks above the descending trendline with strong volume:
Expect a continuation move toward $1.0227, the nearest key resistance.
A successful breakout and hold above $1.0227 could open the path toward $1.1635 and eventually $1.3213.
This would signal a potential trend reversal and shift in momentum.
📉 Bearish Scenario:
If ADA gets rejected at the trendline:
Price may fall back toward the $0.60 support zone, where previous consolidation occurred.
This scenario suggests the trendline remains a strong barrier and that ADA may continue ranging or resume a downtrend.
*How to trade it:
Confirm breakout with volume and daily candle close.
Watch for fakeouts or failed breakouts due to market-wide sentiment shifts.
Can we break above the 0.8063-0.8836 range?
Hello, traders.
If you "Follow", you can always get the latest information quickly.
Have a nice day today.
-------------------------------------
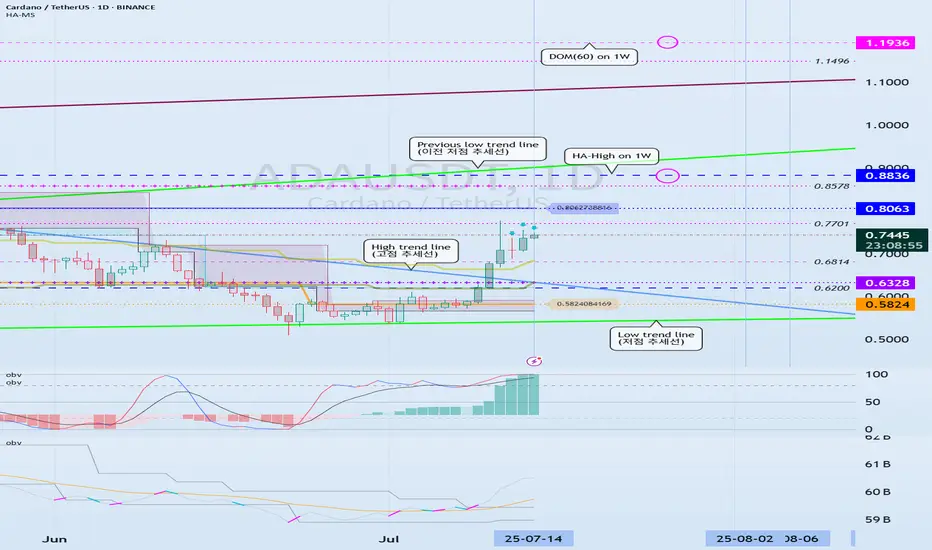
(ADAEUSDT 1D chart)
ADA is forming a long-term rising channel and is showing an upward trend as it breaks above the mid-term high downtrend line.
We need to see if it can rise above 0.8836 and maintain the price to rise above the previous mid-term low trend line.
-
The DOM(60) indicator is showing signs of being newly created.
Accordingly, we need to see where the DOM(60) indicator is formed.
Since the HA-High indicator is formed at 0.8063, in order to continue the upward trend, it must rise at least above 0.8063 to maintain the price.
Accordingly, the key is whether the price can be maintained above 0.6328.
-
It is possible to show a mid- to long-term upward trend only if it breaks through the HA-High ~ DOM(60) section of the 1W chart upward.
Therefore, the 0.8836-1.1936 section is likely to be the resistance section.
-
Based on the current price position, the support section is the 0.5824-0.6328 section.
However, since the positions of the HA-Low indicator and the DOM(-60) indicator are switched, if it shows a downward trend, there is a possibility that a new HA-Low indicator will be created.
If a new HA-Low indicator is created, it is important to determine whether there is support near it.
-
Thank you for reading to the end.
I hope you have a successful trade.
--------------------------------------------------
- Here is an explanation of the big picture.
(3-year bull market, 1-year bear market pattern)
I will explain the details again when the bear market starts.
------------------------------------------------------
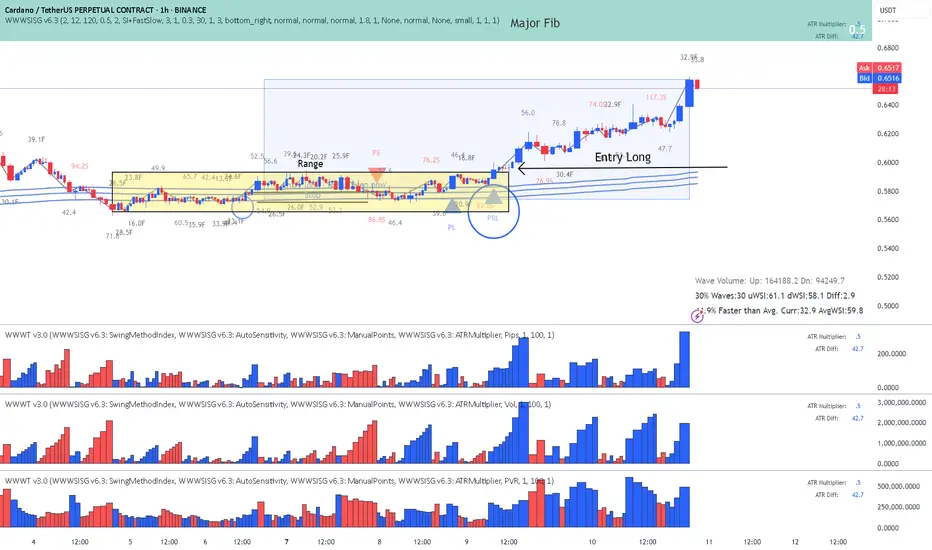
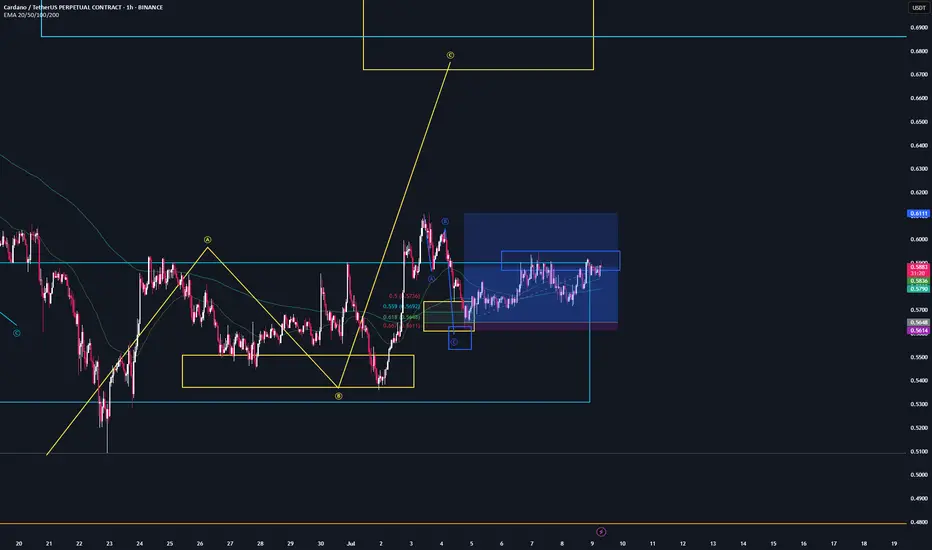
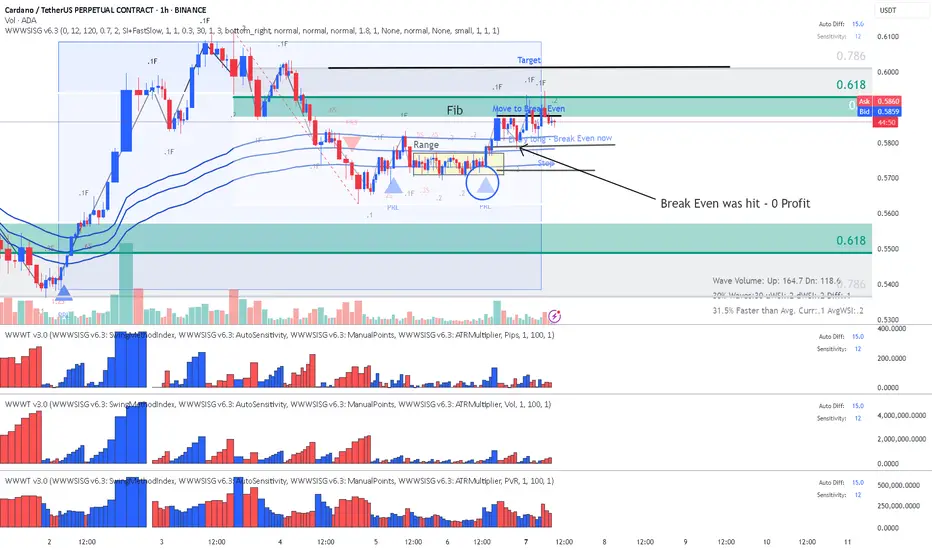
ADA- Cardano - Classic Exit from Range with Plutus signalReading the chart :
AVWAP acted as resistance and we started ranging.
This is a classic entry long for the "SI traders" called Exit from Range with a Plutus signal and in this case it was the PRL signal.
ADA is heading for a major Fib I will not advise any entries now.
Enjoy wave and speed index reading!
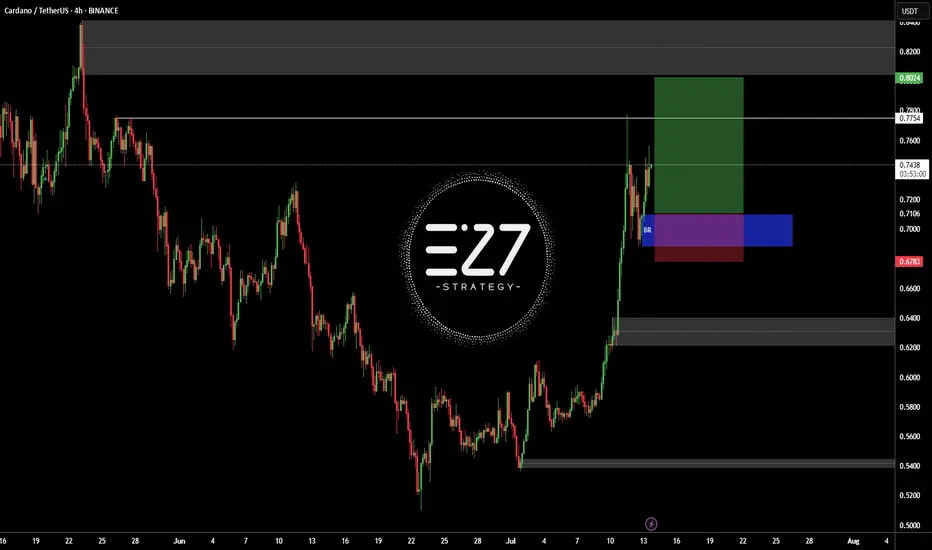
ADAUSDTBINANCE:ADAUSDT in up-trend and my open position buy in latest sowing low.
Best entry: 0.6952 - 0.7259
Target: 0.7754 - 0.8024
Stop loss: 0.678
Please control RISK management
$ADA or Cardano analysis (Target is between 1.8 to 2.1)CRYPTOCAP:ADA or Cardano analysis (Target is between 1.8 to 2.1)
this zone is based on few factors such as historical price behavior and fibbo targets
ADA idea 03 07 25Grids can it’s a great way to deal with volatility and timming within a range with clear PD Arrays
ADA | Trade-SetupOur trade worked out exactly as planned, and the price reacted perfectly from the 0.667 level, which also overlaps with the bearish target area (green).
✅First take profit was at the overall correction level (green).
Second take profit is when we reach the 100% correction mark at $0.611. At that point, I will secure most of my position and only let a small portion run.
Weekly trading plan for ADALast week, BINANCE:ADAUSDT perfectly followed our bullish scenario and hit all targets. This week, after a false breakout of the weekly pivot point, price reversed and reached TP1. However, we're now seeing rejection at the monthly pivot - expect a potential pullback before consolidation above $0.6. Full analysis in the video below
Trade safe and stay adaptive

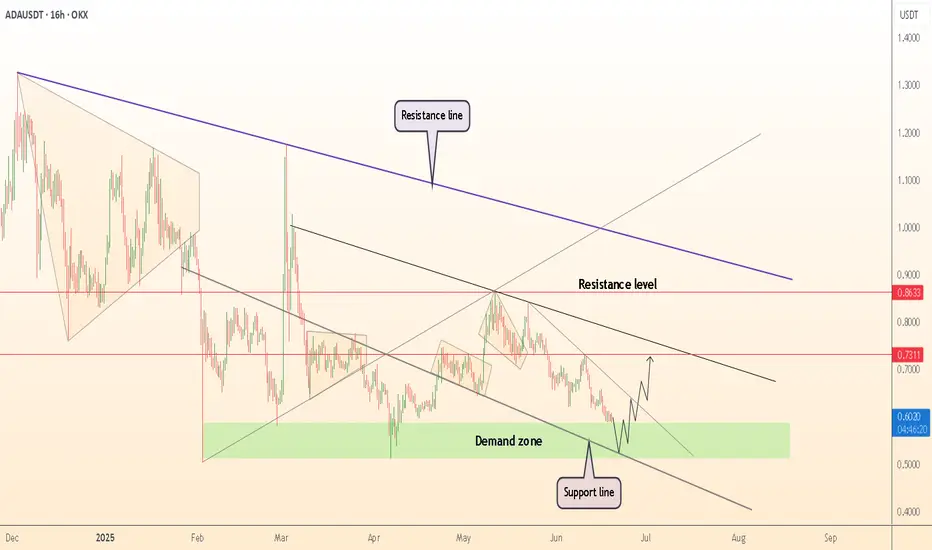
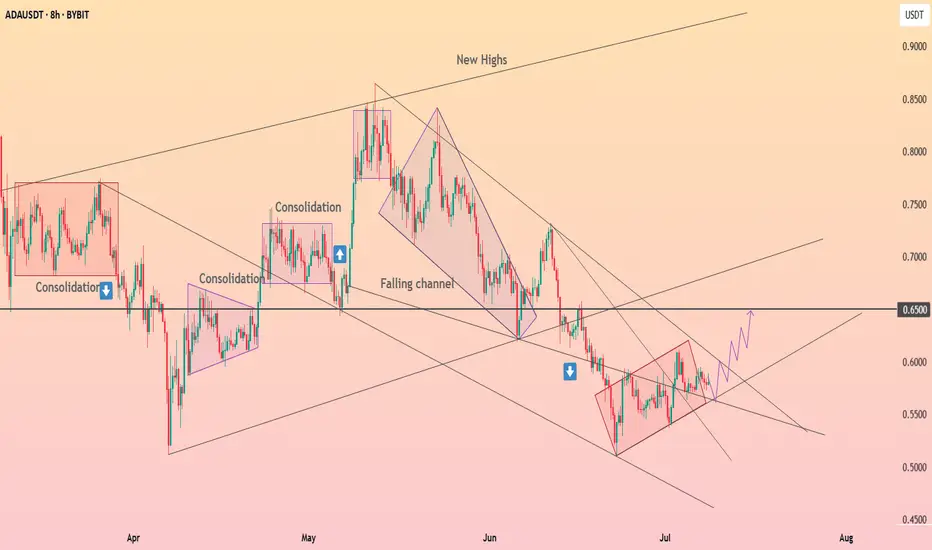
DeGRAM | ADAUSD above the demand zone📊 Technical Analysis
● ADA is testing the confluence of the long-term support line and the 0.54-0.63 demand zone; every prior touch of this area sparked a 20-30 % rebound.
● A falling wedge within the broader descending channel is close to completion; a 16 h close above the wedge roof (~0.66) activates a measured move to the first horizontal resistance at 0.73 and the channel cap near 0.86.
💡 Fundamental Analysis
● The upcoming Chang hard-fork, which introduces on-chain governance and boosts staking utility, is scheduled for main-net in Q3 2025, lifting on-chain activity and TVL.
✨ Summary
Long 0.58-0.63; wedge breakout >0.66 targets 0.73 ➜ 0.86. Bull bias void on a 16 h close below 0.54.
-------------------
Share your opinion in the comments and support the idea with a like. Thanks for your support
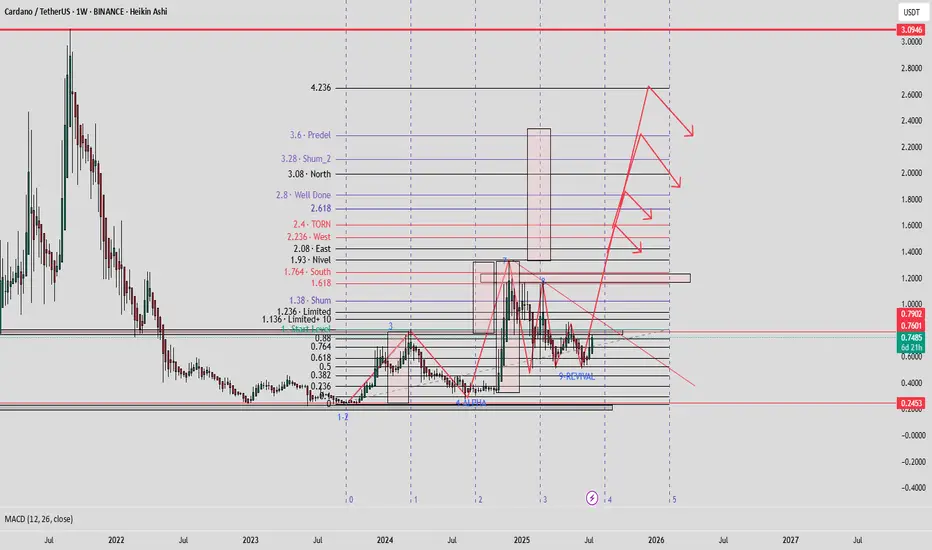
#ADA Almazov Projection#ADAUSD ALMAZOV PROJECTION WEEKLY
Price projection according to Almazov's theory, #ADA should at least touch $1,60 - before pulling back or continuing to go long if its dimensionality decreases (2.3).
ADA / Bulish or Bearish
Hello everyone,
Here’s my analysis of ADA/USDT.
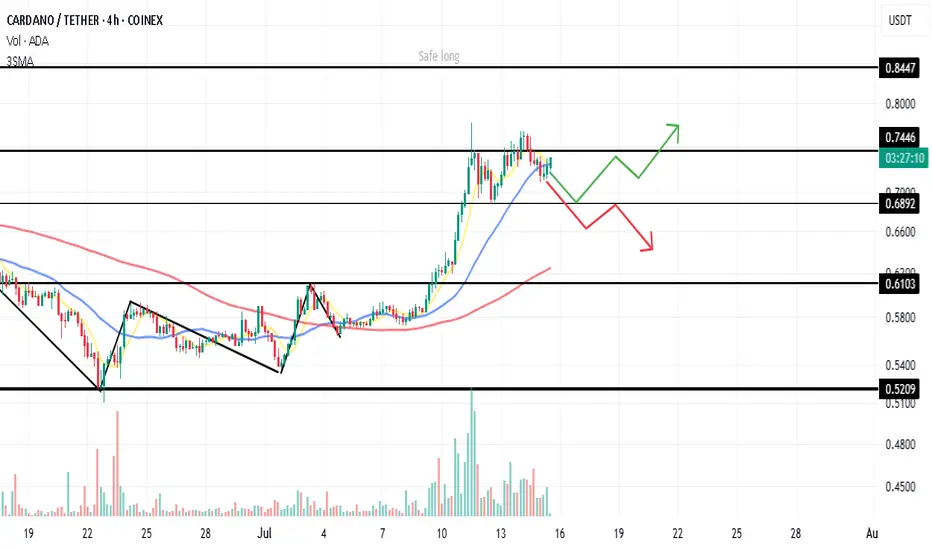
Cardano dropped back below the key level of 0.7446 after a failed breakout. Based on the current market conditions, we can consider three potential scenarios:
1️⃣ Range Scenario:
Price may consolidate between 0.7446 – 0.7041 for up to two weeks.
2️⃣ Bullish Scenario:
A new bullish move depends on a breakout of one of the following levels:
A. Riskier long position: Breakout above 0.7446
B. Safer long position: Breakout above 0.7600
🟡 Note: In scenario B, the stop-loss will naturally be wider.
3️⃣ Bearish Scenario:
A breakdown below 0.6892 could occur — but this does not immediately suggest a short setup.
❗️In that case, we must re-analyze TOTAL, TOTAL2, USDT.D, and BTC.
✅ If the overall market is bearish, a short could be valid.
🟡 Otherwise, it may simply be a deeper correction rather than a trend reversal.
---
🙏 Thanks for reading!
If you found this analysis helpful, hit the 🚀 icon to support the content.
#Cardano #ADAUSDT #CryptoAnalysis #TechnicalAnalysis #Altcoins #TradingStrategy #MarketOutlook #SwingTrade #CryptoTA #BitcoinDominance #TotalMarketCap #USDTdominance #PriceAction
ADA WCardano is currently back to the flat cloud after breaking the cloud and is continuing its downward trend again until the tarkett is visible in the picture. My good friend, this is my personal opinion. Please make a rational decision.
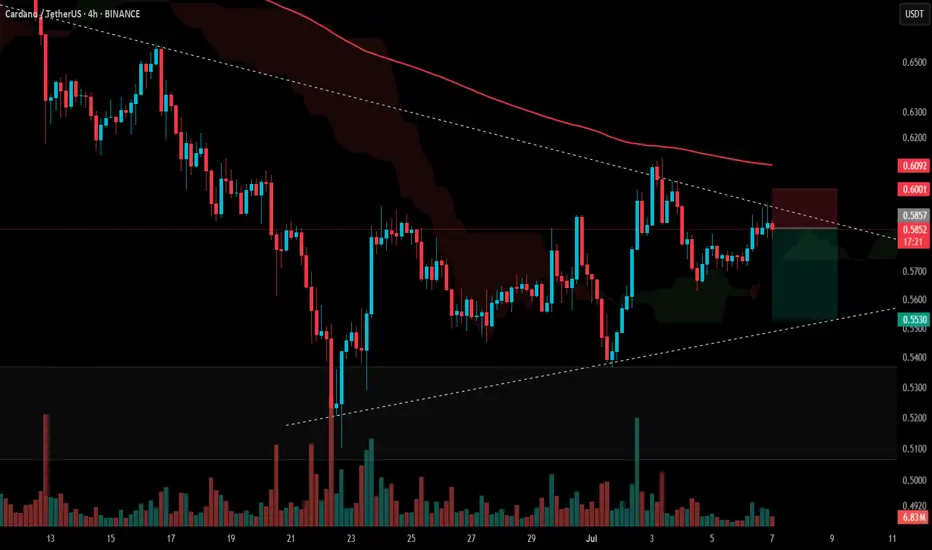
#ADA Update #2 – July 7, 2025🟠 #ADA Update #2 – July 7, 2025
ADA has been consolidating within a descending triangle for a while now. Staying below the 200MA reinforces the bearish outlook, as this level acts as strong resistance. We’re seeing clear selling pressure on upward moves, which is confirmed by low volume on green candles.
Given this structure, it's likely ADA will retest the lower boundary of the triangle. Therefore, I see a short opportunity here.
Trade Plan:
🔘 Entry: 0.5857
🔴 Stop Loss: 0.6001
🟢 Target: 0.5530
At this stage, ADA does not present a favorable long setup. Only the short side seems worth considering.
HolderStat┆ADAUSD rising topBINANCE:ADAUSDT is breaking out of a falling channel, following a long consolidation period and bullish wedge development. Price action is coiling around 0.58–0.60 and may rally toward 0.65 if the breakout sustains. Historical patterns suggest continued strength from this structure.
ADA - Cardano - BreakEven was hitFollowing my previous post, these sellers on Fib managed to hit my Break Even - there goes our free trade, but no problem. Mark Douglas used to say "every trade is unique" !!!
Enjoy!
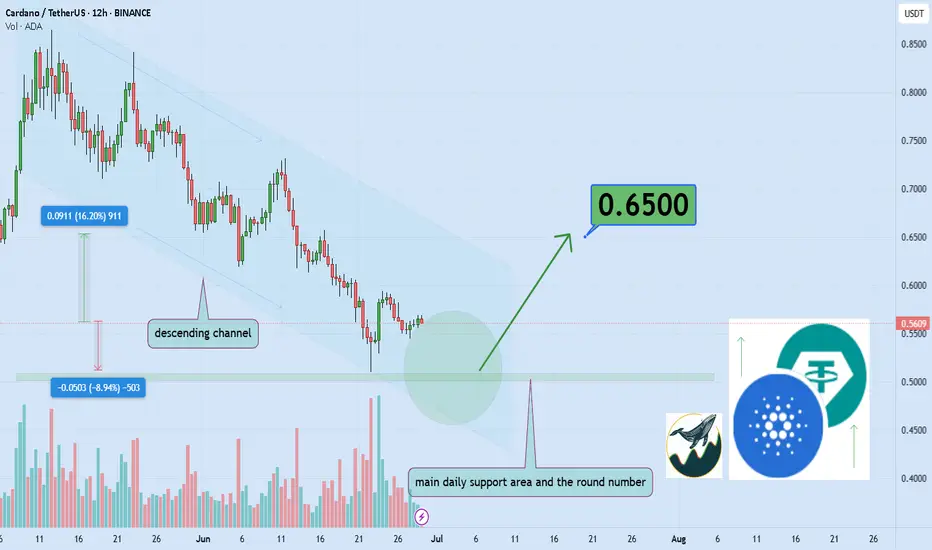
Cardano Eyes 16% Gain, Main Target Set Firmly At 0.65Hello and greetings to all the crypto enthusiasts, ✌
All previous targets were nailed ✅! Now, let’s dive into a full analysis of the upcoming price potential for Cardano 🔍📈.
📉 Cardano is currently trading inside a descending channel, hovering near a key historical support — the strong daily level at the psychological 0.50 mark. This zone could act as a solid base for a potential bounce.
🚀 I’m targeting at least a 16% upside, with a primary resistance around 0.65.
🧨 Our team's main opinion is: 🧨
Cardano is holding a strong daily support near 0.50 within a down channel, setting up for a potential 16%+ rally toward 0.65. 📈
✨ Need a little love!
We put so much love and time into bringing you useful content & your support truly keeps us going. don’t be shy—drop a comment below. We’d love to hear from you! 💛
Big thanks , Mad Whale 🐋
RSI 200This chart includes two simple moving averages (50-day and 200-day) along with the RSI indicator to help spot potential trend changes and momentum in Bitcoin.
It’s set to the daily timeframe for broader swing analysis.
Great for identifying support/resistance zones and golden/death cross signals.
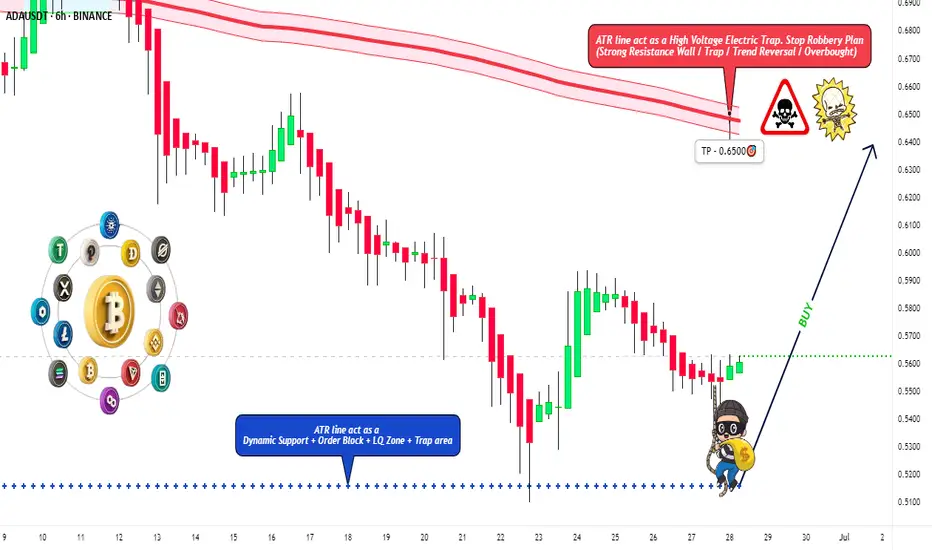
ADA/USD Thief Trading Plan – Bullish Snatch & Run!🚨 ADA/USD HEIST ALERT! 🚨 – Bullish Loot Grab Before the Escape! (Thief Trading Strategy)
🌟 Greetings, Market Pirates & Profit Raiders! 🌟
🔥 THIEF TRADING STRIKES AGAIN! 🔥
💎 The Setup:
Based on our stealthy technical & fundamental heist tactics, ADA/USD is primed for a bullish loot grab! The plan? Long entry with an escape near key resistance. High-risk? Yes. Overbought? Maybe. But the heist must go on!
🎯 Key Levels:
📈 Entry (Vault Cracked!) → Swipe bullish positions on pullbacks (15m-30m precision).
🛑 Stop Loss (Escape Route) → Recent swing low (4H basis) at 0.5290 (adjust per risk!).
🏴☠️ Target (Profit Snatch!) → 0.6500 (or bail early if bears ambush!).
⚡ Scalpers’ Quick Heist:
Only scalp LONG!
Big wallets? Charge in! Small stacks? Ride the swing!
🔐 Lock profits with Trailing SL!
📢 Breaking News (Heist Intel!):
Fundamentals, COT, On-Chain, Sentiment— All hint at bullish momentum!.
🚨 ALERT! News volatility ahead—Avoid new trades during releases! Secure running positions with Trailing SL!
💥 BOOST THIS HEIST! 💥
👉 Hit LIKE & FOLLOW to fuel our next market robbery! 🚀💰
🎯 Profit taken? Treat yourself—you earned it!
🔜 Next heist incoming… Stay tuned, pirates! 🏴☠️💎
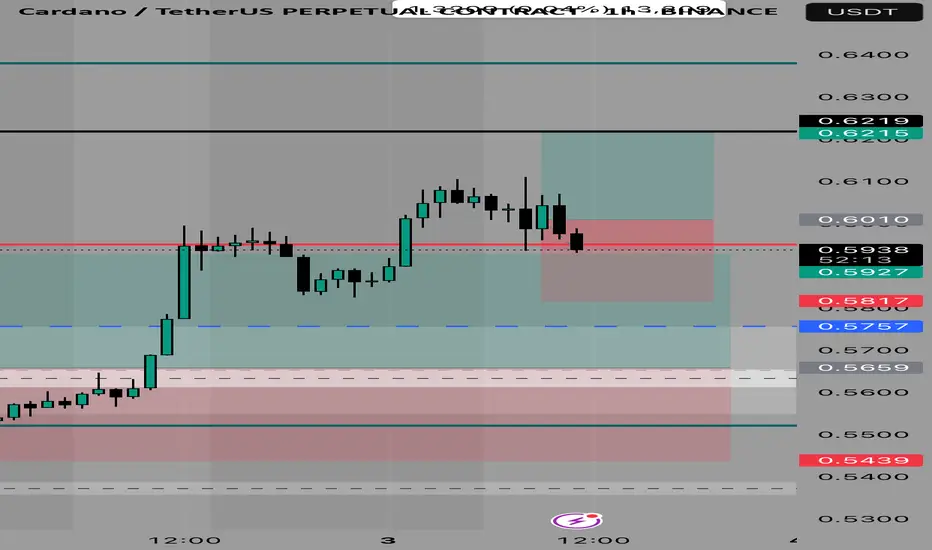
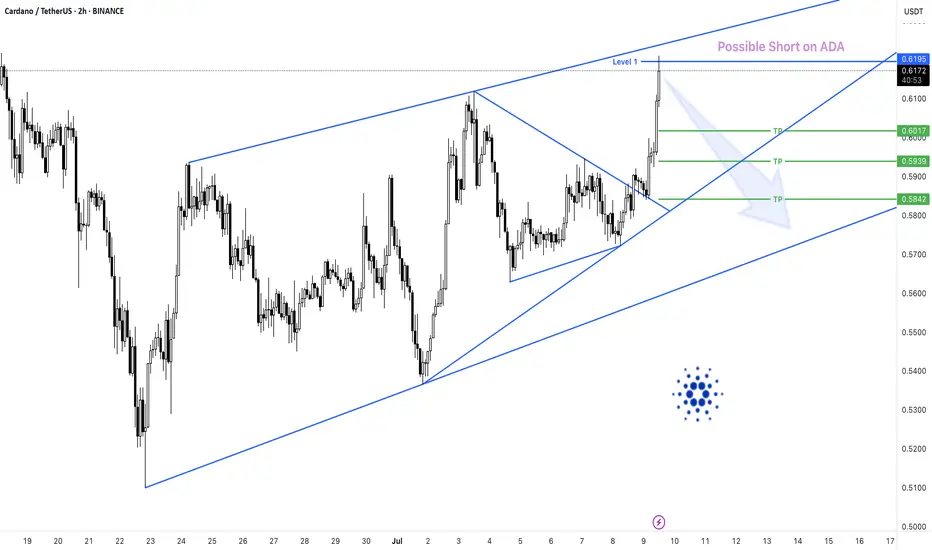
ADA/USDT – Possible ShortADA/USDT – Bearish Reaction from Key Channel Resistance | Short Opportunity
Bias: Short Setup (Counter-Trend)
Cardano (ADA) has reached a significant technical juncture following a strong bullish impulse. Price has tapped into a critical resistance zone marked by:
The upper boundary of a broadening ascending channel
A horizontal liquidity pocket at 0.6195, labeled as “Level 1”
An extended impulsive move without consolidation, suggesting potential overextension
📌 Key Price Levels
Resistance (Short Entry Zone):
Level 1: 0.6195 USDT
Bearish Targets (Take Profits):
TP1: 0.6017 – Local support & minor demand
TP2: 0.5939 – Mid-range value zone
TP3: 0.5842 – Confluence of wedge support & previous demand
The structure resembles a rising broadening wedge, typically a bearish reversal formation, especially after a sharp leg into resistance.
The breakout from the smaller consolidation wedge has now run into major supply, where early short entries may begin to scale in.
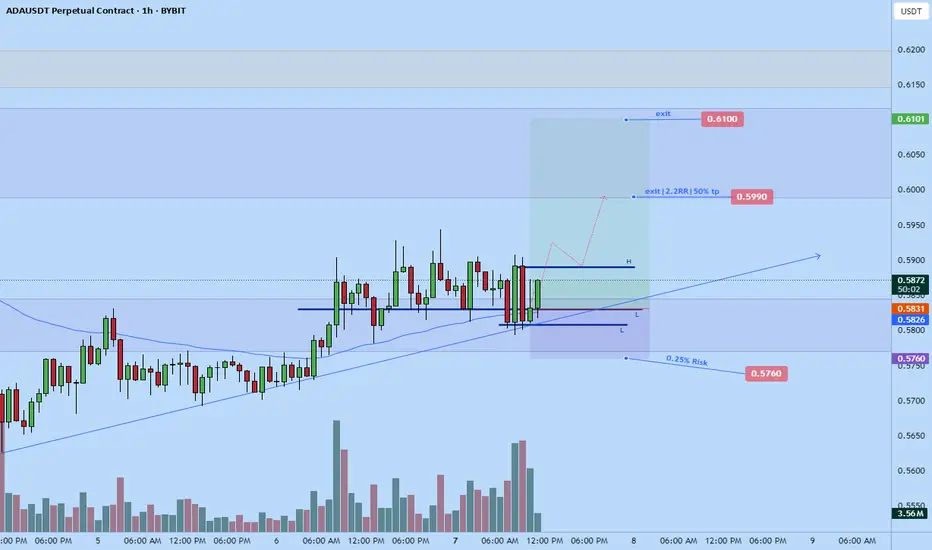
ADA long $0.6-$0.61Recently opened a long position on ADA. On the htf which is where I usually filter my trades it looks good. Looks like we at daily Hl area getting ready to push up. As am typing its spiking up.
Time sensitive
Stop: $0.5760
TP1: $0.5990
Tp2: $0.6100