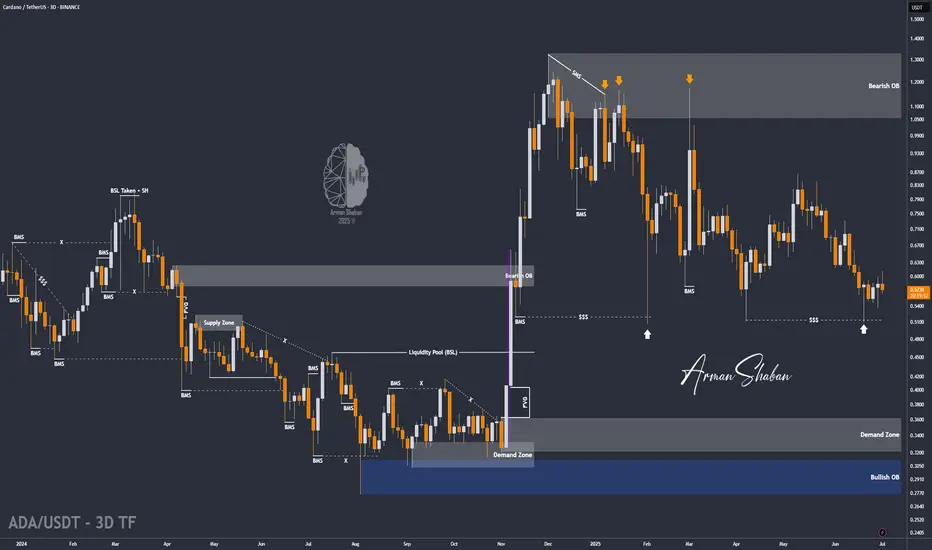
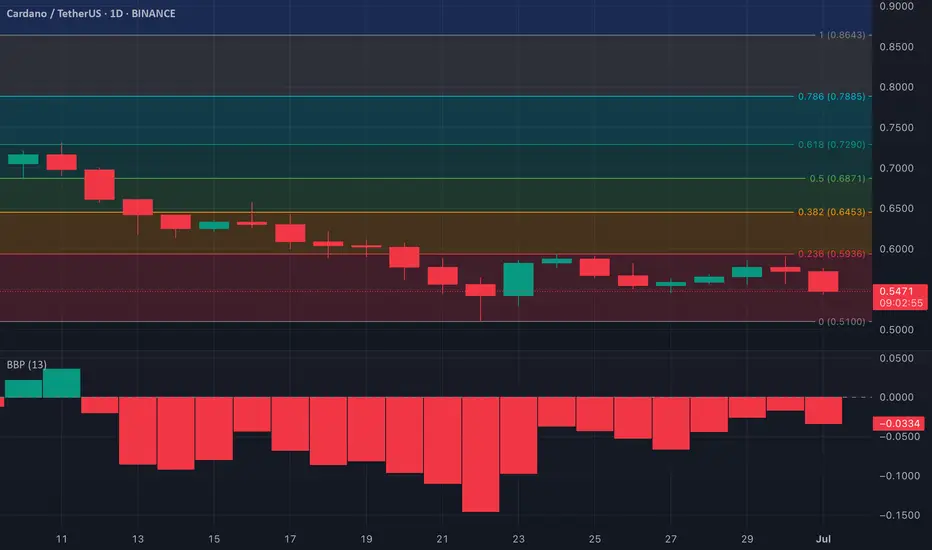
ADA/USDT : First Target Reached, Ready for Next ? (READ)By analyzing the #Cardano chart on the 3-day timeframe, we can see that the price is currently trading around $0.57. After reaching the first target at $0.61, a slight correction occurred, but ADA has managed to hold above the key support level of $0.55 — which is a significant sign of strength. As long as this level holds, we can expect further bullish continuation.
The next potential targets are $0.76, $0.93, $1.05, and $1.33.
The Latest Analysis (Tap for More Details) :
Please support me with your likes and comments to motivate me to share more analysis with you and share your opinion about the possible trend of this chart with me !
Best Regards , Arman Shaban
ADAUST.P trade ideas
ADA Price Prediction
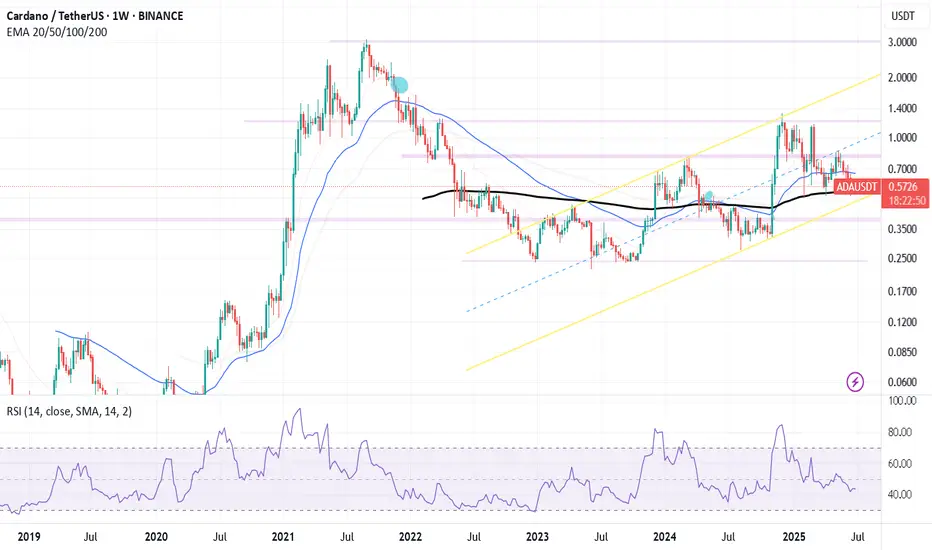
This chart includes two simple moving averages (50-day and 200-day) along with the RSI indicator to help spot potential trend changes and momentum in Bitcoin.
It’s set to the daily timeframe for broader swing analysis.
Great for identifying support/resistance zones and golden/death cross signals.
ada usdt scalp tradeshort term pullback expected from ada, cardano so take it with small amount, trade entry based on 5m, so don't expect bigger targets. must use sl.
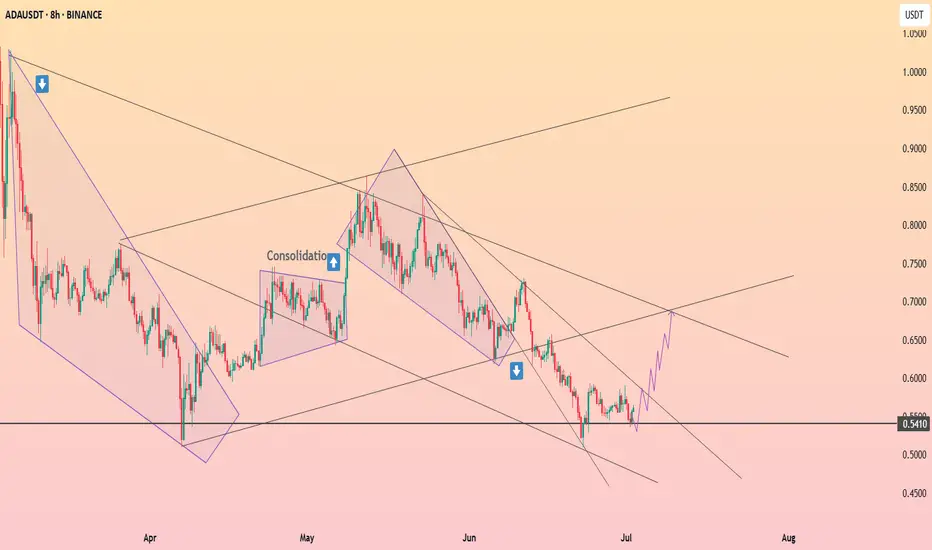
HolderStat┆ADAUSD retesting the support levelBINANCE:ADAUSDT is attempting to reverse from the lower bound of a descending wedge, echoing a previous breakout structure from May. With a bounce forming near 0.54 and price climbing inside a narrowing wedge, a move toward 0.70 could materialize if volume supports the push.
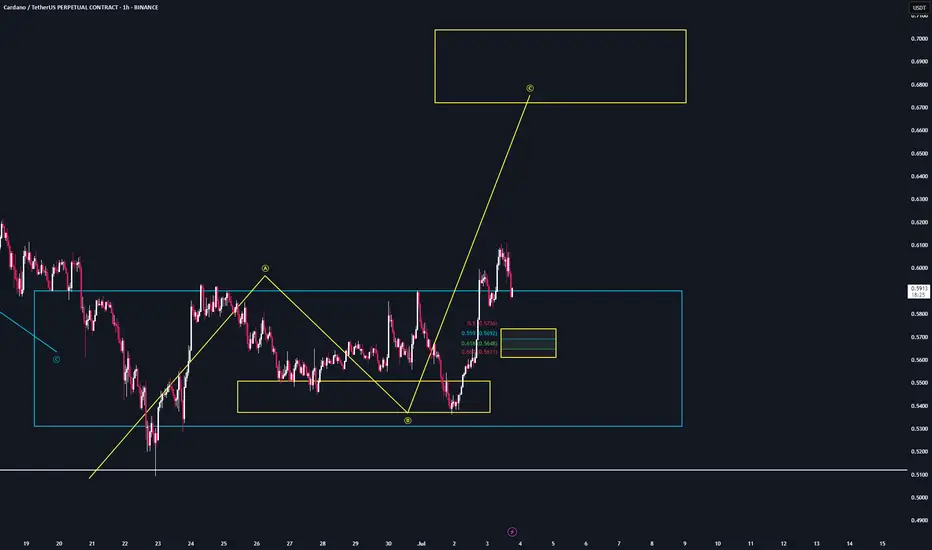
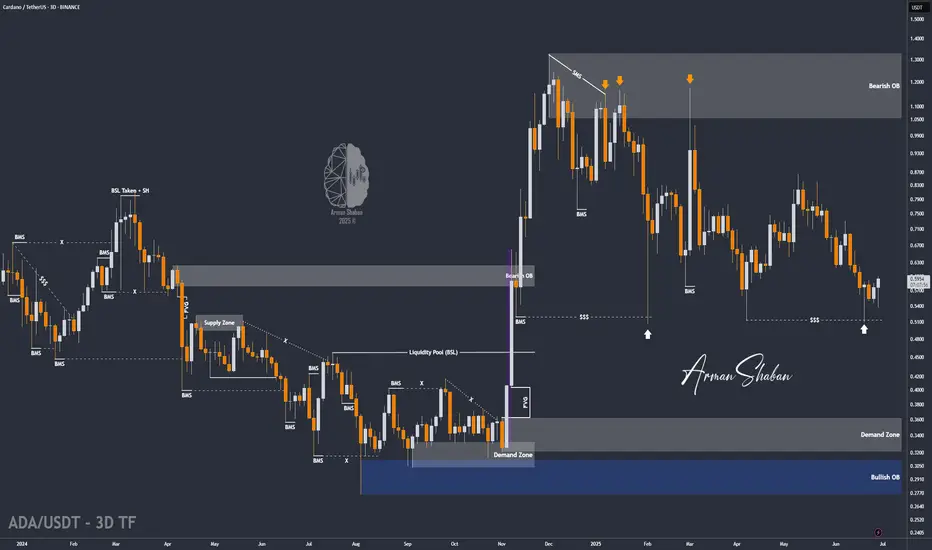
ADA | Trade Setup📌 After the reaction from the bearish target zones (blue), we've now activated a bullish sequence (yellow) in $ADA.
📊 Valid entries are currently forming during a potential B-C correction.
Trademanagement:
I'm placing long orders at each level.
Once the trade reaches a 2 R/R, I’ll move the stop-loss to break-even.
From a 3 R/R onward, I’ll start locking in profits.
Once I’ve locked in my first profits, I’ll share the next profit targets with you.
Head and shoulder pattern ADA short boommmmThere is short expected in Ada due to head and shoulder pattern
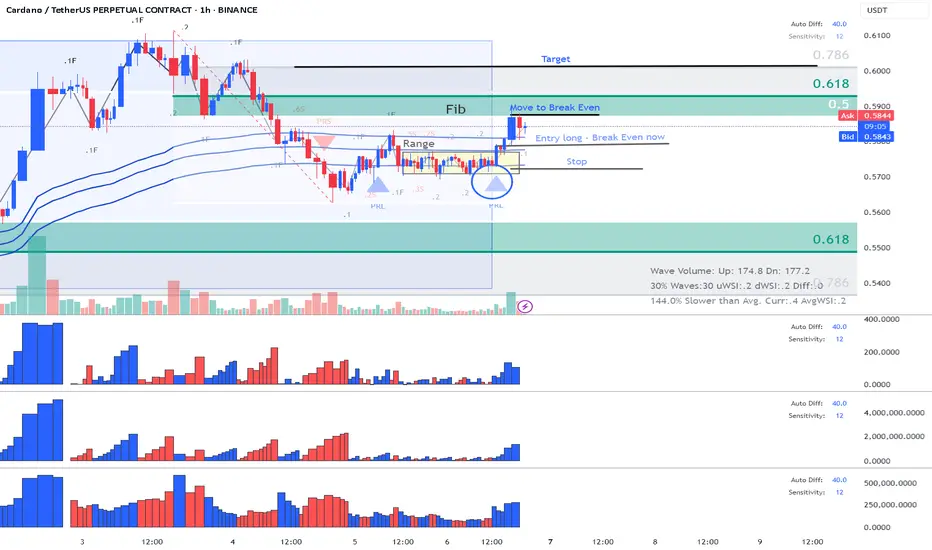
ADA - Cardano - Long - Classic Exit from Range with PRLThis is one of my classic trading strategies called "Exit from Range" with Plutus signal and in this case it was a PRL.
Entered Long on the Exit from range, put my stop and hopping that we might cross Fib. When price reached Fib moved my stop a bit above breakeven to compensate on brokers fees and now we are running a free trade. Currently sellers did show up on the Fib , but let's see who is going to win!
Enjoy!
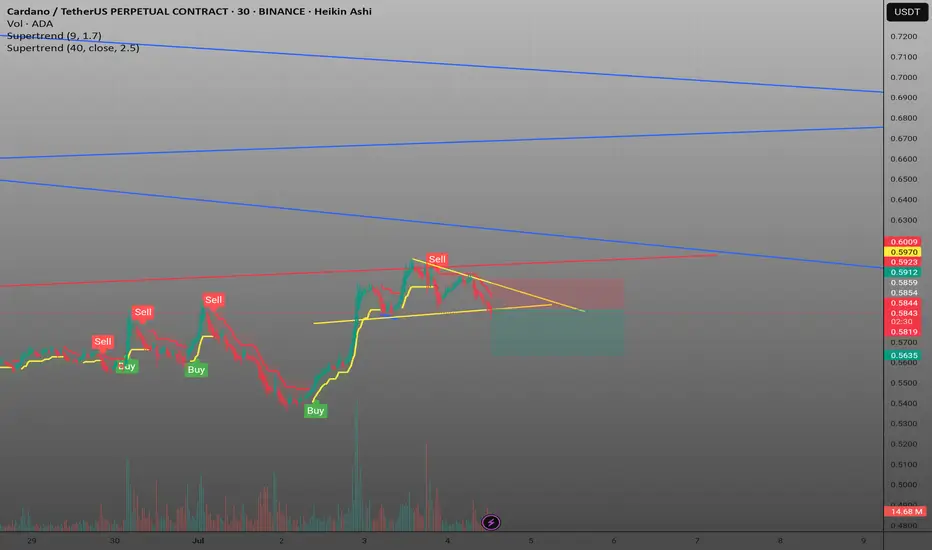
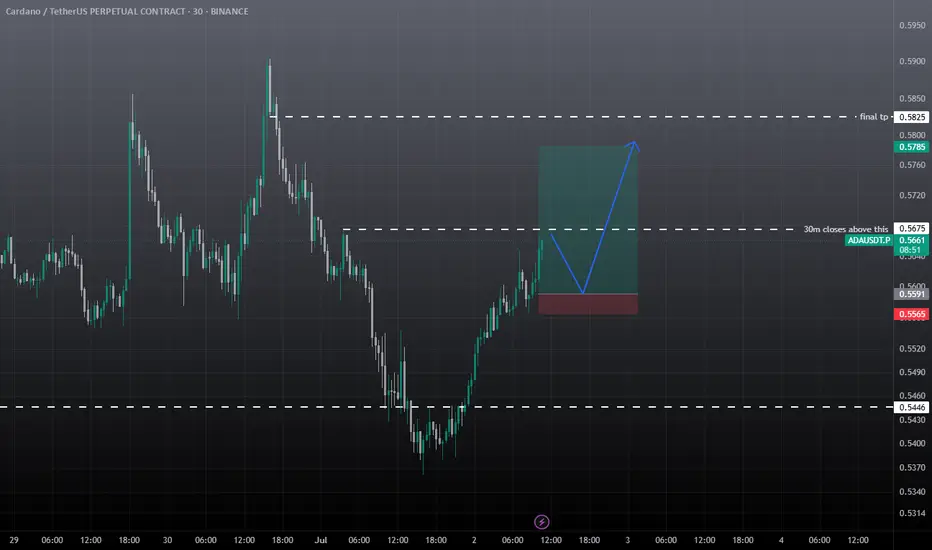
ADAUSDT Intraday SetupAda Showing some good movement. Trade Rules
must gave 30m candle closing above marked area, if wick above marked area then trade will become risky. Must use the sl. Target is given.
If retraces back before the marked area then it also good, in this case 30m marked area will first tp book 30% here, rest hold till final tp or SL.
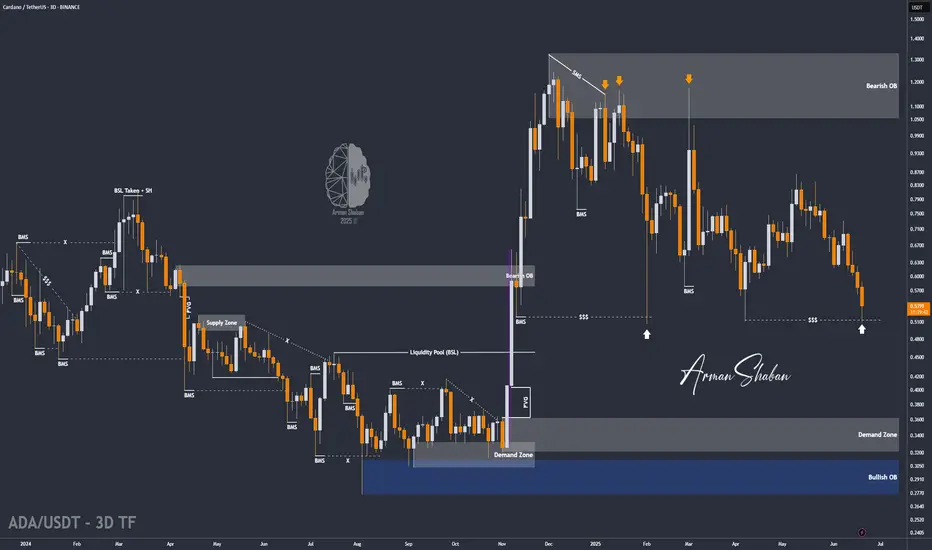
ADA/USDT : Get Ready for another Bullrun (READ THE CAPTION)By analyzing the #Cardano chart on the 3-day timeframe, we can see that the price is currently trading around $0.59. After sweeping the liquidity below $0.51, our bullish outlook for the next upward wave has strengthened significantly.
I'm now expecting a strong move from ADA, with short-term targets at $0.61 and $0.76, and longer-term targets at $0.93, $1.05, and $1.33!
Please support me with your likes and comments to motivate me to share more analysis with you and share your opinion about the possible trend of this chart with me !
Best Regards , Arman Shaban
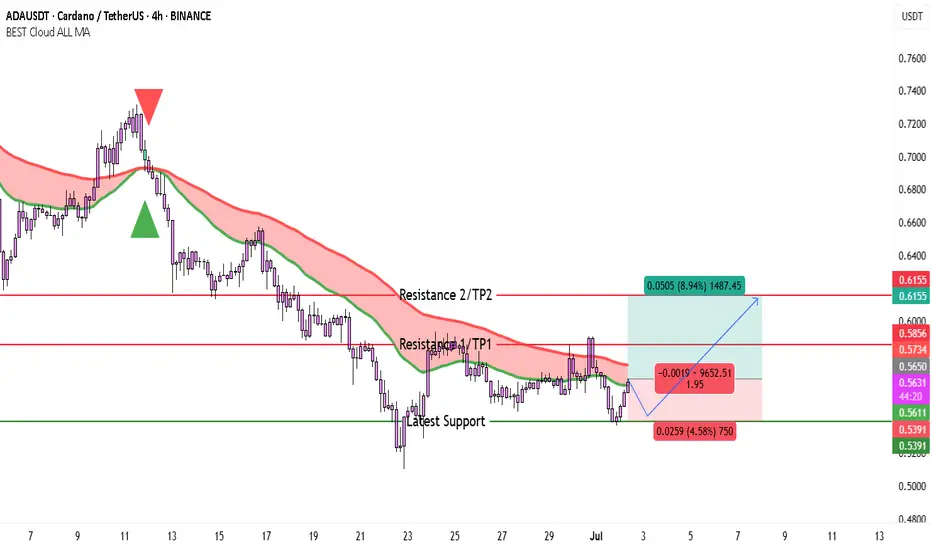
$ADA Bulls Wake Up—Potential 9% Rally If This Level HoldsCardano (ADA) appears to be attempting a short-term recovery after a prolonged decline, as shown in the 4H chart from Binance. The price recently bounced from a well-defined support level around $0.5391, which has held multiple times in recent sessions, confirming buyer interest in this zone. This support also aligns with a previous consolidation range and has proven reliable in the past.
The price is now approaching a zone of dynamic resistance marked by the BEST Cloud ALL MA indicator. This red-shaded cloud represents the bearish control zone, and ADA has repeatedly failed to break through this area in recent weeks. However, ADA is now showing early signs of upward momentum as it consolidates just beneath the first resistance at $0.5734 (also marked as TP1). This resistance corresponds with the bottom of the cloud and recent swing highs.
The broader trend is still bearish, but the structure suggests a possible reversal if bulls can reclaim levels above the cloud. A further push above $0.5734 could attract fresh buying interest and target the next resistance level near $0.6155, which also represents TP2 on the chart. This upper zone served as a breakdown point in mid-June and may now act as a key level to watch.
Meanwhile, the green moving average line (part of the cloud setup) is starting to flatten. This often signals a transition from downtrend to range or even an early reversal—especially when combined with a support bounce and higher low formation.
There’s no clear bullish breakout yet, but the setup looks favorable for a cautious long position.
Trading Idea
• Entry Zone: 0.5550 – 0.5600 (near current consolidation)
• Target 1 (TP1): 0.5734
• Target 2 (TP2): 0.6155
• Stop Loss: Below 0.5391 (e.g., 0.5320 – adjust based on your risk appetite)
• Risk/Reward to TP2: Around 2:1
If price breaks below $0.5391, the bearish structure would be confirmed, possibly leading ADA back toward the $0.50–$0.48 region. But as long as this support holds, the market favors a recovery scenario toward the resistance levels mentioned.
Overall, this is a textbook support-to-resistance play, with potential for an 8–9% upside if bullish momentum sustains. Confirmation through volume breakout above the cloud will further strengthen the case for short-term gains.
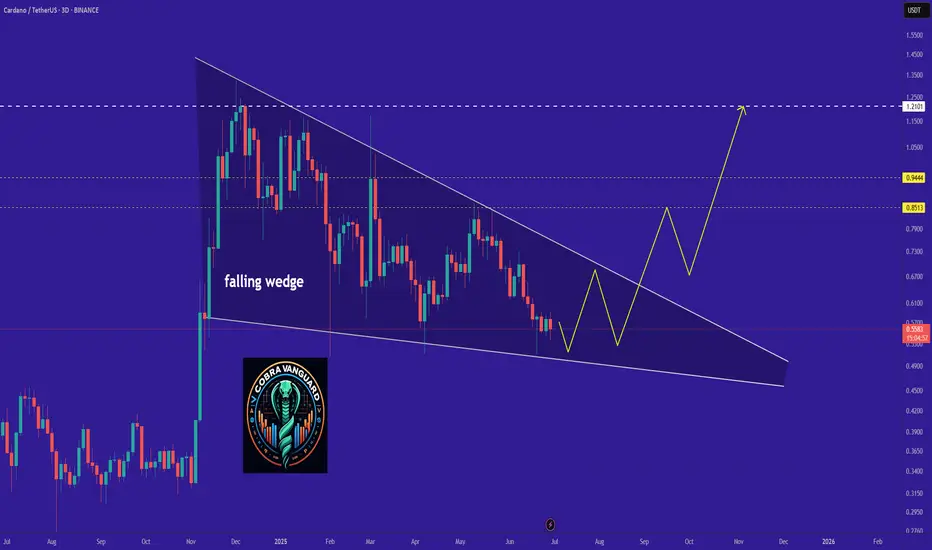
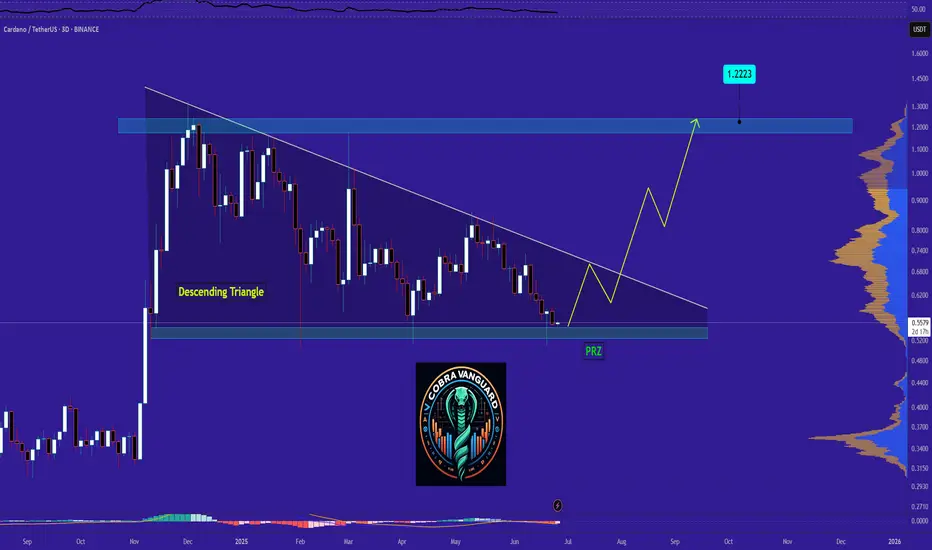
"ADA - Time to buy again!"If the price can break through this Wedge's resistance, I expect it to reach $0.80 in a short time.
Stay Awesome , CobraVanguard.
Trading plan for ADABINANCE:ADAUSDT Today marks a new month, and I've identified key monthly levels to watch. On the higher timeframe chart, we're observing an ABCDE triangle formation - as long as the critical $0.5 level holds, this pattern could resolve upward with potential to break through trendlines. This week, after bouncing from support, we may see price advance toward the monthly pivot point
More details in the video idea itself - enjoy watching!

ADA Price: Bearish Pressure Persists, But Can Bulls Reclaim ContOn the daily chart, ADA’s Elder-Ray Index continues to signal bearish momentum. The indicator has been printing red bars since June 12, confirming sustained seller dominance. The Elder-Ray is negative at the time of writing, showing no signs of immediate relief.
If sellers maintain this pressure, ADA risks sliding toward the $0.51 support zone.
However, should market sentiment improve, a bullish reversal could be in play. A push above $0.59 resistance would open the door for a potential rally toward $0.64.
#ADAUSDT: Is the crypto hype finally over? ADAUSDT is likely to drop first then it can reverse and continue the bullish move upwards of previous all time high. Before we can confirm any entry on this pair we need strong confirmation which will allow us to predict a correct and accurate swing move.
If you like the work then do consider liking and commenting on the idea.
Team Setupsfx_❤️
HolderStat┆ADAUSD formed rising bottomBINANCE:ADAUSDT has formed a symmetrical triangle after finding firm support around 0.54. Previous consolidation zones have led to significant breakouts, and the current structure is showing early signs of a similar rally. If bulls manage to reclaim 0.58, a climb toward 0.66 and 0.70 becomes likely, with upper trendline resistance acting as a magnet for price.
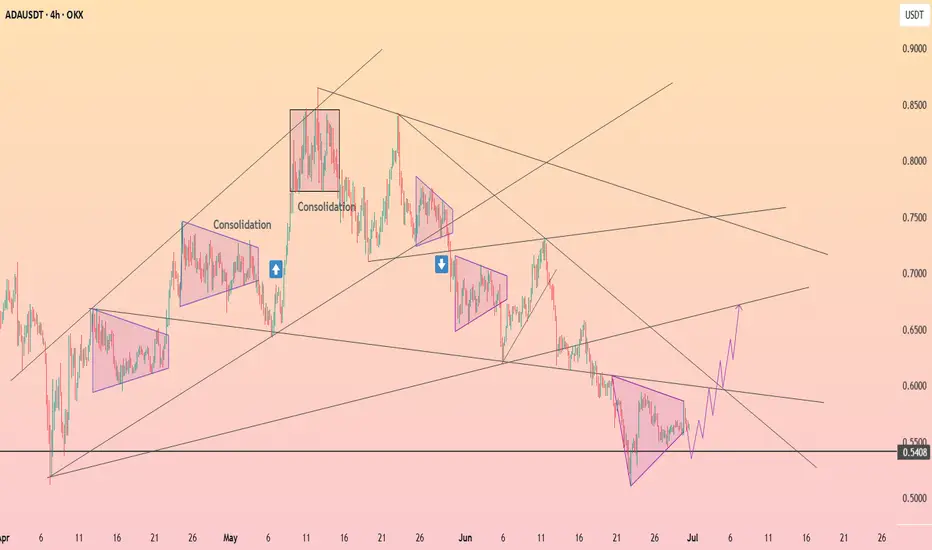
Cardano (ADA): We Are In Bullish Trend | Reaching Pressure PointCardano is in the bullish trend where, on smaller timeframes, we are seeing a good small scalp that can be taken, but be careful...on the 4-hour timeframe, we are approaching the pressure point between the resistance, EMAs, and bullish trend.
More in-depth info is in the video—enjoy!
Swallow Academy

Cardano (ADA): Resistance at $1.11 Incoming | Bullish MovementCardano coin had failed retest and went back inside the sideways channel. As we are inside the channel again, we are looking now for upside movement here, which can send the ADA coin as high as $1.11 so this is where our target is sitting currently.
Swallow Academy

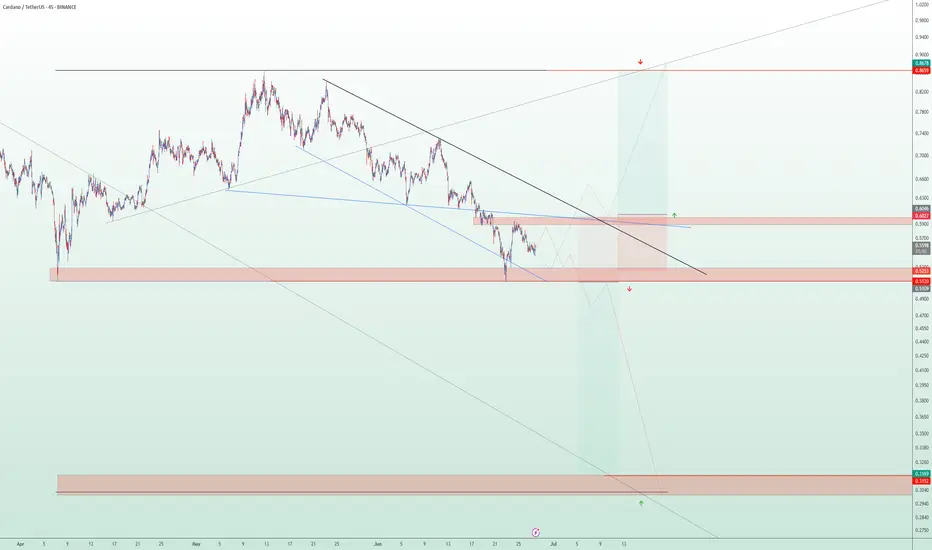
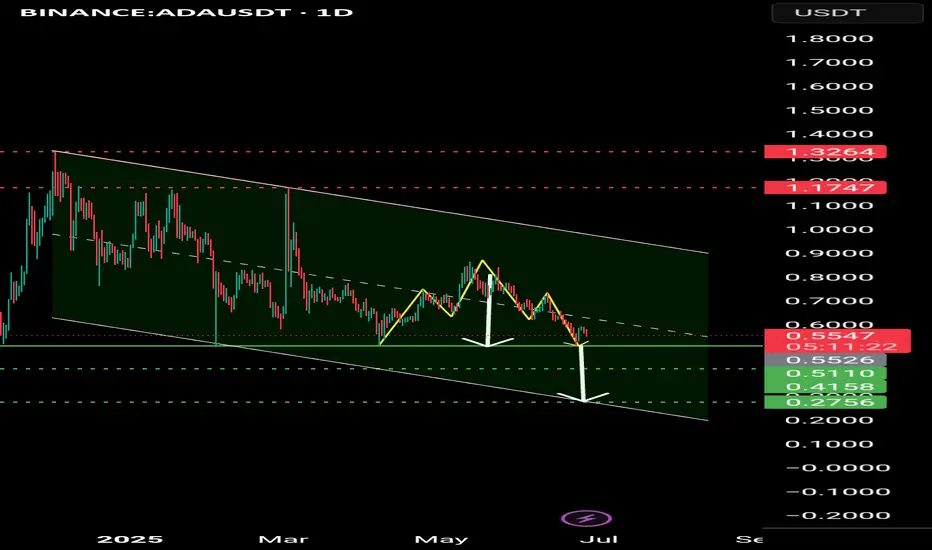
Major Move Ahead for ADA – Breakout or Breakdown?
🔍 ADA/USDT Analysis – Dual Scenario Setup (BUY & SELL)
Currently, ADA is ranging between major supply and demand zones. Two clear scenarios are in play depending on how price reacts to key levels:
📈 Bullish Scenario (Long):
Entry: On breakout and confirmation above $0.6027
Target: $0.869 (major resistance zone)
Stop Loss: Below $0.523
Trigger: Break of descending trendline and solid structure above $0.6027
📉 Bearish Scenario (Short):
Entry: Around $0.5120 (rejection from supply zone)
Target: $0.315 (strong demand zone)
Stop Loss: Above $0.6027
Trigger: Failed breakout and rejection from $0.5120 level, with confirmation below it
📌 Based on the descending channel structure, this might have been the final leg of the downtrend, and a reversal to the upside could be underway. However, for confirmation, we prefer to wait for stronger price action signals before fully committing.
🛑 Always use risk management. Market remains bearish until proven otherwise.
It's disappointing !!!Do you think this will happen, or do you see ADA below $0.50 in the future?
Best regards CobraVanguard.💚
ADA About to Explode or Fakeout Trap?Yello Paradisers — is ADA quietly setting up for a powerful reversal, or are we about to walk straight into a painful bull trap? This zone could decide everything, and here’s why you need to pay close attention.
💎Cardano (ADAUSDT) is currently sitting right on the supportive trendline of a descending channel, while also forming a classic double bottom pattern. What makes this even more significant is the presence of bullish divergence on RSI. This combination alone already hints at a potential bullish reversal, but there’s more to it.
💎The current zone also served as a previous resistance area, and it has now flipped into support—this “resistance-turned-support” structure adds confluence and increases the probability of an upward move. When multiple bullish signals align at a major structural level like this, it usually sets the stage for a strong bounce.
💎Aggressive traders who entered early from current levels are already seeing a potential 1:1 risk-to-reward ratio. However, for safer and more strategic positioning, conservative traders can wait for a pullback to this support zone. Waiting for a bullish confirmation candle after the pullback can offer a better entry with a healthier RR and higher probability of success.
💎That said, if the price breaks below the current support and closes a candle below our invalidation level, the entire bullish idea will be invalidated. In that scenario, the smart move is to remain patient and wait for a new setup to form. Chasing trades after invalidation is how most retail traders get trapped—don’t be one of them.
🎖Strive for consistency, not quick profits. Treat the market as a businessman, not as a gambler. This is the only way you’ll make it far in your crypto trading journey. Be a PRO.
MyCryptoParadise
iFeel the success🌴

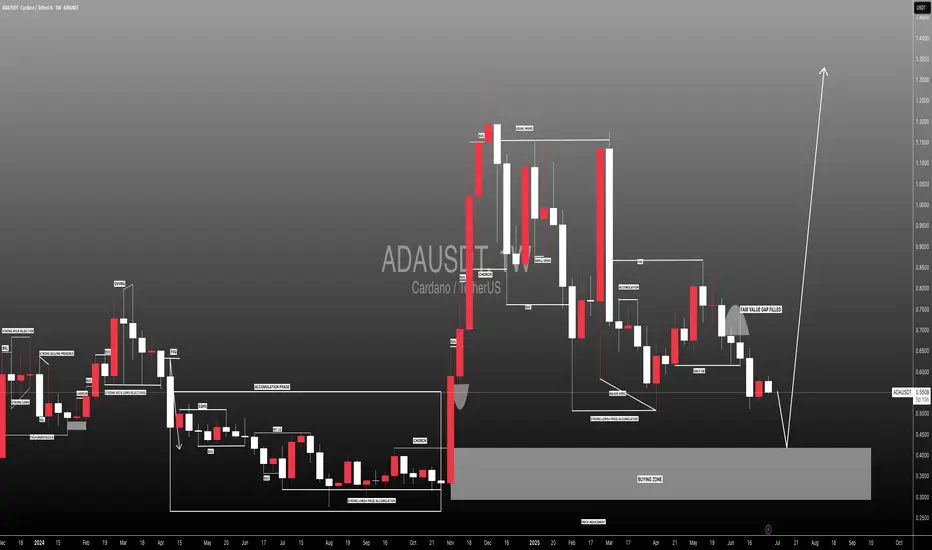
Cardano Correction or Opportunity? (READ THE CAPTION)By analyzing the #Cardano chart on the 3-day timeframe, we can see that after reaching 73 cents and amid rising war tensions, the price started a correction along with the broader crypto market. This correction has now brought ADA to attractive zones for potential laddered buying and long-term investment. Cardano is currently trading around 54 cents, and if the conflict continues, it may drop further, possibly below 45 cents.
Key demand zones are at $0.36, $0.45, and $0.52.
Short-term targets are $0.61 and $0.76, while long-term bullish targets are $0.93, $1.05, and $1.33.
Please support me with your likes and comments to motivate me to share more analysis with you and share your opinion about the possible trend of this chart with me !
Best Regards , Arman Shaban
Cardano sell short go 0.23Cardano is ready for a sharp decline, you should take a sell trade with all your might, targets 0.40, 0.30, and 0.20.
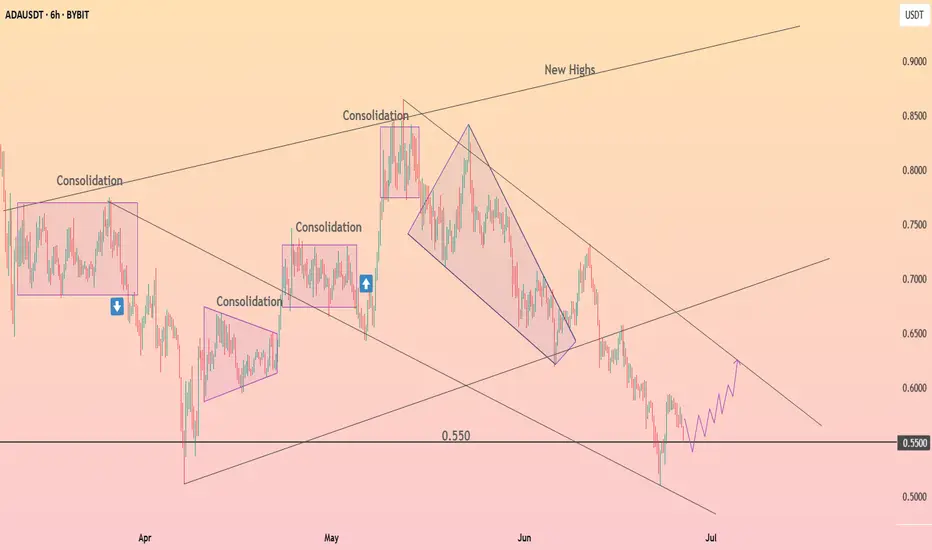
HolderStat┆ADAUSD retest of the supportBINANCE:ADAUSDT has bounced from the 0.55 support level, completing a falling wedge structure. The price now attempts to recover, with a visible bullish wave formation targeting the 0.62 resistance trendline. Multiple past consolidations have preceded breakouts, and if this pattern holds, a strong upside push is possible. Watch for confirmation of continued higher lows.