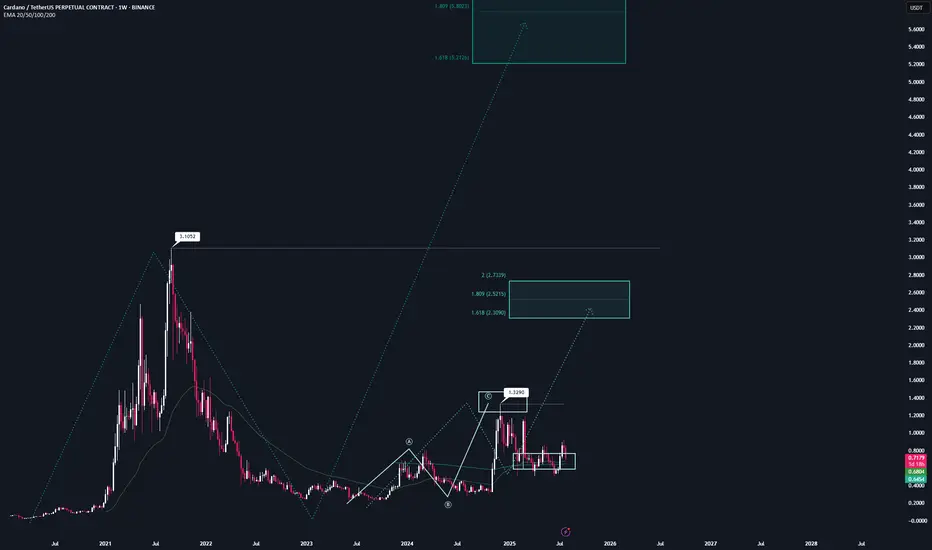
ADA | Full AnalysisHere is the top-down analysis for CRYPTOCAP:ADA as requested 🫡
Weekly Timeframe:
We have one large potential sequence on the weekly chart that will be activated once we break the ATH at $3.1, with a target zone around $5.2. This is also my conservative target for this bull run, assuming we get
Related pairs
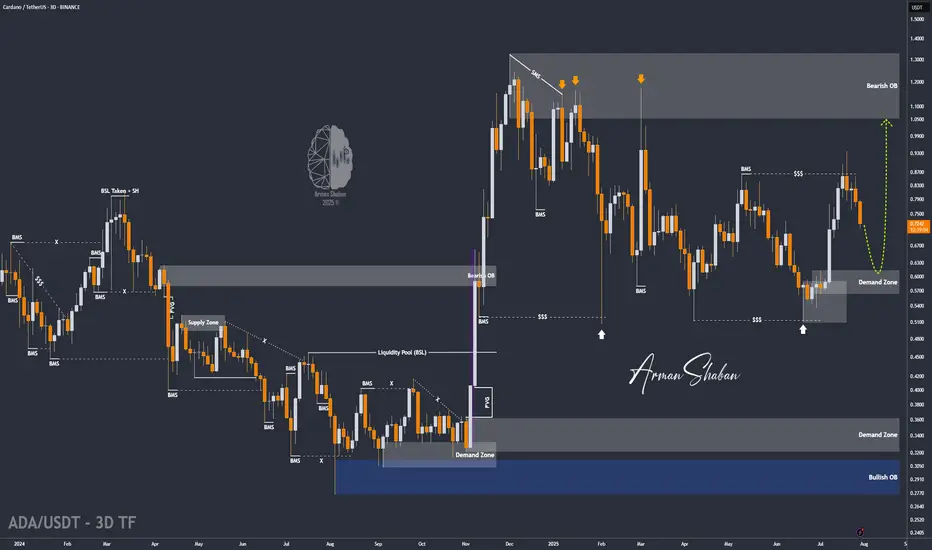
ADA/USDT | Pullback to Key Support – Can It Rebound Toward $1.32By analyzing the Cardano chart on the 3-day timeframe, we can see that after reaching $0.935, the price faced selling pressure and dropped by 18% to the $0.76 area. Now, the key is whether ADA can hold above the $0.75 level by the end of the week. If it succeeds, we could expect further bullish cont
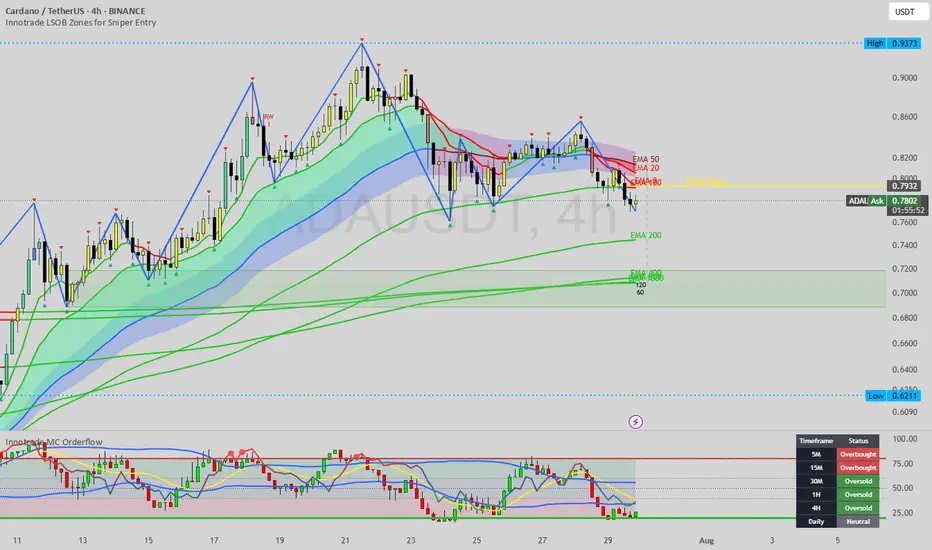
Cardano (ADA): Seeing 1:10 Risk & Rewards Trading OpportunityCardano looks strong, still being above the major support area and showing the buy-side dominance on smaller timeframes. The key point here is the 200 EMA on the 1D timeframe!
More in-depth info is in the video—enjoy!
Swallow Academy

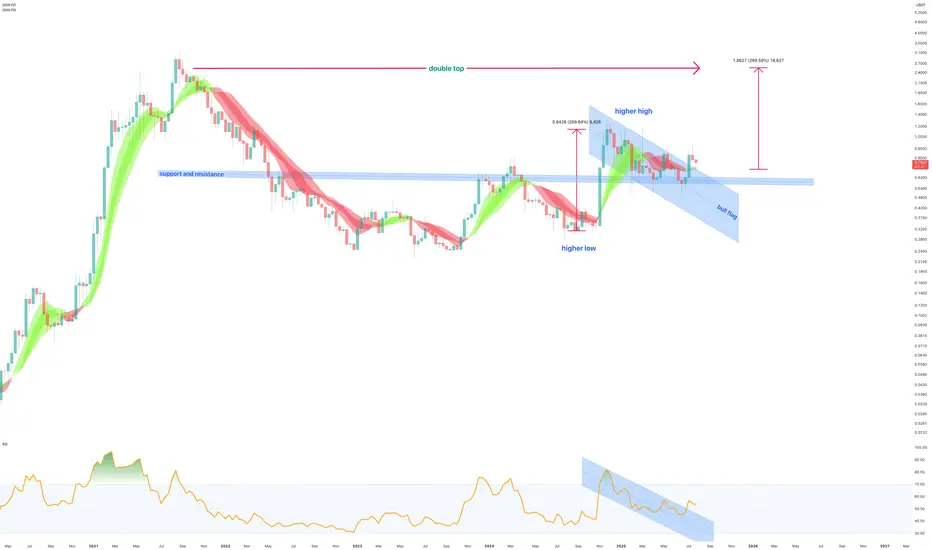
August 4th - Cardano (ADA) bull flag to print 250% move to $2.50
On the above 10 day chart price action is shown with a 40% correction since December last year. A number of reasons now exist for a bullish outlook, including:
Support and resistance
Price action confirms support on past 3 year resistance around 60 cents
Trend reversal
The support confirm
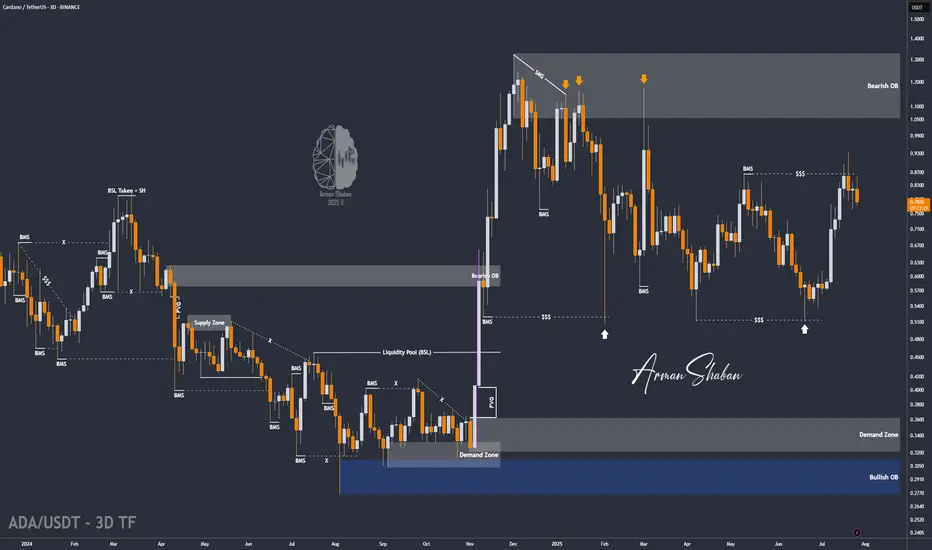
ADA has broken out from a key structure zone near 0.7780ADA - CARDANO, has broken out from a key structure zone near 0.7780
As long as the price remains below this level, the likelihood of a decline toward 0.6490 and potentially 0.5580 remains elevated.
This bearish potential is further supported by BTC, which appears to be entering a broader correcti

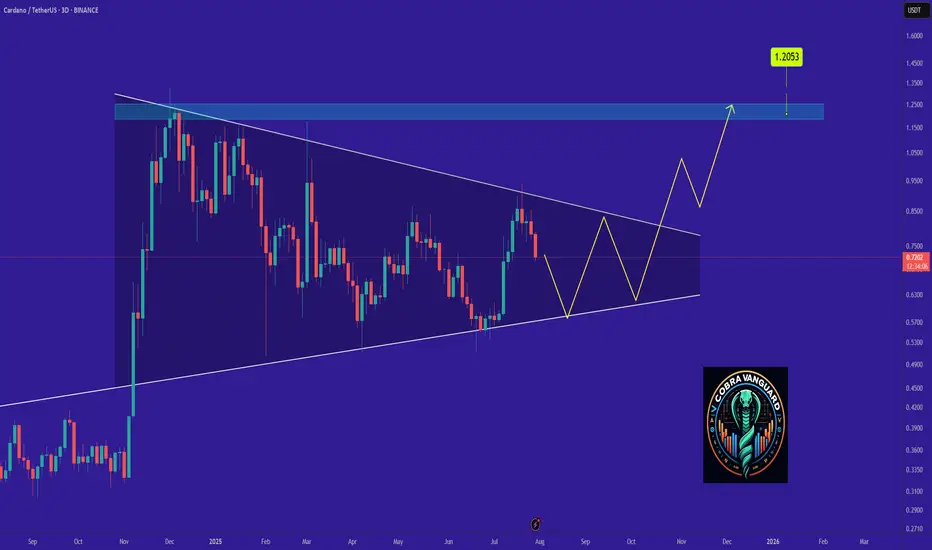
ADA Ready for PUMP or what ?The price on the 3d timeframe is within a triangle, which can create some uncertainty about which direction it will move. Here, we should wait to see which side of the triangle the price breaks out from. Remember, the trend is our friend.
Best regards CobraVanguard.💚
ADA/USDT | ADA Slips Below Support – Watching $0.61 for Support!By analyzing the Cardano chart on the 3-day timeframe, we can see that the price failed to hold above the $0.75 support and is currently trading around $0.72. Given the current momentum, a deeper correction for ADA seems likely. If the price fails to stabilize above $0.69, we could see a sharp drop
Cardano (ADA) at Key Support: A High-Confluence "Buy" Hello, traders.
Today we are focusing on Cardano (ADA), which is currently in a strong, established uptrend. After a significant rally, the price has entered a healthy corrective phase and is now testing a critical zone of technical support. This is a classic "buy the dip" scenario shaping up.
Th
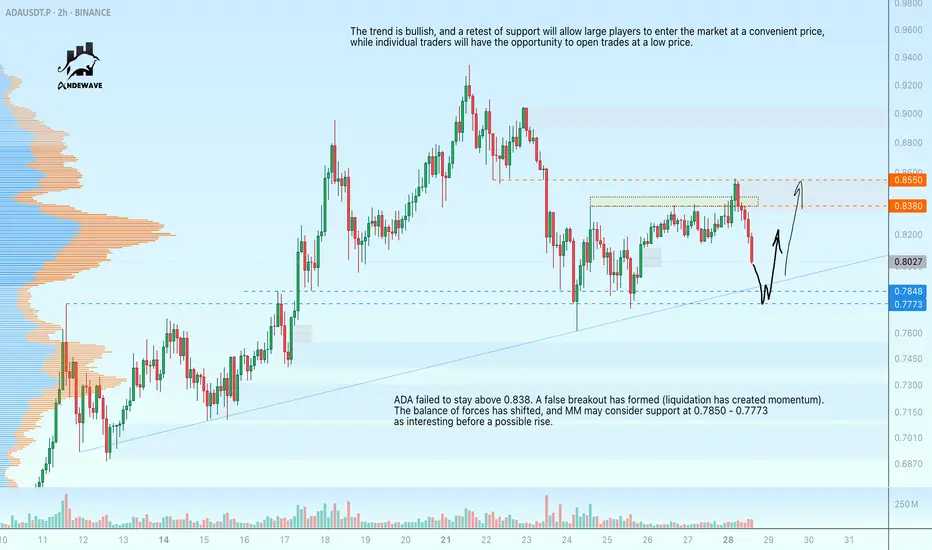
ADAUSDT - retest of support at 0.7850 before growthADA failed to stay above 0.838. A false breakout has formed (liquidation has created momentum). The balance of forces has shifted, and MM may consider support at 0.7850 - 0.7773 as interesting before a possible rise.
The trend is bullish, and a retest of support will allow large players to enter th
Cardano Higher High Hidden Signal Confirmed · UpdateGood news. We already have a higher low and Cardano back into the long-term accumulation zone but on the bullish side. You know a channel has a middle portion always and the lower portion relates to the bears while the upper portion is owned by the bulls. This is the good news, Cardano is staying sa

See all ideas
Summarizing what the indicators are suggesting.
Oscillators
Neutral
SellBuy
Strong sellStrong buy
Strong sellSellNeutralBuyStrong buy
Oscillators
Neutral
SellBuy
Strong sellStrong buy
Strong sellSellNeutralBuyStrong buy
Summary
Neutral
SellBuy
Strong sellStrong buy
Strong sellSellNeutralBuyStrong buy
Summary
Neutral
SellBuy
Strong sellStrong buy
Strong sellSellNeutralBuyStrong buy
Summary
Neutral
SellBuy
Strong sellStrong buy
Strong sellSellNeutralBuyStrong buy
Moving Averages
Neutral
SellBuy
Strong sellStrong buy
Strong sellSellNeutralBuyStrong buy
Moving Averages
Neutral
SellBuy
Strong sellStrong buy
Strong sellSellNeutralBuyStrong buy
Displays a symbol's price movements over previous years to identify recurring trends.
Frequently Asked Questions
The current price of ADA / UST (ADA) is 0.72316000 USDT — it has fallen −0.64% in the past 24 hours. Try placing this info into the context by checking out what coins are also gaining and losing at the moment and seeing ADA price chart.
ADA / UST price has fallen by −5.14% over the last week, its month performance shows a 30.40% increase, and as for the last year, ADA / UST has increased by 110.03%. See more dynamics on ADA price chart.
Keep track of coins' changes with our Crypto Coins Heatmap.
Keep track of coins' changes with our Crypto Coins Heatmap.
ADA / UST (ADA) reached its highest price on Sep 2, 2021 — it amounted to 3.09890000 USDT. Find more insights on the ADA price chart.
See the list of crypto gainers and choose what best fits your strategy.
See the list of crypto gainers and choose what best fits your strategy.
ADA / UST (ADA) reached the lowest price of 0.07578100 USDT on Sep 23, 2020. View more ADA / UST dynamics on the price chart.
See the list of crypto losers to find unexpected opportunities.
See the list of crypto losers to find unexpected opportunities.
The safest choice when buying ADA is to go to a well-known crypto exchange. Some of the popular names are Binance, Coinbase, Kraken. But you'll have to find a reliable broker and create an account first. You can trade ADA right from TradingView charts — just choose a broker and connect to your account.
Crypto markets are famous for their volatility, so one should study all the available stats before adding crypto assets to their portfolio. Very often it's technical analysis that comes in handy. We prepared technical ratings for ADA / UST (ADA): today its technical analysis shows the sell signal, and according to the 1 week rating ADA shows the buy signal. And you'd better dig deeper and study 1 month rating too — it's buy. Find inspiration in ADA / UST trading ideas and keep track of what's moving crypto markets with our crypto news feed.
ADA / UST (ADA) is just as reliable as any other crypto asset — this corner of the world market is highly volatile. Today, for instance, ADA / UST is estimated as 5.37% volatile. The only thing it means is that you must prepare and examine all available information before making a decision. And if you're not sure about ADA / UST, you can find more inspiration in our curated watchlists.
You can discuss ADA / UST (ADA) with other users in our public chats, Minds or in the comments to Ideas.