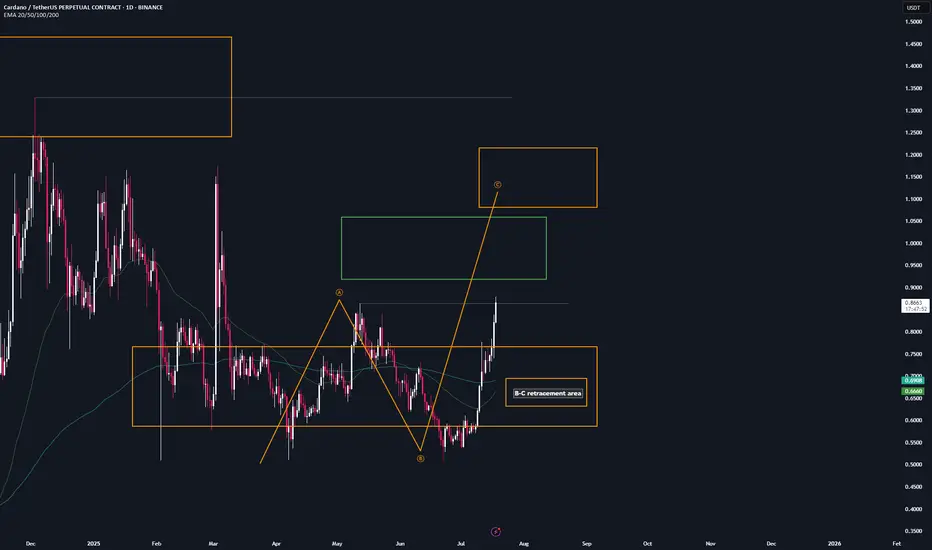
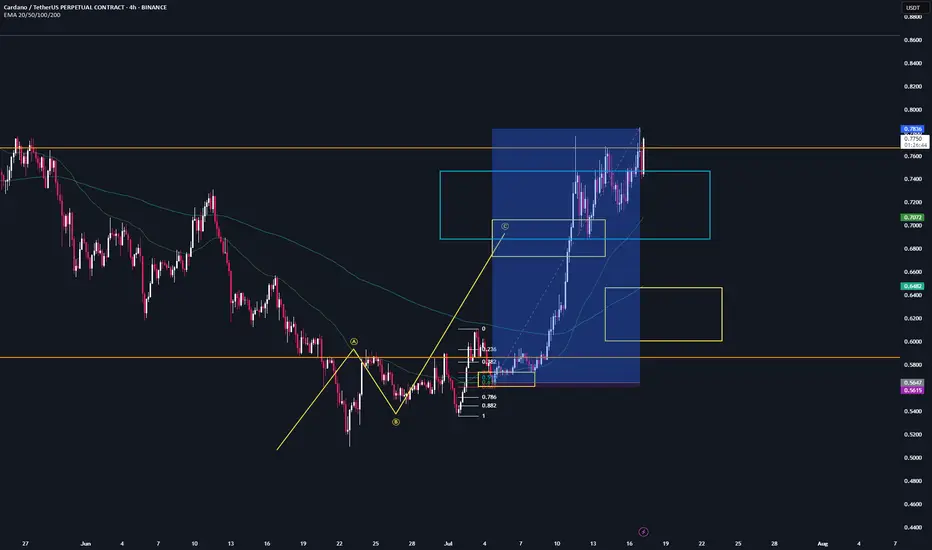
ADA | Trade setup📌 After the breakout from the last high at $0.86, a bullish sequence (orange) has now been activated.
📊 These setups typically occur no more than twice per year on any given altcoin, so I’ll be aggressively buying each level at the B-C retracement area.
Trademanagement:
- I'm placing long orders at each level. ((If the price continues climbing, I’ll adjust the trend reversal level (green) accordingly and update my limit orders.)
- Once the trade reaches a 2 R/R, I’ll move the stop-loss to break-even.
- From a 3 R/R onward, I’ll start locking in profits.
✅ I welcome every correction from here on —
but I won’t enter any new positions at these top levels.
Stay safe & lets make money
ADAUST trade ideas
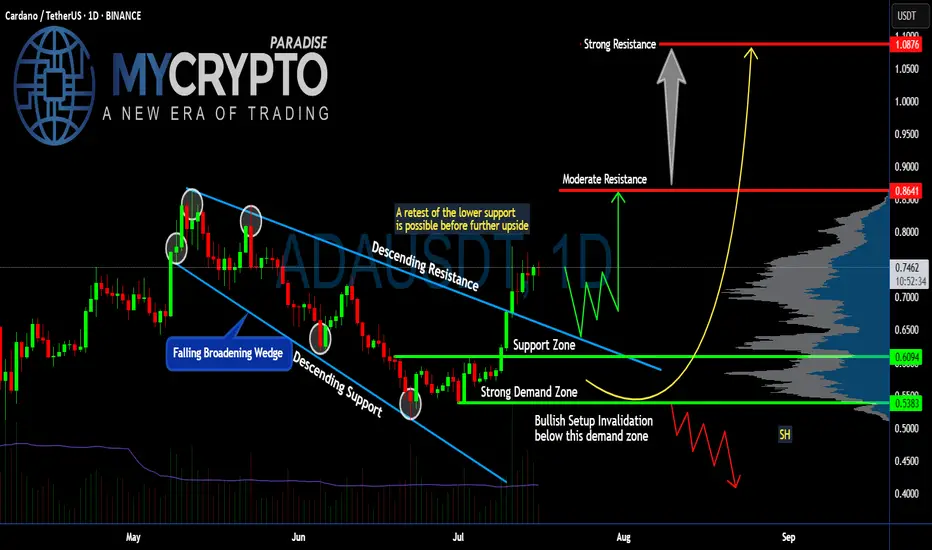
Is #ADA Ready For a Major Move or a Trap is Ahead? Watch this Yello, Paradisers! Is this breakout on #Cardano the start of a major upside move or just another bull trap waiting to flush out impatient traders? Let’s break down the latest #ADAUSDT setup:
💎After weeks inside a falling broadening wedge, #ADA finally broke above the descending resistance, signaling a potential trend reversal. The breakout above $0.70 has pushed the price toward the current $0.74 zone. The soaring volume and a positive broader market outlook reinforce our bullish bias. While this looks bullish, the key question is whether #ADAUSD will hold above its reclaimed support or retest lower levels first.
💎The structure is straightforward: #ADA reclaimed the support zone around $0.70 after bouncing strongly from the demand zone near $0.61–$0.60. This demand zone remains the critical area to watch—any healthy retest here would provide a high-probability continuation setup for bulls.
💎If buyers maintain control, the first target sits at the moderate resistance of $0.86. That’s where the next notable selling pressure is expected. But the real battle will take place near the strong resistance at $1.08—a zone where major distribution and profit-taking could occur.
💎However, the bullish setup becomes invalid if #ADAUSD loses the $0.61–$0.60 demand zone. A confirmed close below $0.538 would flip the structure bearish, signaling a potential continuation to lower lows.
Stay patient, Paradisers. Let the breakout confirm, and only then do we strike with conviction.
MyCryptoParadise
iFeel the success🌴
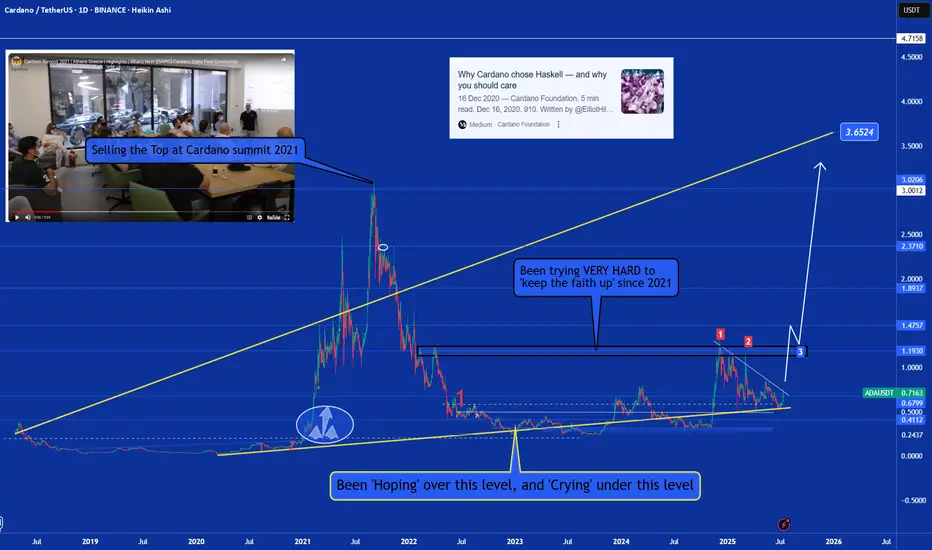
Cardano: Still Boring or Finally Ready to Move?🧐🔁 Cardano: Still Boring or Finally Ready to Move? 🚦📈
Welcome to the Altcoin Series, kicking off this weekend with none other than Cardano (ADA).
Later on I will explain why i will be 'Divorcing Alts' and just trade them, but that time will be at the cycle end, not now.
It’s Saturday, July 12th — a classic retail weekend after a solid macro pump. Salaries are hitting accounts, the charts are alive again, and it's time to look at structure over sentiment.
🔍 A Personal Note on ADA
I was fortunate to exit near the top during the Cardano Summit in Athens (2021) — not just due to chart structure, but after meeting with developers and understanding how deeply Haskell shapes this ecosystem. And what a challenge that seemed!
Haskell, while academically impressive, has proven difficult to scale, and in practice, it's slowed down development. Expectations were sky-high, but reality hit hard. And let’s be honest — Cardano has been boring for years.
But that boredom may be hiding something...
I’ve still been 'going Long' under key levels, because when you zoom out — Cardano is still U.S.-centric , regulation-aware, and deeply rooted . In a time when the U.S. might look to lead crypto adoption, especially with figures like Trump signaling support , Cardano could become part of that narrative.
⚙️ Technical Setup
The recent pump from Nov–Dec 2024 was rejected right at $1.193 — our second test of that critical resistance. But now, we’re staring down a potential third test, with Test #3 marked on the chart near $1.15, and this time, the context is shifting.
✅ TOTAL3 structure is bullish
✅ Retail energy is back
✅ Altcoin momentum is quietly building
🔑 Key Levels
Support Zone:
🟢 $0.70–$0.71 — the current base to hold
Target Zones:
🔹 $1.15–$1.19 — Third test of resistance
🔹 $1.47
🔹 $1.89
🔹 $3.02
🔹 Top Extension Target: $3.65
A break above that descending level could turn this "boring" coin into one of the cleanest long continuation setups of the cycle.
📌 We trade technicals, not hope:
✅ Buy over support
✅ Exit under resistance
✅ Control risk, always
So… will Cardano keep boring us? Or is it finally time for a show?
One Love,
The FXPROFESSOR 💙
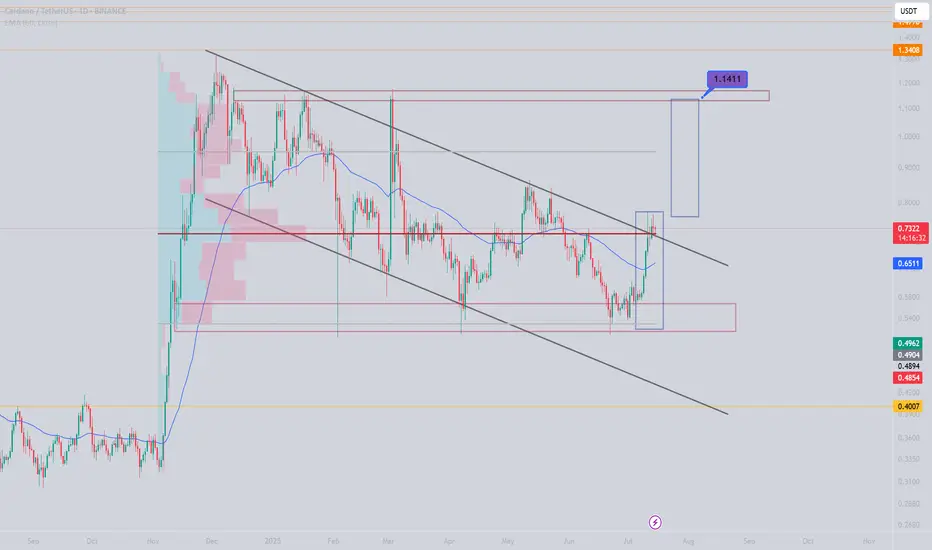
ADA - Monitor BreakoutWe have already seen ADA breakout of its symmetrical triangle, but if BTC does have a downswing we could see ADA retest the triangle as support to provide entries.
Retest would most likely align somewhere between $0.72-$0.74.
However the 1D RSI is showing tremendous strength with the bounce from the 70 level, so if there is no retest and price continues to breakout, our primary target would be around $1.14.

Cardano ADA price analysis🪙 Five months ago, we published a medium-term trade for CRYPTOCAP:ADA , and the price still remains in the buying zone.
With the current growth, the price of OKX:ADAUSDT remains in consolidation, and when the correction begins, it would be very good if it stayed above $0.60.
😈 If you still have faith in the prospects of the #Cardano project, you can continue to hold or even buy #ADA during the correction.
Well, theoretically possible targets for the #ADAusd price are:
TP1 - $1.75
TP2 - $2.90
TP3 - $6.40
_____________________
Did you like our analysis? Leave a comment, like, and follow to get more

ada chart analysiscardano weekly chart analysis n arrows indicating that how will price react in upcoming
days or months,

ADA: Keep an eye on this setup!If you're looking to trade ADA at the moment, here's a quick setup that you might find helpful!
The idea is: Buy when the price breaks above $0.775 and take profits at the levels shown in the chart.
Targets:
1. $0.82
2. $0.9
3. $0.98
-------------------------------------------
About our trades:
Our success rate is notably high, with 10 out of 11 posted trade setups achieving at least their first target upon a breakout price breach (The most on TW!). Our TradingView page serves as a testament to this claim, and we invite you to verify it!

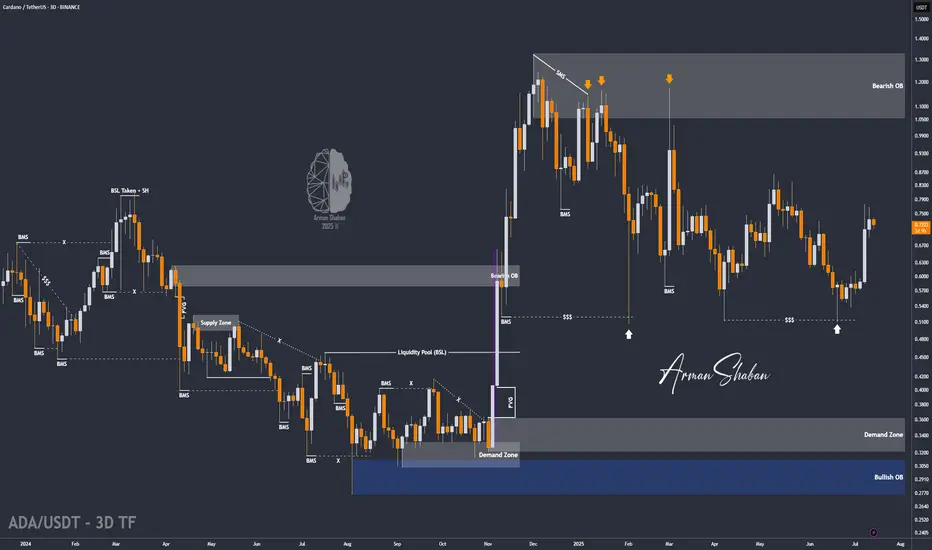
ADA/USDT : +50% in 21 Days, More Rise Ahead? (READ THE CAPTION)Over 50% growth in just 21 days — Cardano’s explosive rally continues, and the $0.76 target has now been hit! Since our last analysis, ADA has kept pushing higher, successfully reaching the next key level and bringing the total return from this move above 50%. Currently trading around $0.73, with strong bullish momentum still in play, I expect it won’t be long before we head toward the next targets. Upcoming levels to watch: $0.93, $1.05, and $1.33 — we’re getting closer to that 100% gain!
Please support me with your likes and comments to motivate me to share more analysis with you and share your opinion about the possible trend of this chart with me !
Best Regards , Arman Shaban
ADA all the way Cardano's Ascent: A Technical Outlook for Q3-Q4 2025
Breaking Through Resistance: Cardano's Path to $1.00 and Beyond
Following a period of extended consolidation, Cardano (ADA) has demonstrated a significant shift in character, breaking out decisively from a key resistance zone. Currently trading near $0.82 as of July 18, 2025, ADA has entered a new phase of bullish momentum. This analysis will dissect the technical landscape to project its potential trajectory through the end of the year, identifying critical price levels and probable targets.
Current Market Context
After consolidating in a range between $0.70 and $0.77 for several weeks, ADA has executed a powerful breakout, surging over 15% in the last few days to establish a multi-month high at $0.825. This move signals a clear victory for buyers and a potential end to the preceding sideways market structure. The immediate challenge for bulls is to defend this breakout level and convert prior resistance into firm support, setting the stage for the next major leg higher.
RSI Analysis: Emerging Strength with Room to Run
The recent price surge has propelled the daily Relative Strength Index (RSI) into overbought territory, currently reading above 70. While this often signals a short-term exhaustion and suggests a minor pullback or consolidation is likely, the underlying momentum on higher timeframes remains constructive.
The weekly RSI is trending sharply upwards from the neutral 50-level but remains well below the extreme overbought readings (80+) that have historically marked major cycle tops for ADA. This divergence between short-term overbought conditions and long-term momentum capacity is a classic sign of a healthy, strengthening trend. It indicates that while a brief pause is probable, the primary path of least resistance remains upward for the coming months.
Price Action & Volume Analysis: The Anatomy of a Breakout
The price action leading up to this point exhibits classic signs of accumulation followed by a markup phase:
Accumulation Phase: The trading range between $0.70 and $0.77 showed contracting volatility and was likely a period of "cause-building," where informed market participants accumulated positions.
Sign of Strength (SOS): The recent impulsive move from $0.77 to over $0.82 represents a clear SOS. This breakout was likely accompanied by a significant increase in volume, confirming the market's conviction and overwhelming sellers who were active at the resistance level.
A successful retest of the breakout zone at $0.75 - $0.77 on diminishing volume would be the strongest possible confirmation of a new, sustainable uptrend.
Supply and Demand Zone Analysis: Charting the Path Forward
The recent breakout has fundamentally altered the market structure, turning a key supply zone into a new floor of demand.
Major Demand Zone (New Support): A critical demand zone has now been established between $0.75 - $0.77. This area, formerly resistance, is now the most important level for bulls to defend to maintain the bullish structure.
Secondary Support Cluster: Should the primary zone fail, the next significant support lies at $0.68 - $0.70, the floor of the previous accumulation range.
Overhead Supply Zones: Unlike an asset at all-time highs, ADA faces historical resistance. The next major supply zones are located near $0.95 and, more significantly, the psychological and technical barrier at $1.10 - $1.15.
Fibonacci Extension Framework: Projecting Bullish Targets
Using the recent swing low of the accumulation phase (approx. $0.70) and the recent swing high ($0.825), we can project logical price targets for the current impulse wave:
The 127.2% extension projects a target of approximately $0.88.
The 161.8% extension, a common target for strong trends, points toward $0.92.
A more extended move to the 200% extension suggests a potential test of $0.97, aligning closely with the psychological $1.00 level.
These Fibonacci-derived targets provide a clear roadmap for the potential upside if the current bullish momentum is sustained.
Price Projection Timeline
Late July - August 2025:
Expect a period of consolidation or a healthy pullback. The overbought daily RSI suggests the market needs to pause. A retest of the $0.77 support level would be a prime opportunity for trend-continuation entries. A successful defence of this zone is critical.
September - October 2025:
Following the consolidation, the trend is expected to resume, targeting the Fibonacci extension levels of $0.88 - $0.92. This move would represent the confirmation of the new uptrend and would likely attract a second wave of buyers.
November - December 2025:
Should the Q4 market environment remain favourable, a push toward the major psychological and technical resistance at $1.00 - $1.15 is highly probable. This would represent a significant milestone and could trigger a more substantial corrective phase as long-term holders take profits.
Support Zones:
Primary: $0.75 - $0.77 (The breakout point; must hold)
Secondary: $0.68 - $0.70 (Floor of the previous range)
Resistance & Target Zones:
Immediate: $0.825 (Recent high)
Target 1: $0.88 - $0.92 (Fibonacci cluster)
Target 2: $0.97 - $1.00 (Fibonacci & psychological level)
Major Resistance: $1.10 - $1.15 (Historical supply zone)
Conclusion: The Road to One Dollar
The technical evidence strongly suggests that Cardano has initiated a new bullish impulse wave. The breakout from its multi-week consolidation range is a significant technical event that has shifted the market bias firmly in favour of the bulls. While a short-term pullback to retest the breakout level around $0.77 is a high probability, this would likely serve as a healthy reset before the next major advance.
Based on the confluence of price action, momentum analysis, and Fibonacci projections, a move toward the $0.95 - $1.15 range is a realistic objective for Cardano by the end of 2025.
ADA | Trade-updateWe’re in full profit on our CRYPTOCAP:ADA trade.
I took the final profits at the target zone (yellow); just a small portion is still running.
Gave yall that one for free — 68 R/R, lol.
Your win rate doesn’t need to be high — 30–40% with solid R/R is enough to be profitable.
Have a blessed day!
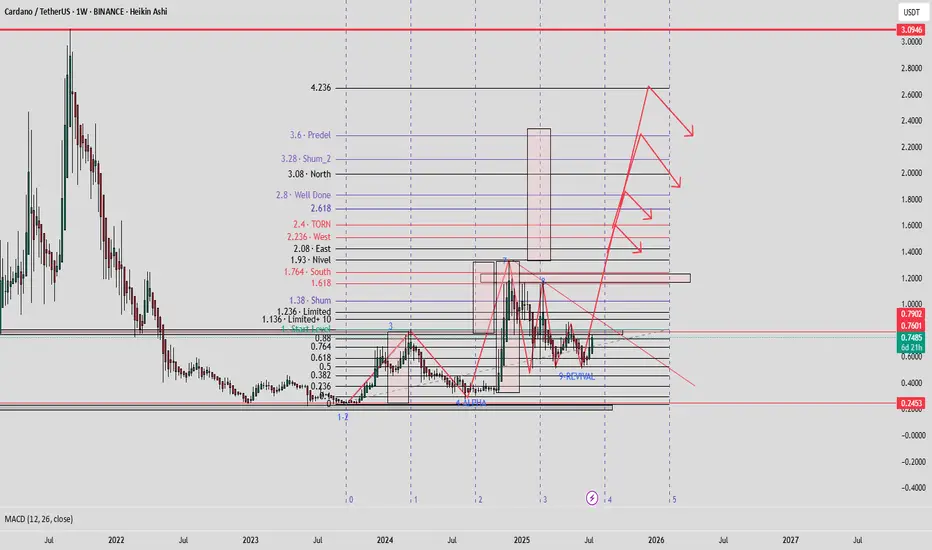
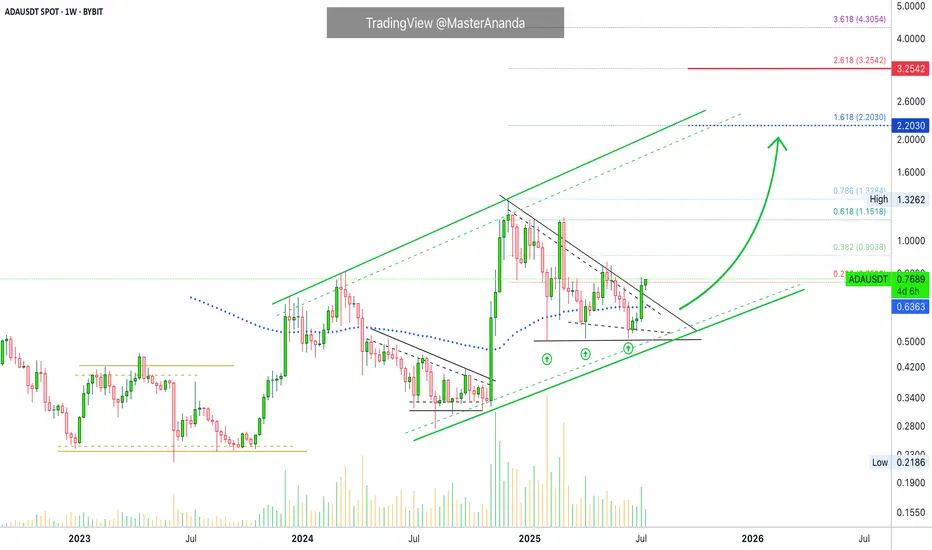
$2.2 Followed by $3.25 · Cardano Trend-Based Fib ExtensionCardano is a on a clear, and very strong, ascending channel rising since June 2023. We are clear, safe and confident about the bigger-broader market trend. An uptrend within a long-term bullish cycle.
After the peak in early December 2024 Cardano struggled to stay above EMA89—the blue dotted line on the chart—but this isn't the case anymore. After a triple-bottom, shy higher lows, last week ADAUSDT managed to break decisively above this level with a full green candle. This confirms the resumption of the late 2024 bullish wave.
Last week resistance was found at 0.236 Fib. extension. The weekly session closed right below it and this is shown as a thin tiny red dotted line on the chart. The current week is halfway through and ADAUSDT is now trading above this level. The bullish signal comes from the fact that the action is happening at the top of the candle; this is the fourth consecutive green week; the bullish bias is fully confirmed.
That is all there is. I just wanted to share a small update in support of our bullish bias based on chart data. You can rest easy knowing that the market will continue to grow.
Next target is $2.20 for 188%. Followed by $3.25 for 325%.
We use leverage on the big projects so the potential for profits can be multiplied by 5, 6, 7, 8, or 10X. The risk is higher of course, but so is the potential for reward. High risk vs a high potential for reward. You can always approach the pair spot if uncertain. If you lack experience but still want to join the ride, enjoy the rise, make money and have fun, you can buy spot, that is, buy and hold. The market will give you money if you are patient enough. This is the period where everything grows. Thanks a lot for your continued support. If you enjoyed the content consider hitting follow.
Namaste.
ADAUSDT: $1.50 Year End Target, Is It Possible? The price has remained steadily bullish, but we haven’t seen a strong bullish impulse in the daily timeframe yet. This suggests that we’ll likely reach the $1.50 price range. Please wait for the price to break out and then enter a trade when it shows confirmation. You can use smaller timeframes while taking any entry. Good luck and trade safely!
Like and comment for more!
Team Setupsfx_
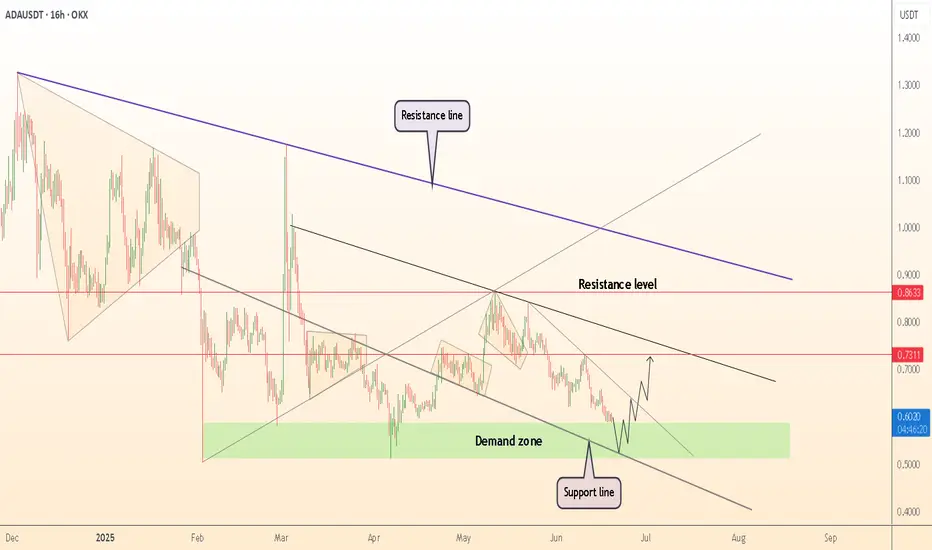
ADA/USDT Trading Ideahi traders
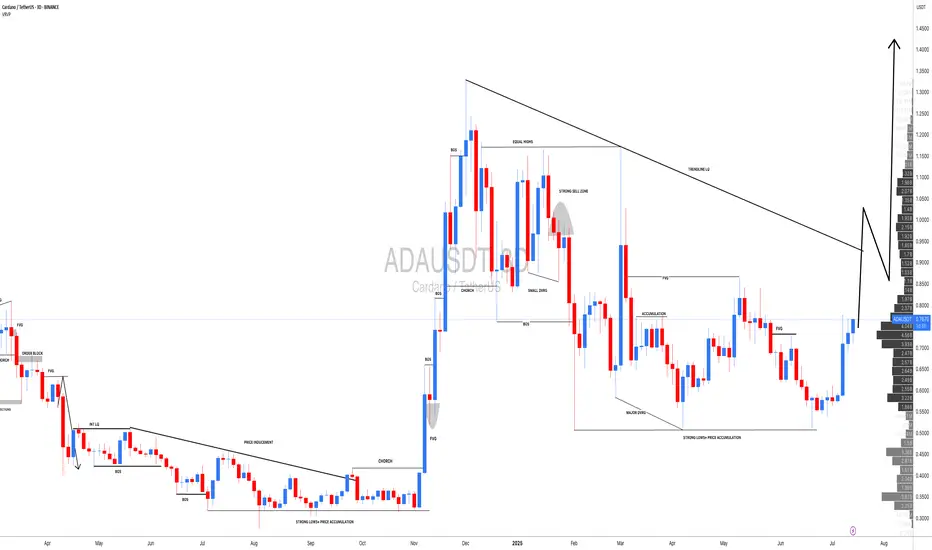
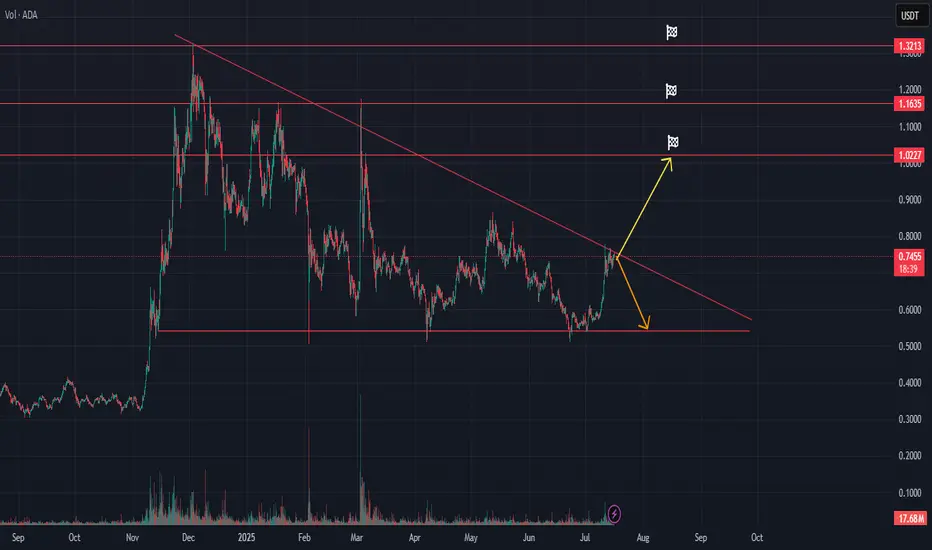
This technical analysis for Cardano (ADA/USDT) outlines a potential breakout or rejection scenario as the price tests a long-term descending trendline.
Key Technical Levels to watch:
Resistance:
$0.7467 (current test of descending trendline)
$1.0227 (primary breakout target)
$1.1635
$1.3213
Support:
~$0.60 (horizontal support zone)
Trendline: The chart features a long-term descending trendline from the February/March 2025 highs. ADA is currently approaching this resistance after a sustained rally from sub-$0.60 levels.
📈 Bullish Scenario:
If ADA breaks above the descending trendline with strong volume:
Expect a continuation move toward $1.0227, the nearest key resistance.
A successful breakout and hold above $1.0227 could open the path toward $1.1635 and eventually $1.3213.
This would signal a potential trend reversal and shift in momentum.
📉 Bearish Scenario:
If ADA gets rejected at the trendline:
Price may fall back toward the $0.60 support zone, where previous consolidation occurred.
This scenario suggests the trendline remains a strong barrier and that ADA may continue ranging or resume a downtrend.
*How to trade it:
Confirm breakout with volume and daily candle close.
Watch for fakeouts or failed breakouts due to market-wide sentiment shifts.
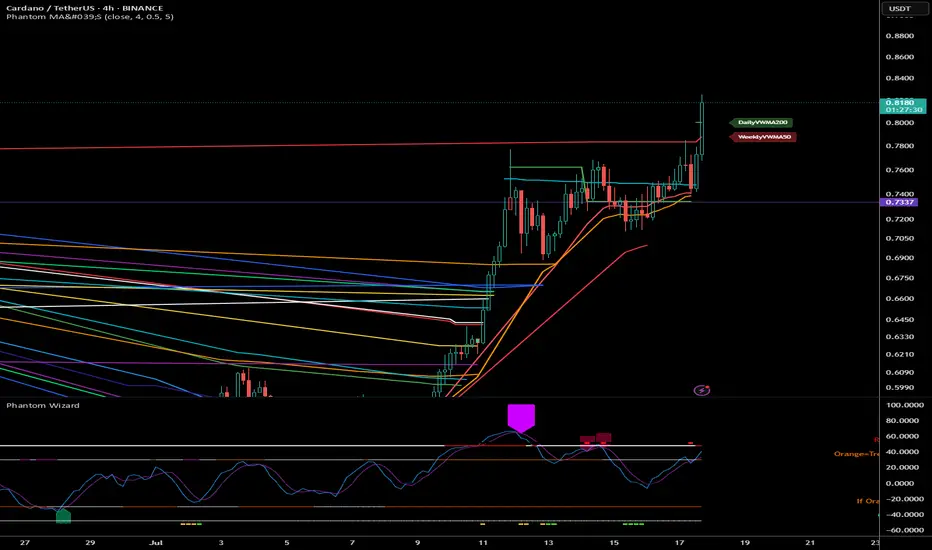
Trading plan for ADALast week, BINANCE:ADAUSDT showed strong upside momentum, breaking the daily timeframe downtrend line and currently holding above $0.7. We're now observing a hidden bullish RSI divergence, suggesting potential continuation toward our third monthly target at $0.82. However, a breakdown below the weekly pivot point could trigger a drop back to the trendline. Full analysis in the video
Trade safe and stay adaptive

ADA / Bulish or Bearish
Hello everyone,
Here’s my analysis of ADA/USDT.
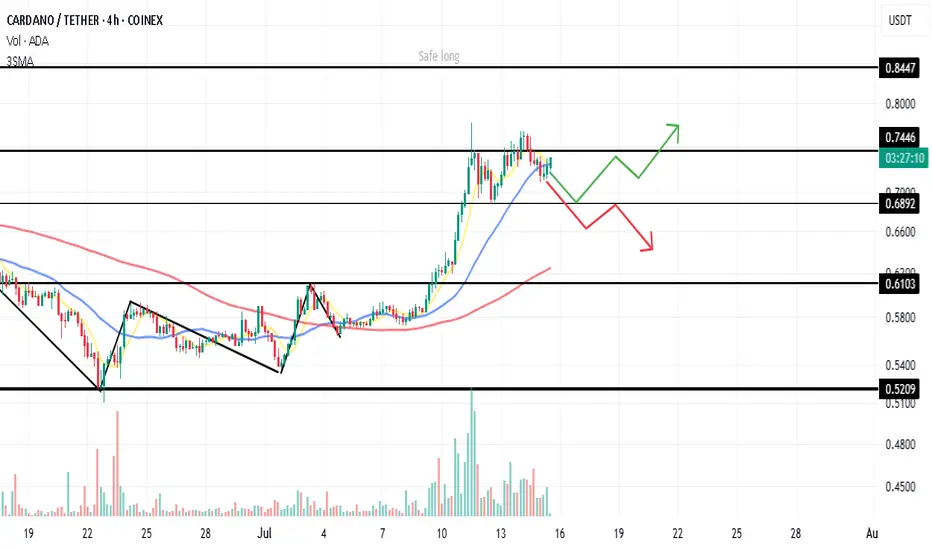
Cardano dropped back below the key level of 0.7446 after a failed breakout. Based on the current market conditions, we can consider three potential scenarios:
1️⃣ Range Scenario:
Price may consolidate between 0.7446 – 0.7041 for up to two weeks.
2️⃣ Bullish Scenario:
A new bullish move depends on a breakout of one of the following levels:
A. Riskier long position: Breakout above 0.7446
B. Safer long position: Breakout above 0.7600
🟡 Note: In scenario B, the stop-loss will naturally be wider.
3️⃣ Bearish Scenario:
A breakdown below 0.6892 could occur — but this does not immediately suggest a short setup.
❗️In that case, we must re-analyze TOTAL, TOTAL2, USDT.D, and BTC.
✅ If the overall market is bearish, a short could be valid.
🟡 Otherwise, it may simply be a deeper correction rather than a trend reversal.
---
🙏 Thanks for reading!
If you found this analysis helpful, hit the 🚀 icon to support the content.
#Cardano #ADAUSDT #CryptoAnalysis #TechnicalAnalysis #Altcoins #TradingStrategy #MarketOutlook #SwingTrade #CryptoTA #BitcoinDominance #TotalMarketCap #USDTdominance #PriceAction
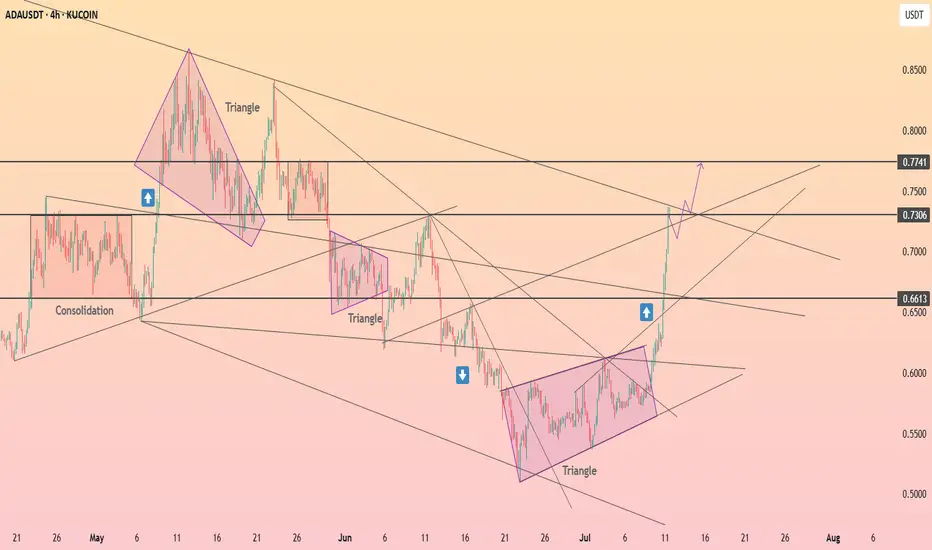
HolderStat┆ADAUSD seeks to $0.774KUCOIN:ADAUSDT recently broke out of a multi-week triangle formation on the 4H chart. The clean break above 0.66 has invalidated the previous downtrend and triggered a new leg higher. With ADA currently riding within an ascending channel, the path toward 0.73–0.75 remains open as momentum continues building.
ADAUSDTWith the price stabilizing above the volume range and the descending channel, and if the market sentiment remains positive, we can expect growth to 1.14 in the first step and then 2.
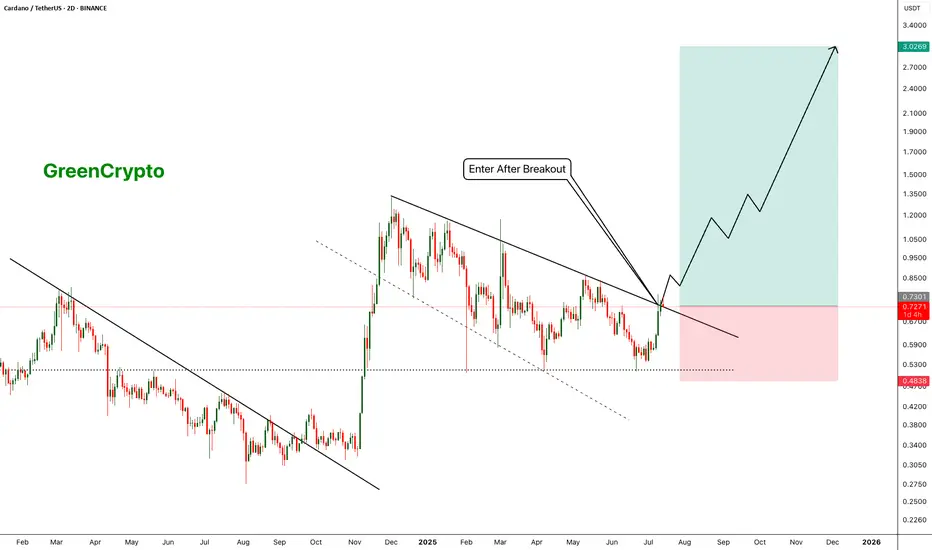
ADA - Beginning of something crazy- ADA is looking forward to the successfully breakout of the trendline resistance.
- A clean breakout from this resistance must to fuel the bullish trend.
- I'm expecting a target of 3$ from this trend.
Entry Price: 0.72
Stop Loss: 0.4838
TP1: 0.8602
TP2: 1.0342
TP3: 1.3379
TP4: 2.0144
TP5: 2.4818
TP6: 3.0329
Stay tuned for more updates
Cheers
GreenCrypto
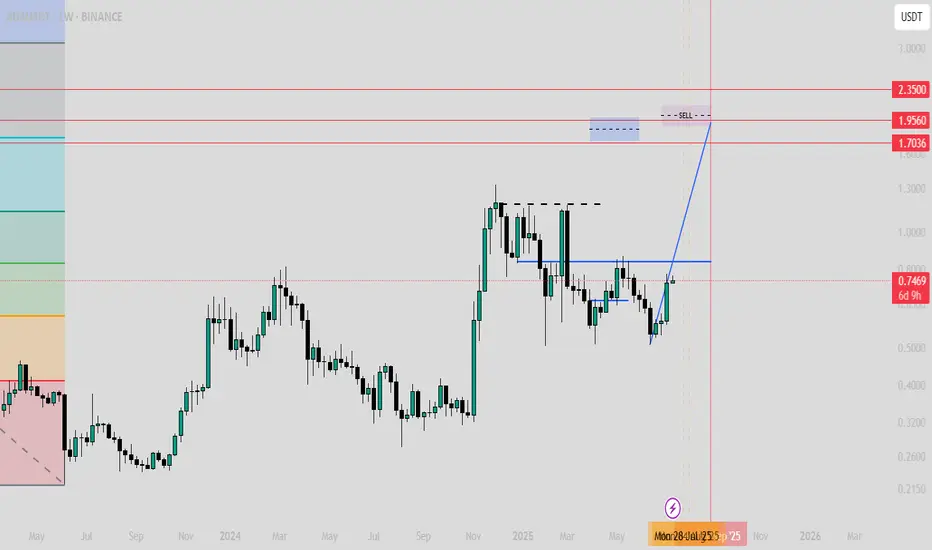
$ADA or Cardano analysis (Target is between 1.8 to 2.1)CRYPTOCAP:ADA or Cardano analysis (Target is between 1.8 to 2.1)
this zone is based on few factors such as historical price behavior and fibbo targets
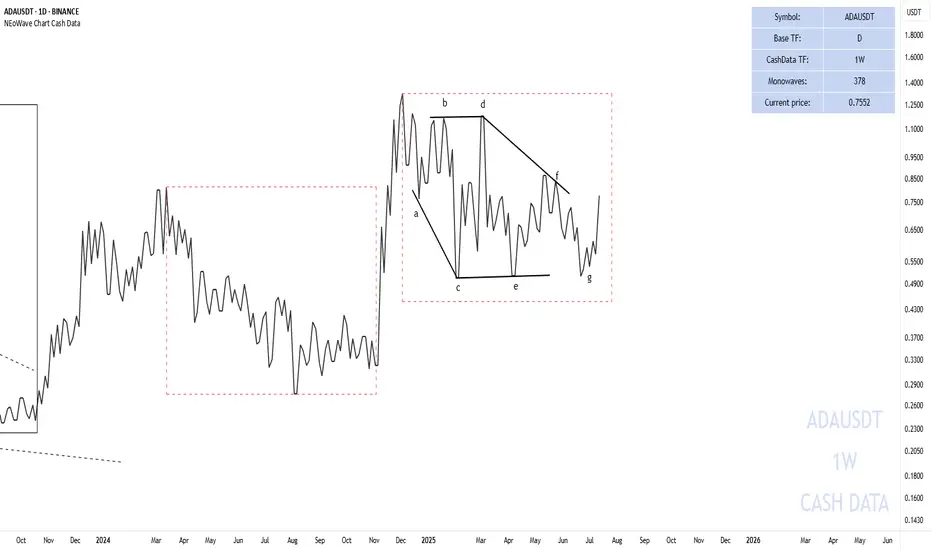
CARDANO WILL BE $2!Our first downside target was touched, but then it failed to reach the second target and the g-wave ended at 0.54.
Based on past price movement, we can expect the price to reach $1.5-$2.
Good luck
NEoWave Chart
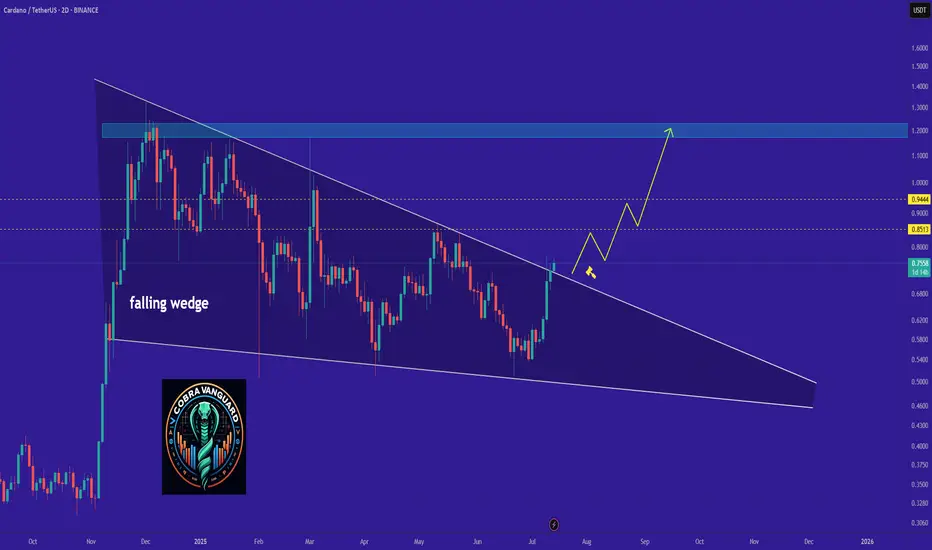
ADA - Time to buy again!The price has broken the wedge pattern, which means it can easily reach its previous high or even go higher.
Best regards CobraVanguard.💚
DeGRAM | ADAUSD above the demand zone📊 Technical Analysis
● ADA is testing the confluence of the long-term support line and the 0.54-0.63 demand zone; every prior touch of this area sparked a 20-30 % rebound.
● A falling wedge within the broader descending channel is close to completion; a 16 h close above the wedge roof (~0.66) activates a measured move to the first horizontal resistance at 0.73 and the channel cap near 0.86.
💡 Fundamental Analysis
● The upcoming Chang hard-fork, which introduces on-chain governance and boosts staking utility, is scheduled for main-net in Q3 2025, lifting on-chain activity and TVL.
✨ Summary
Long 0.58-0.63; wedge breakout >0.66 targets 0.73 ➜ 0.86. Bull bias void on a 16 h close below 0.54.
-------------------
Share your opinion in the comments and support the idea with a like. Thanks for your support
#ADA Almazov Projection#ADAUSD ALMAZOV PROJECTION WEEKLY
Price projection according to Almazov's theory, #ADA should at least touch $1,60 - before pulling back or continuing to go long if its dimensionality decreases (2.3).