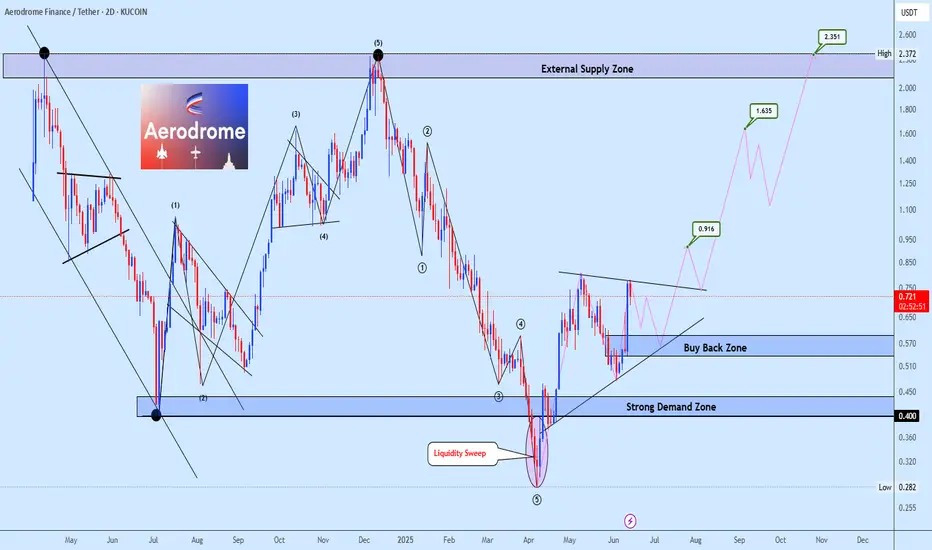
Aerousdt trading opportunityAEROUSDT has completed a 5-wave decline into a Strong Demand Zone around $0.40, followed by a classic liquidity sweep below the swing low, this move suggesting potential exhaustion of the bearish momentum.
The subsequent recovery and structure shift have validated a bullish reversal, as price recl
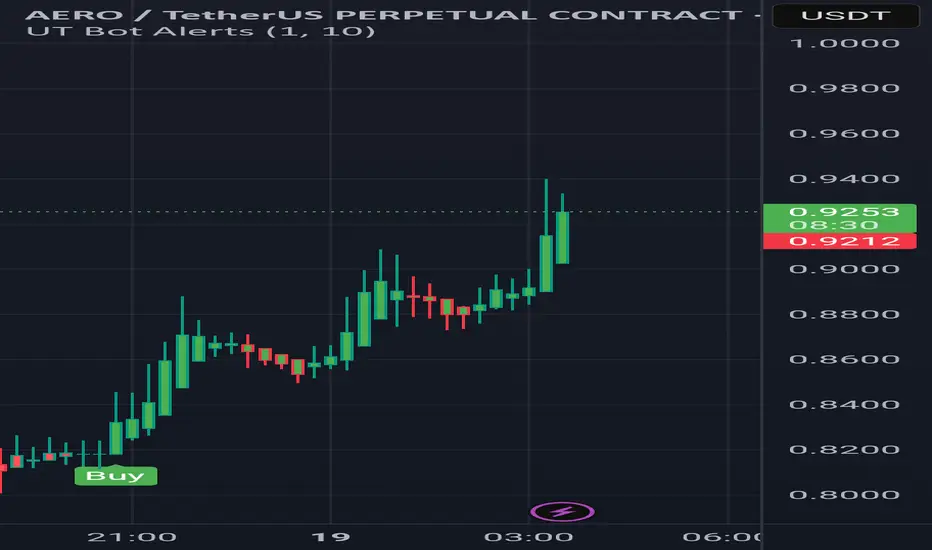
SPKUSDT Long Opportunity | UT Bot Signal + Fib Extension PlaySPKUSDT showing a bullish setup after a UT Bot BUY signal at 0.0530–0.0535 zone.
Confirmation with:
📈 Volume breakout
✅ QQE MOD green spike
💹 EMA crossover
🎯 Targets:
TP1: 0.0560
TP2: 0.0578
TP3: 0.0600 (Fibonacci 1.618 extension)
🛡️ SL: 0.0518 (below swing low)
Risk-to-reward is favorable. A
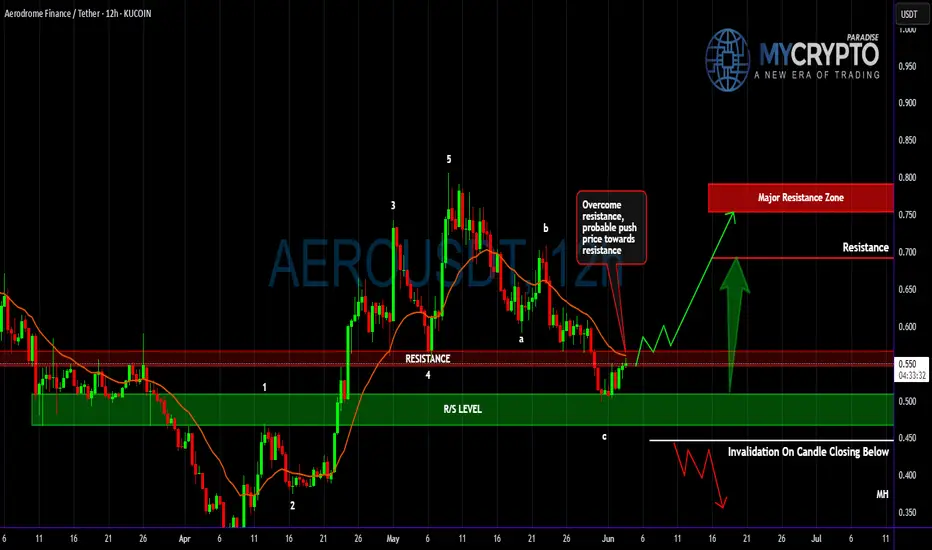
AERODROME About to Defy Gravity? One Final Obstacle!Yello Paradisers — did you catch this developing setup in real-time on #AERO? After calling the completion of the higher-degree Elliott Wave 1 structure followed by an ABC correction, the chart is now flashing a high-probability opportunity — but only if a key resistance gets flipped in the coming s
AERO SELL SETUP , Sold From $0.79AERO SELL SETUP
Currently $0.79
Sold From $0.79
(Trading plan If AERO go up to $0.84
will add more shorts)
Expecting target $0.74 OR DOWN
In the event of an early exit,
this analysis will be updated.
Its not a Financial advice

UPDATE ON AERO SHORTS ,Anything above $0.8450 is a good short DETAIL UPDATE ON AERO SHORTS
Anything above $0.8450 is a good short
Targeting $0.77 or $0.76 Area
Not a Financial advice

Aerodrome Finance: Your Altcoin ChoiceHere is a chart with perfect bottom price dynamics, Aerodrome Finance (AEROUSDT).
There is a falling wedge pattern and this pattern ends with a rounded bottom. The rounded bottom is a classic and strong reversal signal. See how back in 2024 this same pattern led to growth.
Here the rounded bottom

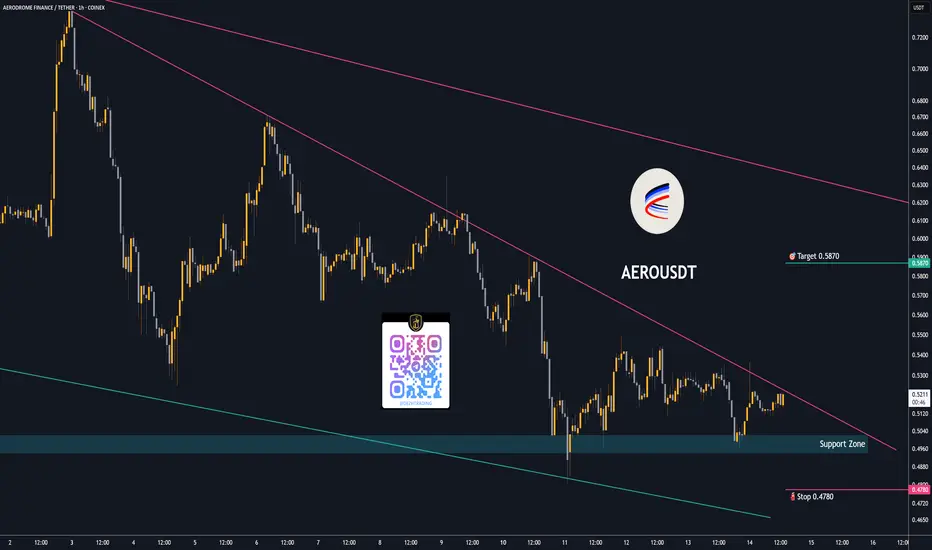
Trading opportunity for AEROUSDTBased on technical factors there is a Buy position in :
📊 AEROUSDT
🔵 Buy Now
🪫Stop loss 0.4780
🔋Target 0.5870
📏 R/R 1,5
💸RISK : 1%
We hope it is profitable for you ❤️
Please support our activity with your likes👍 and comments📝
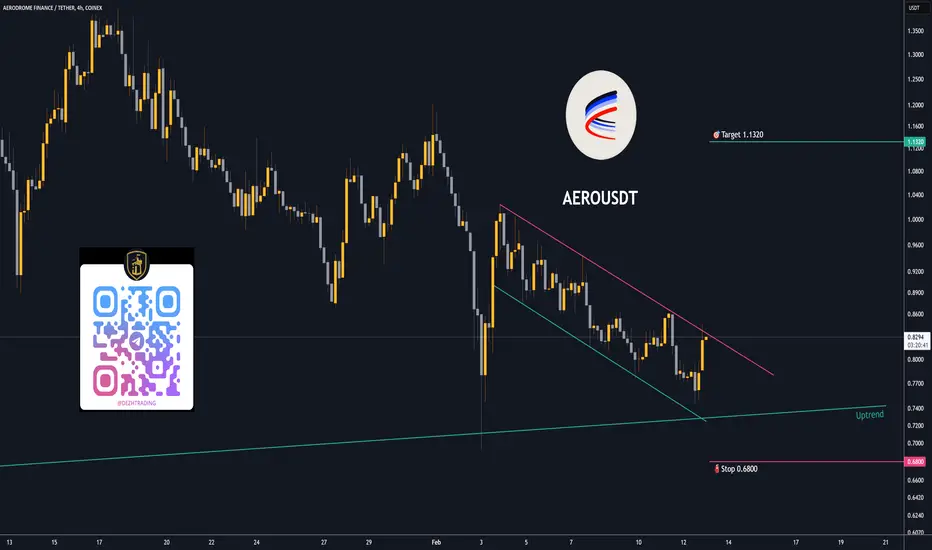
Trading opportunity for AEROUSDTBased on technical factors there is a Buy position in :
📊 AEROUSDT
🔵 Buy Now
🪫Stop loss 0.6800
🔋Target 1.1320
📏 R/R 2
💸RISK : 1%
We hope it is profitable for you ❤️
Please support our activity with your likes👍 and comments📝
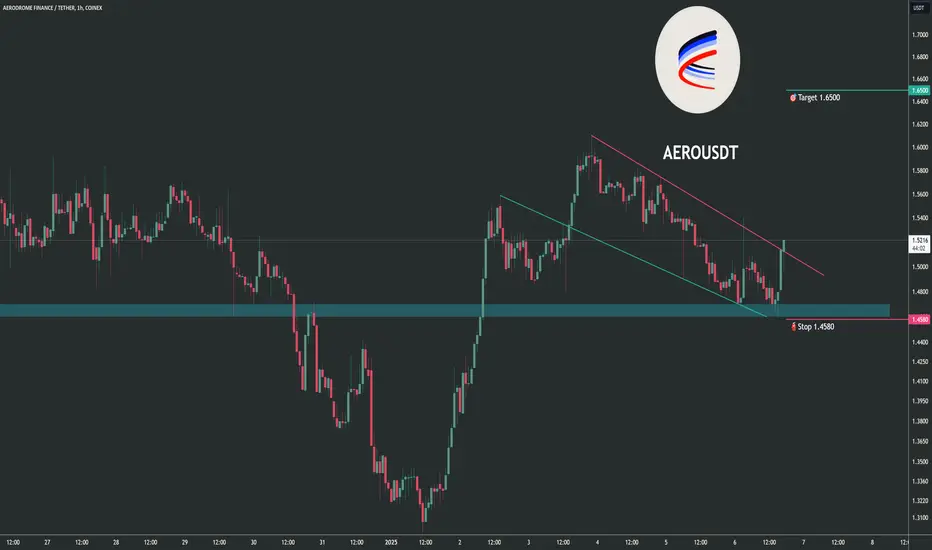
Trading opportunity for AEROUSDTBased on technical factors there is a Buy position in :
📊 AEROUSDT
🔵 Buy Now
🪫Stop loss 1.4580
🔋Target 1.6500
📏 R/R 2
💸RISK : 1%
We hope it is profitable for you ❤️
Please support our activity with your likes👍 and comments📝
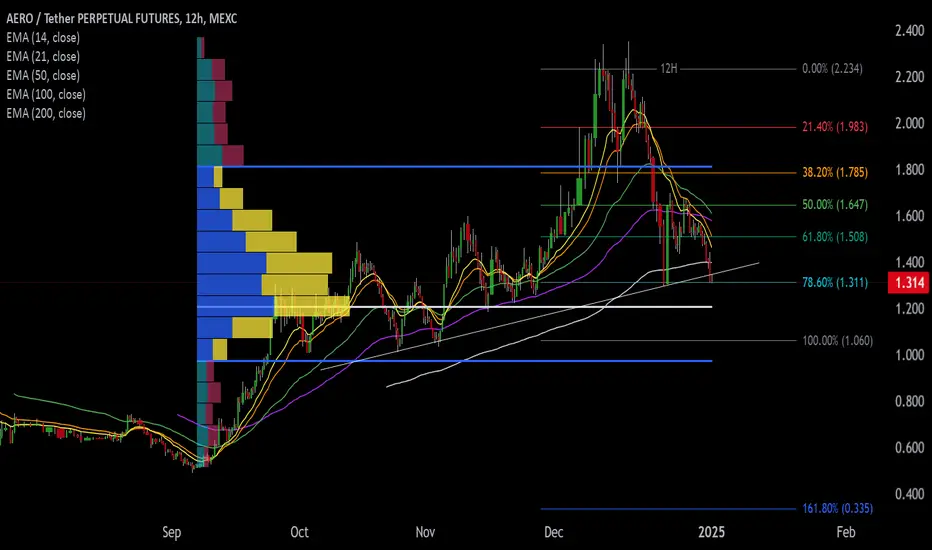
AERO in downward momentumAERO still moving down. sitting strong at support of 1.31$ and at Fib 78.6; has fallen below trend line on 12H. POC is $1.20; put bid in at 1.29 (under fib78.6) and at 1.20 POC and 1.17 if feeling lucky at bottom of FRVP. definitely going back to 2.35 and beyond by months end.
See all ideas
Summarizing what the indicators are suggesting.
Oscillators
Neutral
SellBuy
Strong sellStrong buy
Strong sellSellNeutralBuyStrong buy
Oscillators
Neutral
SellBuy
Strong sellStrong buy
Strong sellSellNeutralBuyStrong buy
Summary
Neutral
SellBuy
Strong sellStrong buy
Strong sellSellNeutralBuyStrong buy
Summary
Neutral
SellBuy
Strong sellStrong buy
Strong sellSellNeutralBuyStrong buy
Summary
Neutral
SellBuy
Strong sellStrong buy
Strong sellSellNeutralBuyStrong buy
Moving Averages
Neutral
SellBuy
Strong sellStrong buy
Strong sellSellNeutralBuyStrong buy
Moving Averages
Neutral
SellBuy
Strong sellStrong buy
Strong sellSellNeutralBuyStrong buy
Displays a symbol's price movements over previous years to identify recurring trends.