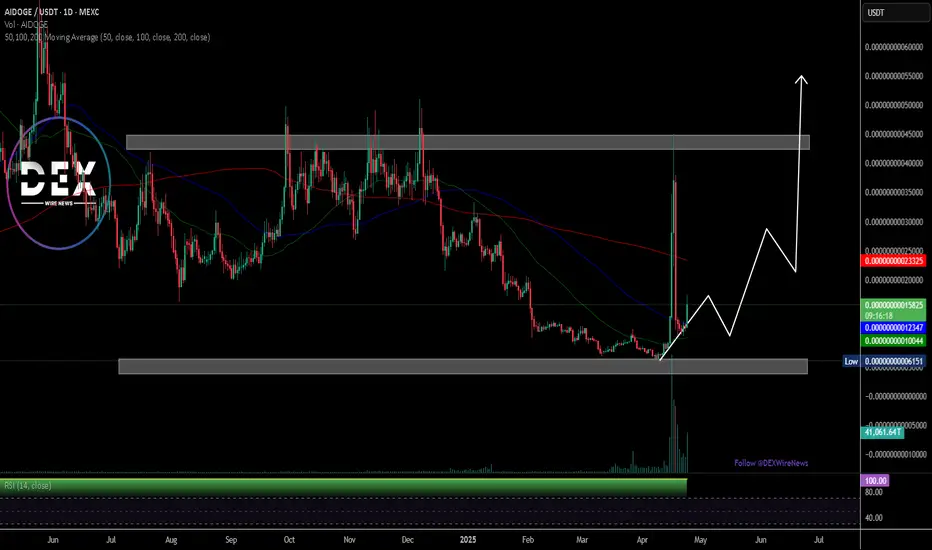
Breaking: $AIDOGE Surge 30% Gearing for 300% Breakout The price of $AIDOGE coin ($AIDOGE) has seen an uptick of 30% for the past 24 hours, setting the coast for 300% surge amid breaking out of a retracement zone.
Built and integrated in the Arbitrium's chain, $AIDOGE came up to be the first dog-theme memecoin built on the fastest layer 2 blockchain.
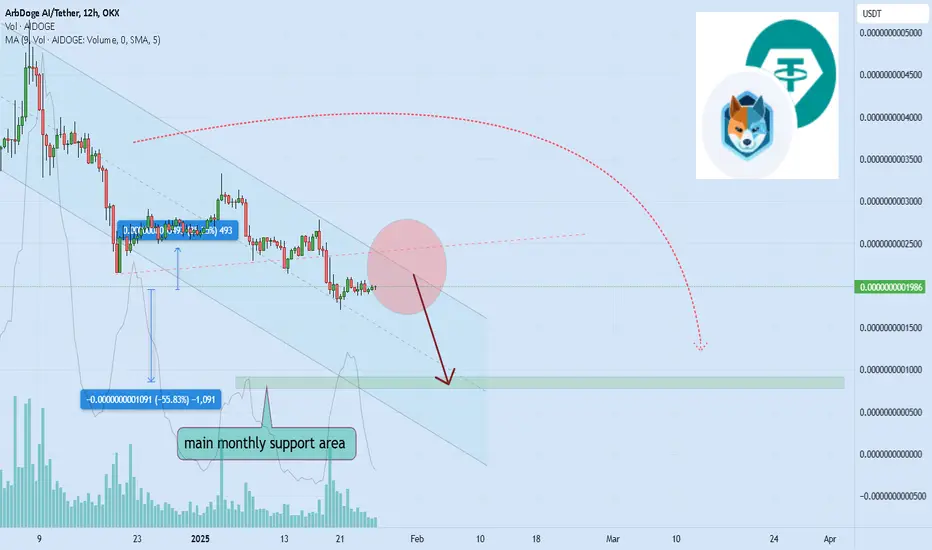
ArbDoge AI correction to the downside Hello and greetings to all the crypto enthusiasts, ✌
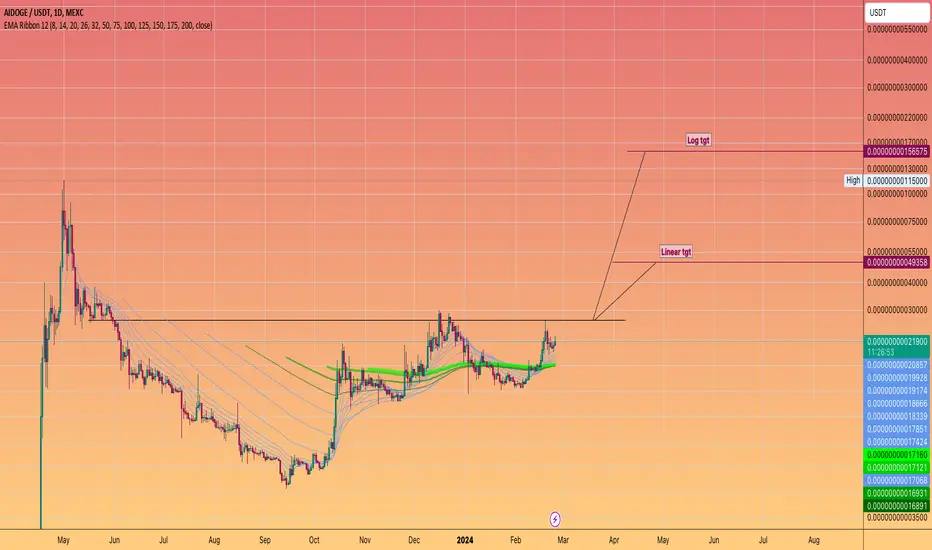
In several of my previous analyses, I have accurately identified and hit all of the gain targets. In this analysis, I aim to provide you with a comprehensive overview of the future price potential for ArbDoge AI , 📚🎇
The price is currently trad
ARAB DOG Ai new volume and high potential for gainHello and greetings to all my valued followers and crypto enthusiasts. In this IDEA, I aim to provide some points and overview of the AIDOGEUSDT’s position. 🙌🐋
A new volume has recently emerged in the market for this stock, which is a positive indicator for an upward trend in the coming days. This
SWING PATTERN FOR AIDOGEUSDT FUTURE im not a pro trader but this is according to my own research. i m open for your feedback guys, actually it helps to me, to be a better trader someday, just DM me guys ok thank you

AIDOGE USDT FUTURE TRADE according to my research so very complicated for now guys. just hold for now.......

AIDOGE/USDT NEW BREAK POSSIBLITYAIDOGE/USDT shows the low time frame possibility for new volume which can affect the price for an uptrend. ( depend all on high chance) There are no guarantees in the markets.
The new increase volume updates always start with interest if there is a confirmation to follow and if there is a building
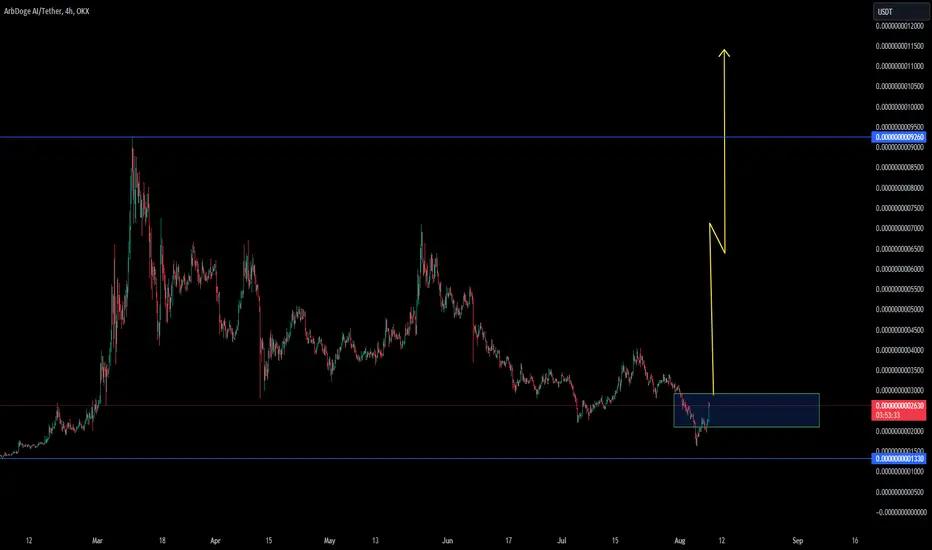
AIDOGE, will be very sensitive to a PARABOLIC move...AIDOGE just broke its daily descending trendline with significant volume -- conveying anticipation of a sudden price growth.
Histogram has created a breakout line -- a 2nd attempt to a breakout scenario, and a warning sign of an incoming UPSIDE price shift if materialized.
Spotted at $0.0000000002

#AIDOGE update after few months had shared the original idea
we had nice rally in to resistant as speculated & now seeing retracement, i have said it before many times all of my ARBDOGE are staked & locked for few more months, i am not selling however i am looking to size up my position on retracement.
will keep updating this

green cyclesThe previous green cycles have had good growth and
It should be seen whether the last green cycle will be a continuation of the previous cycles or not?
watch it
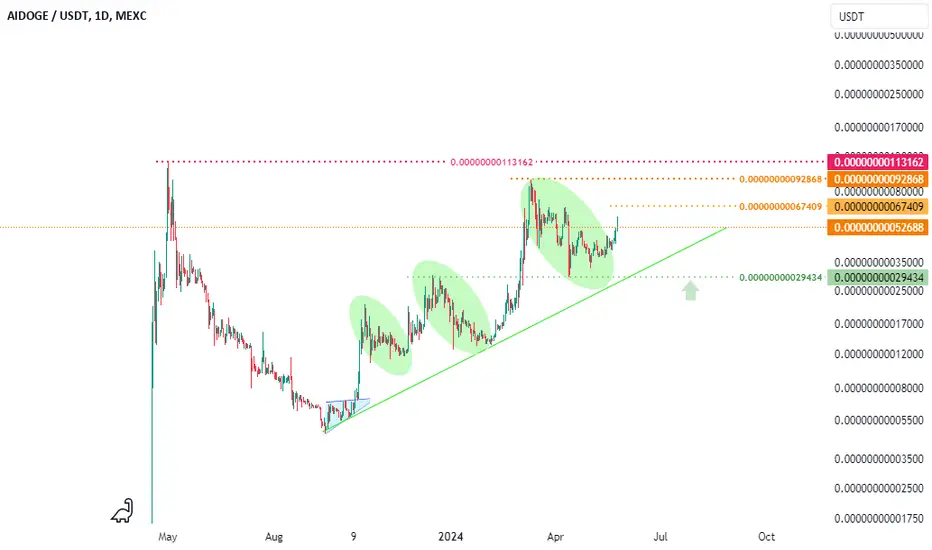
ARBDOGE #AIDOGE has the #1 Memecoin on Arbitrum formed a Cup ...Handle?
With the ETH upgrades scheduled for this spring
It should give arbitrum som bullish momentum
That light shining on the network may bring extra eyes to $AIDOGE
The chart looks constructive , if this thesis plays out.
See all ideas
Summarizing what the indicators are suggesting.
Oscillators
Neutral
SellBuy
Strong sellStrong buy
Strong sellSellNeutralBuyStrong buy
Oscillators
Neutral
SellBuy
Strong sellStrong buy
Strong sellSellNeutralBuyStrong buy
Summary
Neutral
SellBuy
Strong sellStrong buy
Strong sellSellNeutralBuyStrong buy
Summary
Neutral
SellBuy
Strong sellStrong buy
Strong sellSellNeutralBuyStrong buy
Summary
Neutral
SellBuy
Strong sellStrong buy
Strong sellSellNeutralBuyStrong buy
Moving Averages
Neutral
SellBuy
Strong sellStrong buy
Strong sellSellNeutralBuyStrong buy
Moving Averages
Neutral
SellBuy
Strong sellStrong buy
Strong sellSellNeutralBuyStrong buy
Displays a symbol's price movements over previous years to identify recurring trends.