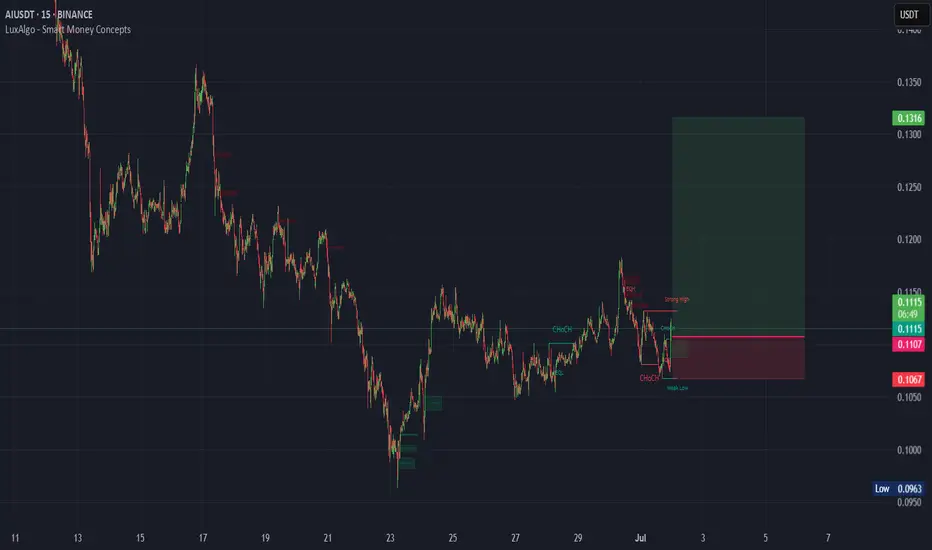
AI (SPOT ) 15min Time frameBINANCE:AIUSDT
#AI/ USDT
Entry same as chart
SL 15MIN close below (Same as chart)
Target same as chart
_______________________________________________________
Golden Advices.
********************
* collect the coin slowly in the entry range.
* Please calculate your losses before the entry.
* D
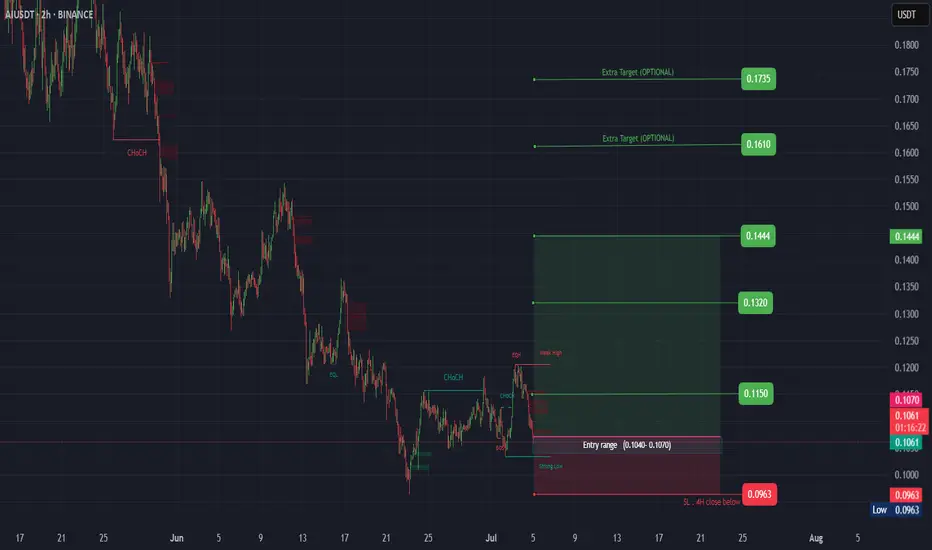
AI ( SPOT )BINANCE:AIUSDT
#AI/ USDT
Entry( 0.1040- 0.1070)
SL 4H close below 0.0963
T1 0.1150
T2 0.1320
T3 0.1444
_______________________________________________________
Golden Advices.
********************
* collect the coin slowly in the entry range.
* Please calculate your losses before the entry.
* Do
Buy### Important and main block order ### can cause a return and reaction to the level. ### In the low time frame, wait for the first ceiling to break and trade when hitting the block!!!! ###buy ###choch
AIUSDT Wave Projection with Bullish SetupAIUSDT has completed a corrective W-X-Y structure near the immediate demand zone, marking a key reversal base. Price is now transitioning into a fresh impulsive wave, with Fibonacci alignment suggesting a bullish extension phase.
Initial impulse is forming cleanly with strong confluence at 0.82 USD

AIUSDT trade opportunityAIUSDT has ended its downtrend with a breakout above the downtrend line, initiating a fresh impulsive wave.
The immediate buyback zone offers a strong re-accumulation opportunity, while the landing zone serves as the next profit target.
For the bullish outlook to remain intact, the internal dema

BUY SCALPING SPOT AIUSDT SIGNAL🚀 BUY SCALPING SPOT AIUSDT SIGNAL
📢 Short-term scalping opportunity for AIUSDT – Quick execution for optimal gains!
📌 Strategy & Trade Plan
✔ Scalping Spot Trade within 1-2 days
✔ Targeting 30-35% profit, exit quickly when the target is reached
✔ Signal expires automatically after 2-3 days if the

AIUSDT 3DAI ~ 3D Analysis
#AI This is the lowest support block for now, buy from here if you still have a Conviction on this Coin with a minimum target of 15%+

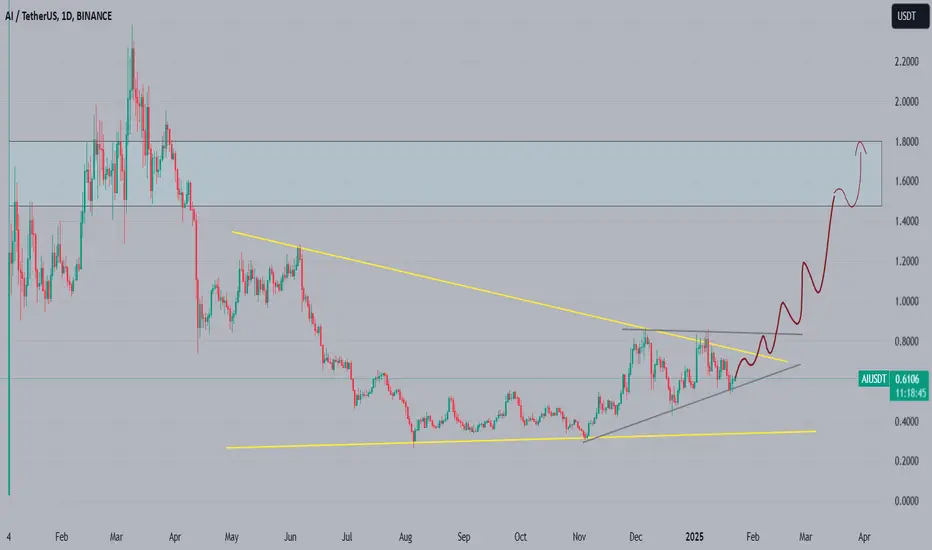
AI TOKEN: MAJOR ACCUMULATION COMPLETE - BREAKOUT IMMINENT $AI/USDT 1D Analysis
🎯 STRONG ACCUMULATION PATTERN
Current Status:
• Price: $0.6059 (-0.08%)
• Volume: 5.45M
• Rising trendline support (gray)
• Major resistance: $0.8-1.0 (descending line)
KEY ZONES:
• Historical ATH: $1.60-1.80
• Accumulation: $0.35-0.45 (completed)
• Current Support: $0.60
F
AI Analysis (1D)It seems the AI is completing an expanding pattern in the form of wave b of B.
The red zone is where wave C of this expanding pattern, which is a diamond-shaped diametric, could potentially end.
The safe zone for rebuying is the green zone, which acts as an ideal order block.
Trigger a position w
See all ideas
Summarizing what the indicators are suggesting.
Oscillators
Neutral
SellBuy
Strong sellStrong buy
Strong sellSellNeutralBuyStrong buy
Oscillators
Neutral
SellBuy
Strong sellStrong buy
Strong sellSellNeutralBuyStrong buy
Summary
Neutral
SellBuy
Strong sellStrong buy
Strong sellSellNeutralBuyStrong buy
Summary
Neutral
SellBuy
Strong sellStrong buy
Strong sellSellNeutralBuyStrong buy
Summary
Neutral
SellBuy
Strong sellStrong buy
Strong sellSellNeutralBuyStrong buy
Moving Averages
Neutral
SellBuy
Strong sellStrong buy
Strong sellSellNeutralBuyStrong buy
Moving Averages
Neutral
SellBuy
Strong sellStrong buy
Strong sellSellNeutralBuyStrong buy
Displays a symbol's price movements over previous years to identify recurring trends.