AIXBT USDT ready to face the highs The overall sentiment appears bearish, with the price respecting the downward trendline and facing resistance from the rejection zone. A break above the rejection zone and trendline would be necessary to signal a potential reversal. Conversely, a breakdown below the order block could lead to furthe

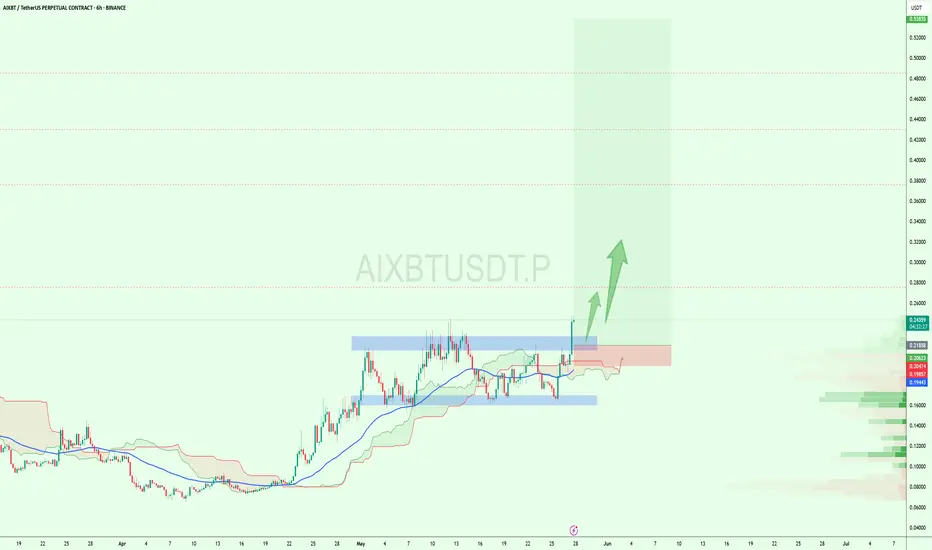
$AXIBT Breakout Confirmed – 2x Potential Ahead?$AXIBT just broke above a key accumulation zone after days of consolidation.🚀
Strong volume, bullish Ichimoku support, and a clean breakout above resistance suggest this could be the start of a major move.
If this rally continues, we could see a sharp push toward the $0.50+ zone, nearly 2x from her
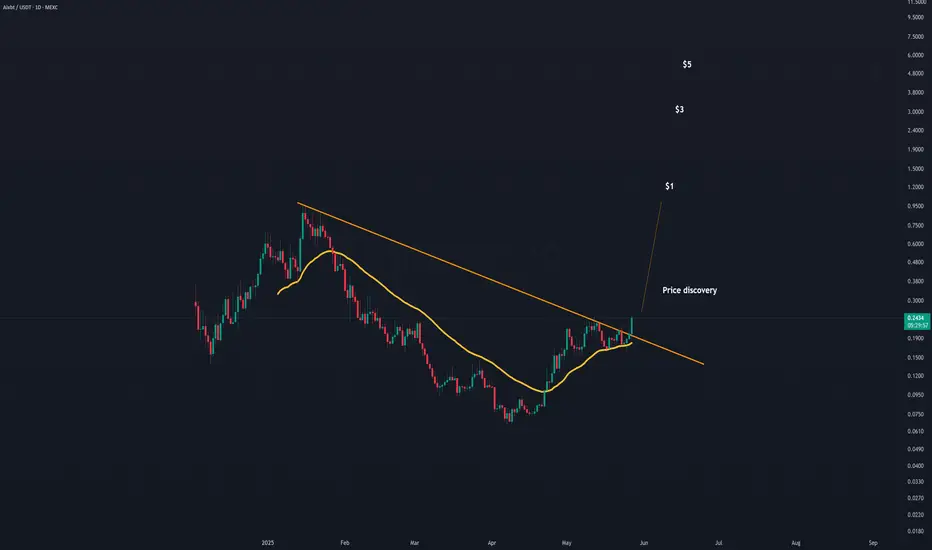
AIXBT Breakout of 5 months trendlineThe big move today was probably due to the breakout from this long trendline. Effectively in 'price discovery' mode and can target $1 and upwards.
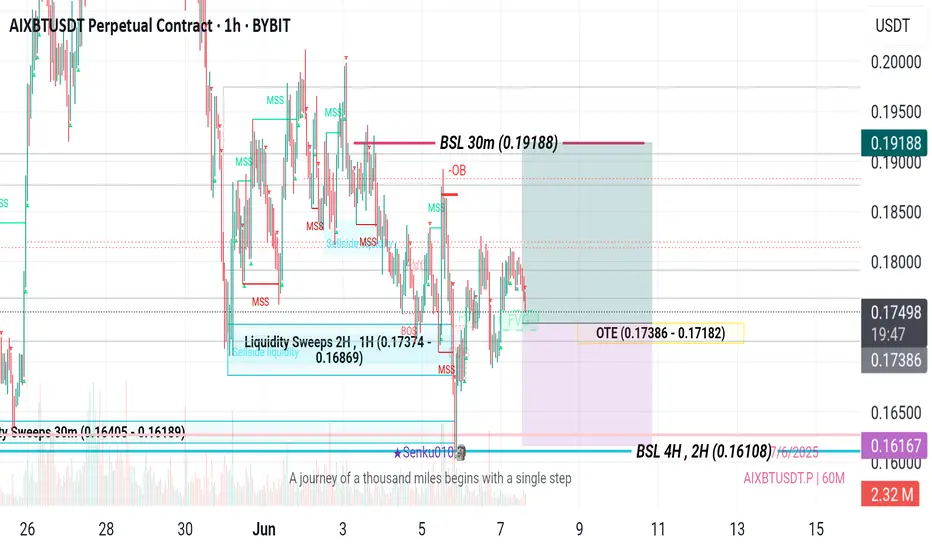
AIXBT PERPETUAL TRADE ,Sold From $0.20AIXBT PERPETUAL TRADE
AIXBT SELL SETUP
Currently $0.20
Sold From $0.20
(Trading plan If AIXBT go up to $0.23
will add more shorts)
Expecting target $0.19200 OR DOWN
Incase of early exist will update this anaylsis
Its not a Financial advice

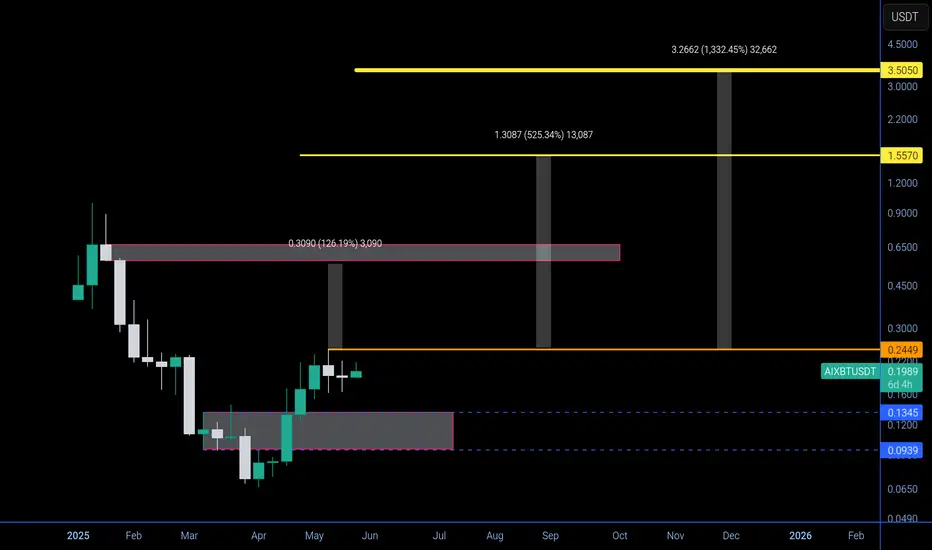
$AIXBT macro analysis [ ai coin having huge potential ] Hi it's me ur Raj_crypt0
Here is my view on BINANCE:AIXBTUSDT an #ai sector coin .DYOR / NFA
This is low cap high risky coin u may lose 100% before investment check ur self
Entry - $0.25 below
targets ....
¹$0.55
²$1.5
³$3.5
Note - $0.1 below stop buying ( I will update
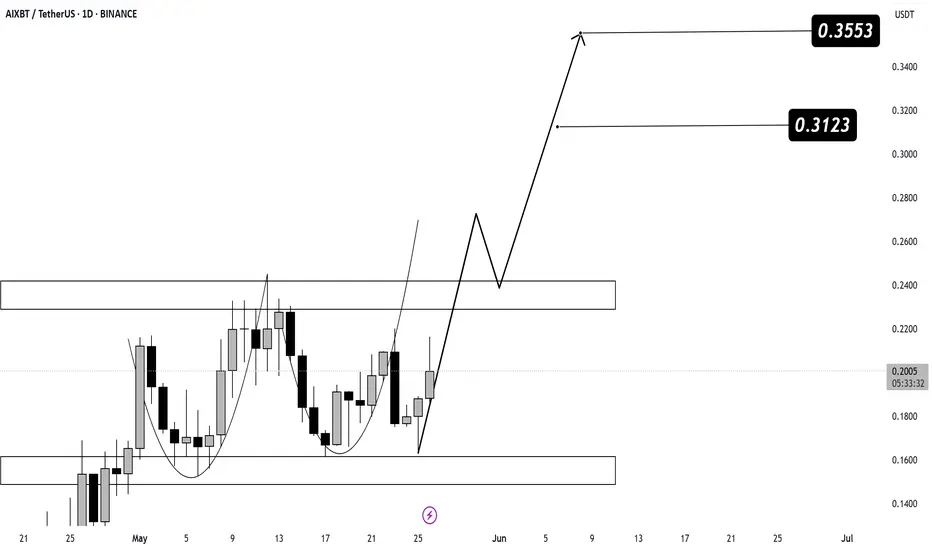
AIXBT Forming Cup Pattern – Breakout Potential Ahead
$AIXBT is shaping a bullish cup pattern and is now approaching key resistance. A breakout and hold above this level could trigger strong upside continuation.
📍 Breakout Zone: ~$0.24–$0.25
📈 Bullish Targets:
🎯 Target 1: $0.3123
🎯 Target 2: $0.3553
Watch for volume confirmation and daily close a
AIXBT should take a coffee break...AIXBT has done super well with the move up. An exchange of hands should be expected, and perhaps a test of lower levels to pick up bullish bits. The divergence in the momentum suggests fresh longs could be risky without a proper structure.
Full TA: Links in the BIO

AIXBTUSDT.P - 1 H Analysis with Our CGI IndicatorAIXBTUSDT.P - 1 H Analysis with Our CGI Indicator
AIXBTUSDT.P Brackout Bearish Double Top Pattern. We are Waiting For OUR CGI Indicator Conformation. Get A Short Position

Alikze »» AIXBT | Formation of the valley pattern - 4H🔍 Technical analysis: Formation of the valley pattern - 4H
📣 BINANCE:AIXBTUSDT currency is moving in an ascending channel on the 4-hour time frame, which is currently in the supply zone and the middle of the ascending channel.
🟢From a classical perspective, a valley has formed that can break t

See all ideas
Summarizing what the indicators are suggesting.
Oscillators
Neutral
SellBuy
Strong sellStrong buy
Strong sellSellNeutralBuyStrong buy
Oscillators
Neutral
SellBuy
Strong sellStrong buy
Strong sellSellNeutralBuyStrong buy
Summary
Neutral
SellBuy
Strong sellStrong buy
Strong sellSellNeutralBuyStrong buy
Summary
Neutral
SellBuy
Strong sellStrong buy
Strong sellSellNeutralBuyStrong buy
Summary
Neutral
SellBuy
Strong sellStrong buy
Strong sellSellNeutralBuyStrong buy
Moving Averages
Neutral
SellBuy
Strong sellStrong buy
Strong sellSellNeutralBuyStrong buy
Moving Averages
Neutral
SellBuy
Strong sellStrong buy
Strong sellSellNeutralBuyStrong buy
Displays a symbol's price movements over previous years to identify recurring trends.