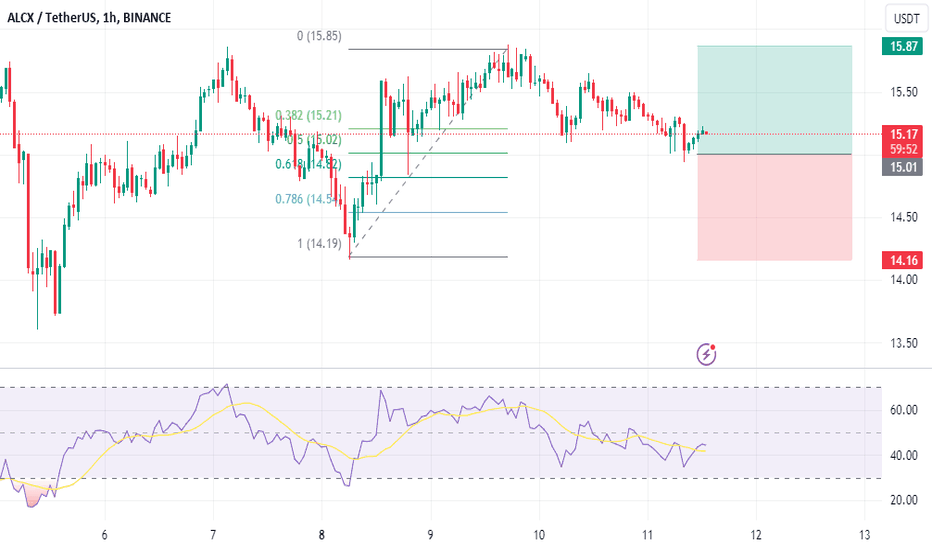
ALCXUSDT 1D#ALCX — Bullish Breakout Loading? 🔥
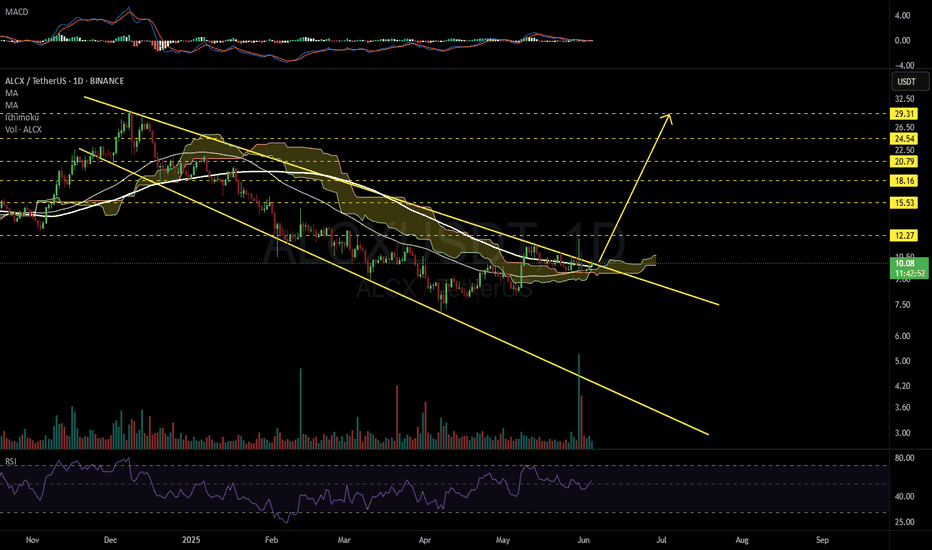
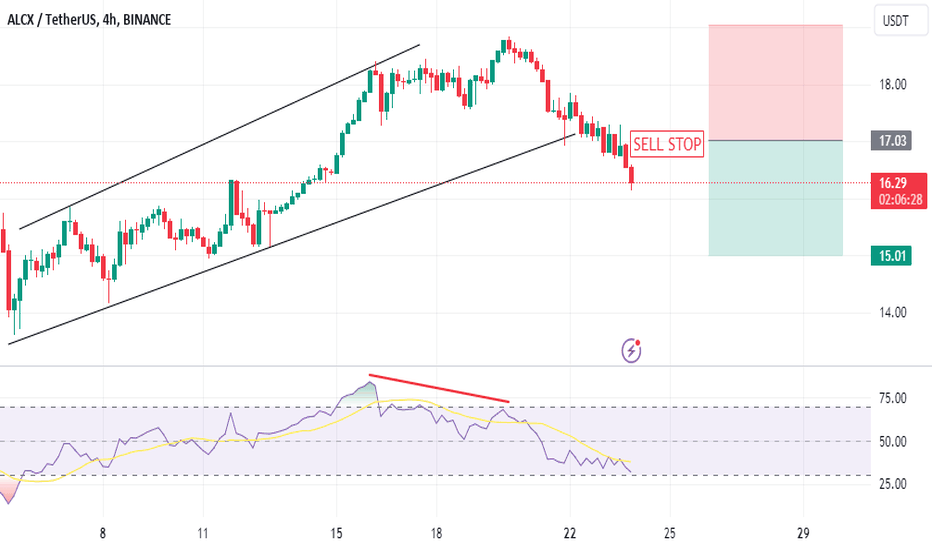
#ALCX is trading inside a Descending Broadening Wedge pattern on the daily chart.
It’s currently resting on a strong support zone, formed by the MA50, MA100, and the Ichimoku Cloud — a confluence of key indicators signaling potential strength.
A bullish breakout
ALCXwe all have experienced shitcoin performance, where unlimited supply of them had significant growth.
what do you think that projects with very low mc and supply will do these days?
personally i have some projects under my radar, where i think that will be very hot ones, and one of them it is ALCX.
ALCX this one cant be explained properly by my logic
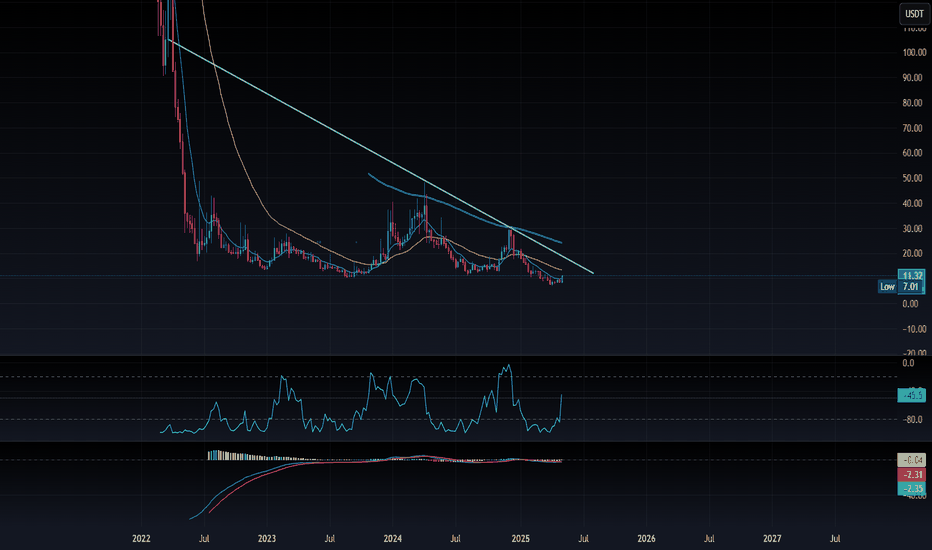
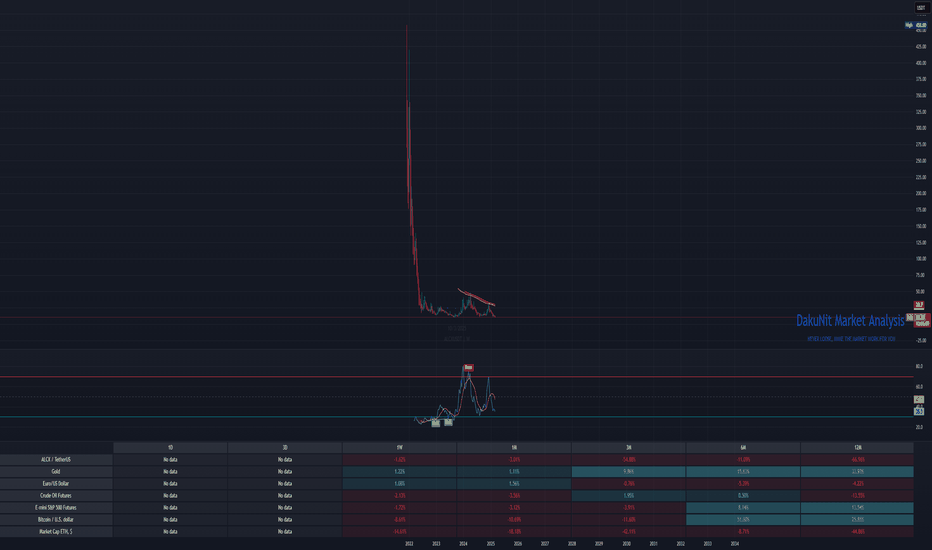
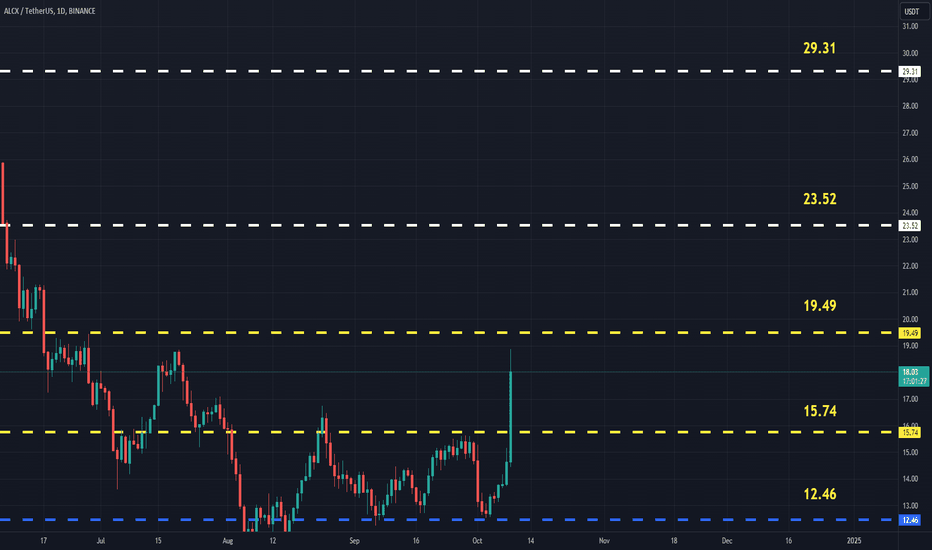
ATH of this project at 2021 had hit 11060$, with a very low token supply around 2.2mil and listed on few very powerful exchanges.
why this actual price and will this price never hit its ATH
keep an eye on it, or maybe just buy and hold 20-30 pieces
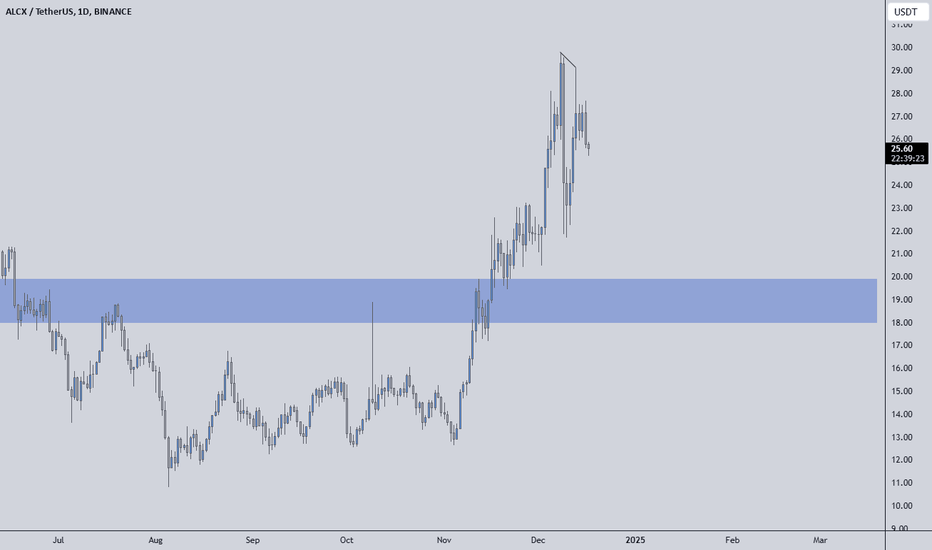
ALCXUSDT %110 Daily Volume Spike! | Huge Opportunity!ALCXUSDT has recorded a 110% increase in volume, signaling renewed market activity. This time, buyers have stepped into the market, which strengthens the potential for upward moves.
📌 Key Focus:
The blue box zone will be the critical level to watch. As the price approaches this region, I will cl
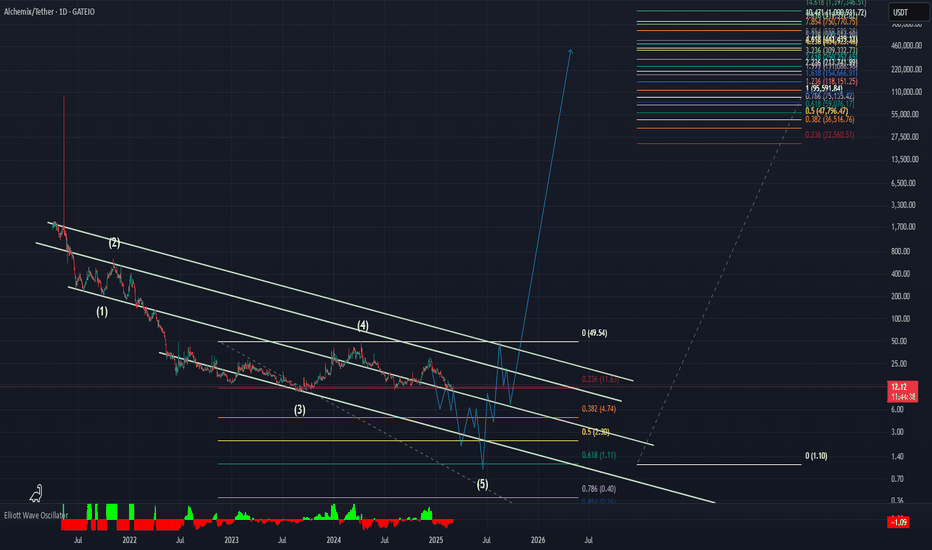
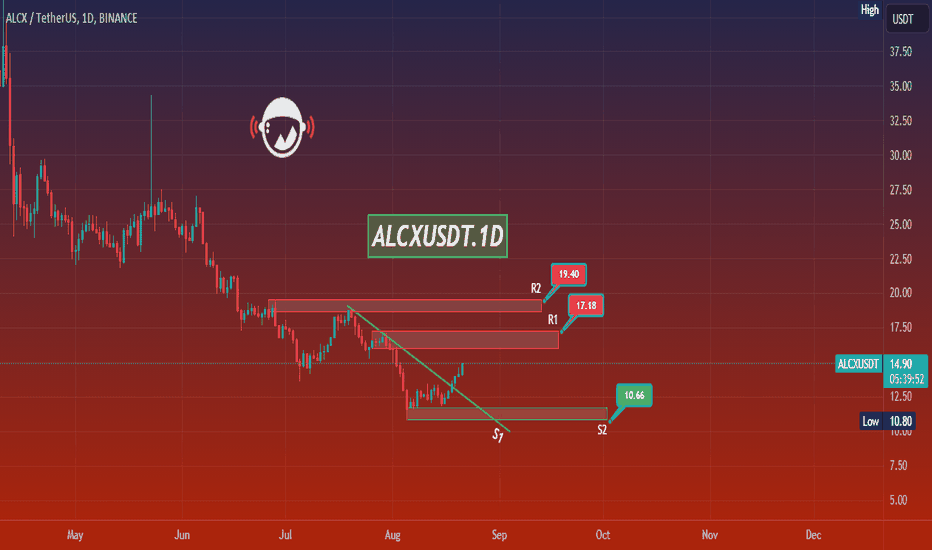
ALCXUSDT.1DAnalyzing the daily chart of ALCX/USDT (Alchemix paired with US Dollar Tether), it is evident that the market has exhibited a significant bearish trend from May into August 2024. Here's a detailed breakdown of the technical analysis:
Trend Analysis
The chart illustrates a descending trend that was
See all ideas
Summarizing what the indicators are suggesting.
Oscillators
Neutral
SellBuy
Strong sellStrong buy
Strong sellSellNeutralBuyStrong buy
Oscillators
Neutral
SellBuy
Strong sellStrong buy
Strong sellSellNeutralBuyStrong buy
Summary
Neutral
SellBuy
Strong sellStrong buy
Strong sellSellNeutralBuyStrong buy
Summary
Neutral
SellBuy
Strong sellStrong buy
Strong sellSellNeutralBuyStrong buy
Summary
Neutral
SellBuy
Strong sellStrong buy
Strong sellSellNeutralBuyStrong buy
Moving Averages
Neutral
SellBuy
Strong sellStrong buy
Strong sellSellNeutralBuyStrong buy
Moving Averages
Neutral
SellBuy
Strong sellStrong buy
Strong sellSellNeutralBuyStrong buy
Displays a symbol's price movements over previous years to identify recurring trends.
