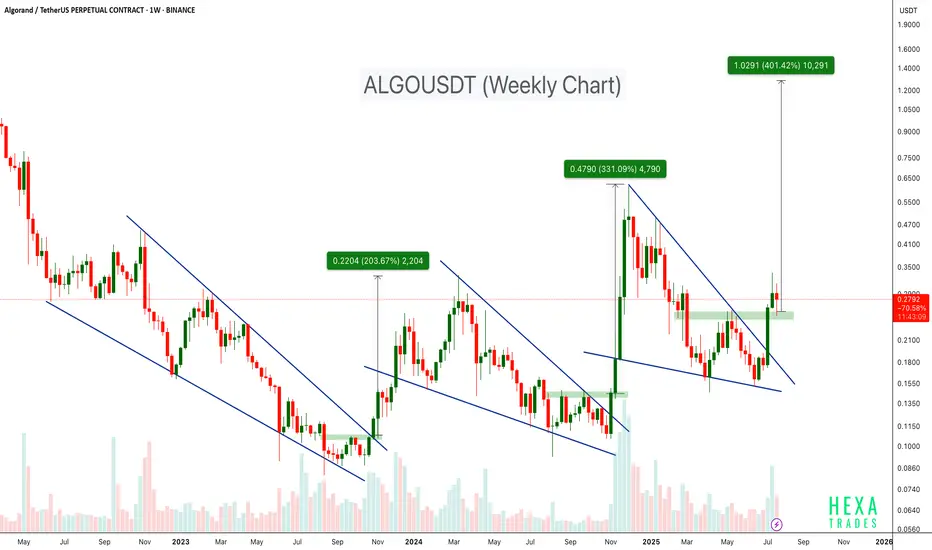
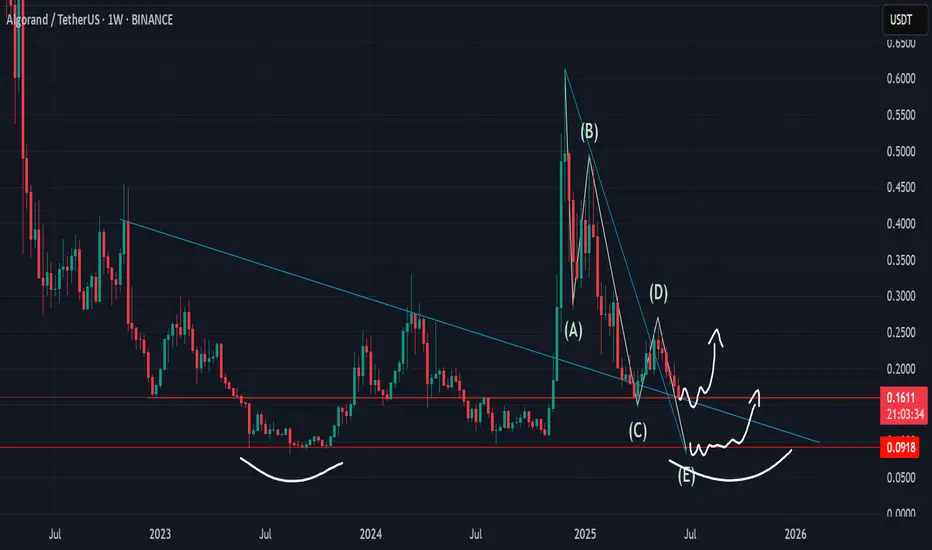
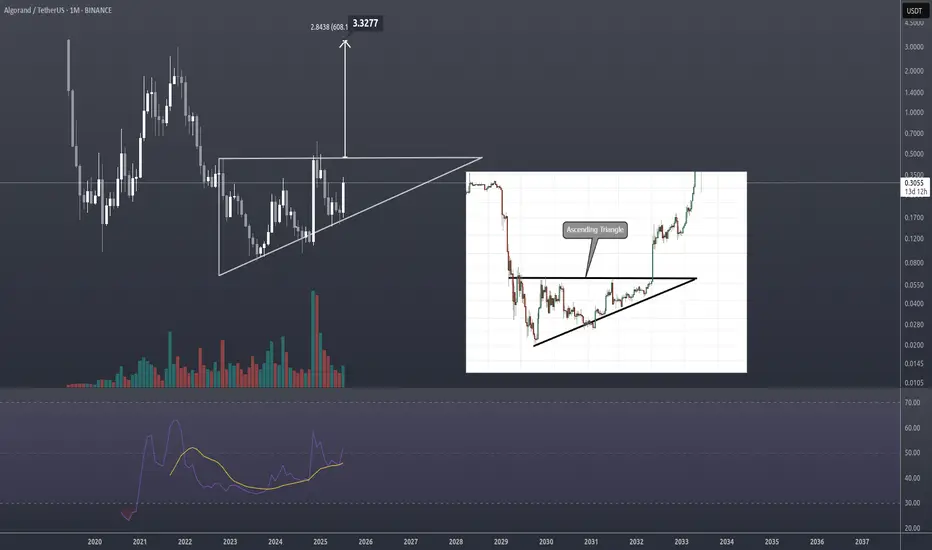
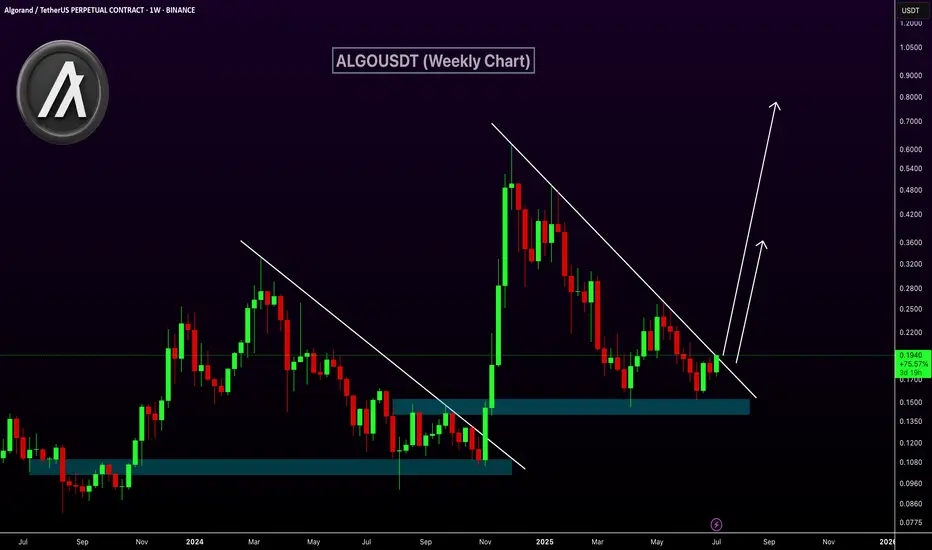
ALGO Breaks Out of Falling Wedge – 400% Target Ahead?BINANCE:ALGOUSDT has consistently followed a bullish pattern on the weekly timeframe. Each major rally has been preceded by a falling wedge breakout, as shown by the three highlighted instances on the chart.
- First breakout: ~200%+ move
- Second breakout: ~300%+ move
- Current breakout projection: Potential target up to +400%
The price has just broken above the wedge and is currently retesting the breakout zone. If history repeats itself, ALGO may be poised for a strong upside move from its current levels.
Cheers
Hexa🧘♀️
COINBASE:ALGOUSD EURONEXT:ALGO
ALGOUSDT trade ideas
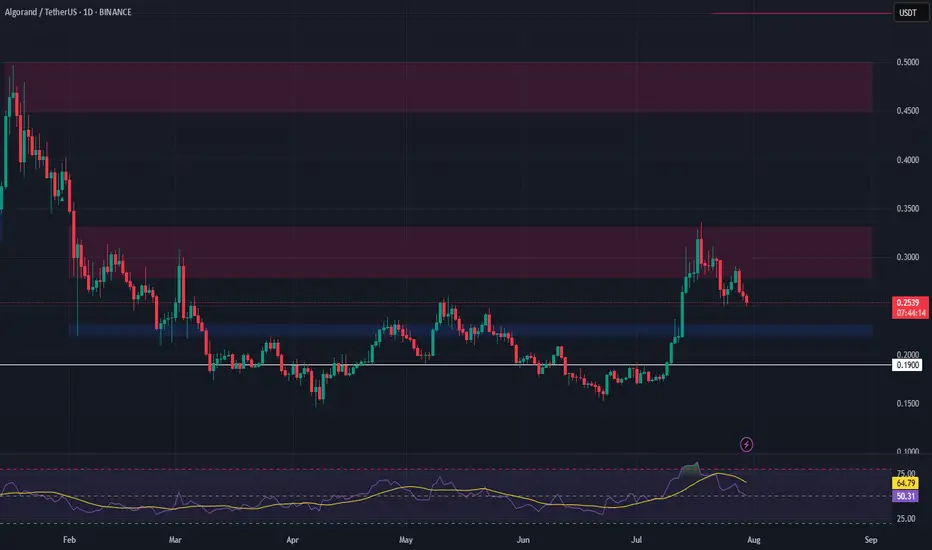
ALGO Swing Trade – Waiting for Pullback to Key SupportAfter a 100%+ surge, ALGO is now retracing and approaching a critical support zone. A dip into this area could offer a strong entry for the next leg higher.
📌 Trade Setup:
• Entry Zone: $0.22 – $0.23
• Take Profit Targets:
o 🥇 $0.28 – $0.33
o 🥈 $0.45 – $0.50
• Stop Loss: Just below $0.19
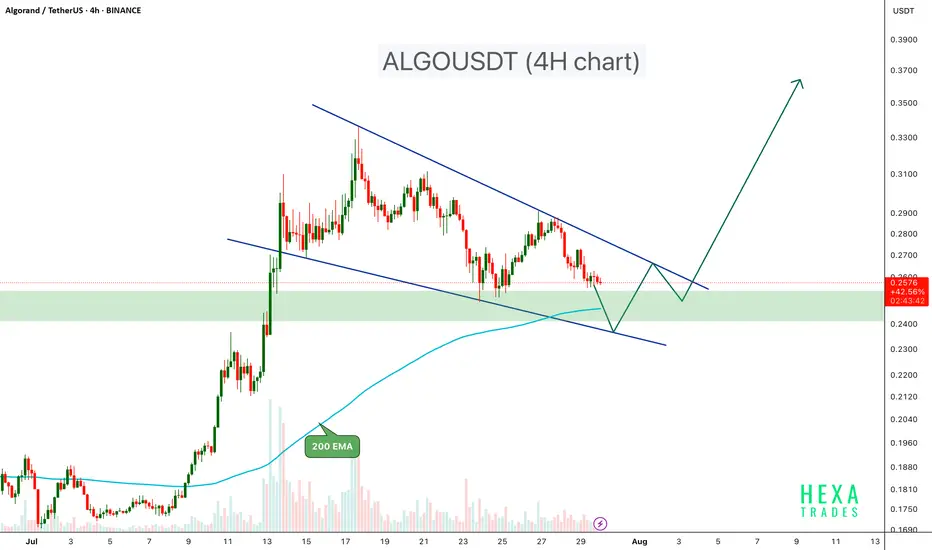
ALGOUSDT Forming Bullish Flag ALGOUSDT is currently trading inside a well-defined bullish Flag pattern on the 4-hour chart, a structure known for its bullish breakout potential. The price recently tested a significant demand zone, which previously acted as a base for a strong upward move earlier in July.
Key Points:
Bullish Flag Structure: Price is compressing within converging trendlines, forming lower highs and lower lows a classic bullish flag pattern.
Support Zone: The $0.24 – $0.255 area has acted as a strong demand zone, providing reliable support.
Bounce Potential: A bullish reaction from the lower flag boundary and demand zone could lead to a move toward the upper trendline and potentially trigger a breakout.
200 EMA Support: The 200 EMA is currently providing dynamic support, reinforcing the bullish setup.
Breakout Confirmation: A breakout above the flag resistance with strong volume could initiate a rally toward the $0.30 – $0.40 zone.
Cheers
Hexa
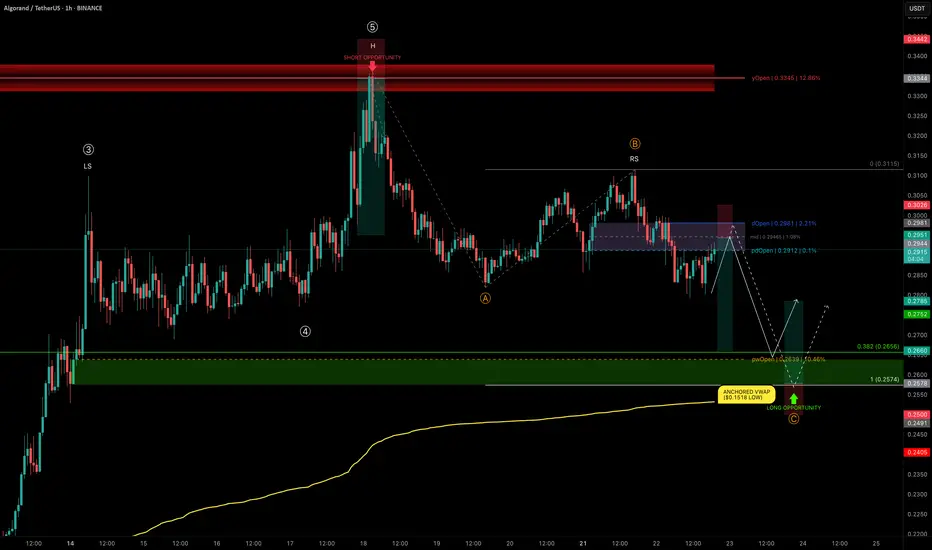
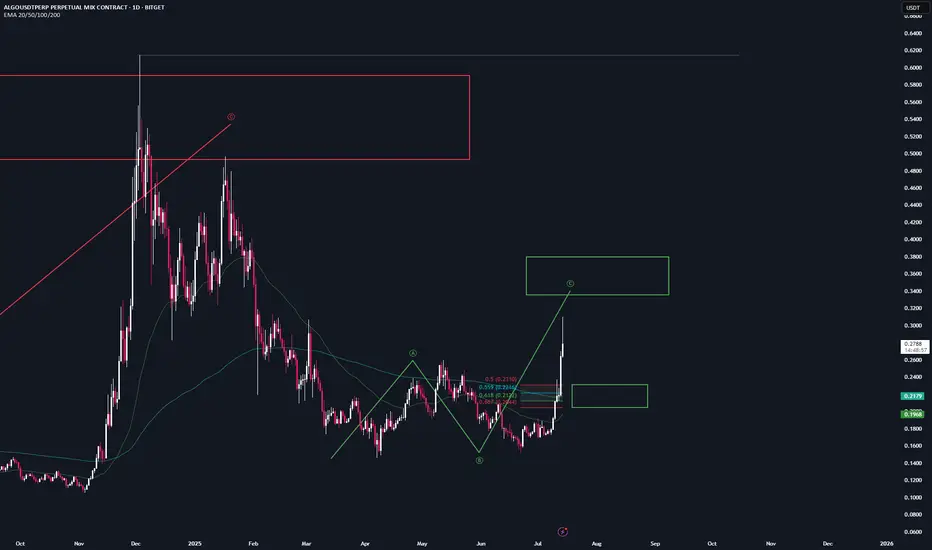
ALGO rejects at yOpen — Mapping High-Conviction Trade ZonesALGO has delivered an impressive +124% rally from $0.1518 to $0.336 in just 25 days, completing a 5-wave Elliott impulse right into the yearly open resistance.
We are now in a correction phase, and the current structure is showing a head and shoulders pattern, with the right shoulder currently forming.
Let’s break down the key levels and setups.
🧩 Technical Breakdown
➡️ ABC Corrective Structure:
Targeting wave C near the trend-based fib extension (TBFE) at $0.2574
➡️ Fib Retracement Confluence:
0.382 retracement of the entire 5-wave move → $0.2656
Previous weekly open (pwOpen) → $0.2639
Liquidity pocket likely to be swept
Anchored VWAP from the $0.1518 low (start of the bullish trend) → currently at $0.2532, acting as a major support layer
Conclusion: Long opportunity zone between $0.2656–$0.2574
Trade Setups
🔴 Short Setup:
Why? ALGO has lost dOpen and pdOpen — a bearish sign for downward continuation.
Entry Zone: Between dOpen and pdOpen
Stop-loss: Above dOpen
Target (TP): 0.382 fib retracement (~$0.2656)
R:R: ≈ 1:3.5
🟢 Long Setup:
Entry Zone: Laddered Entries between $0.2656–$0.2574
Stop-loss: Below anchored VWAP (~$0.2532)
Target (TP): ~$0.2785+
R:R: ≈ 1:2.65
🛠 Indicator Note
I’m using my own indicator called "DriftLine - Pivot Open Zones " for this analysis, which I recently published.
✅ Feel free to use it in your own analysis!
Just head over to my profile → “Scripts” tab → apply it directly to your charts.
💡 Educational Insight: Why Confluence Matters
High-probability trades aren’t based on just one tool or level — they come from confluence, where multiple signals align: fib levels, VWAP, liquidity pools, price structures , and key levels.
For example, in this ALGO setup, it’s not just the fib retracement or just the VWAP — it’s the stacking of all these elements together that creates a precise zone with a better statistical edge.
✍️ Lesson: Don’t chase trades off single signals; stack tools for confirmation.
Patience, confirmation, and confluence — as always, the keys to high-probability setups. 🚀
_________________________________
💬 If you found this helpful, drop a like and comment!
Want breakdowns of other charts? Leave your requests below.
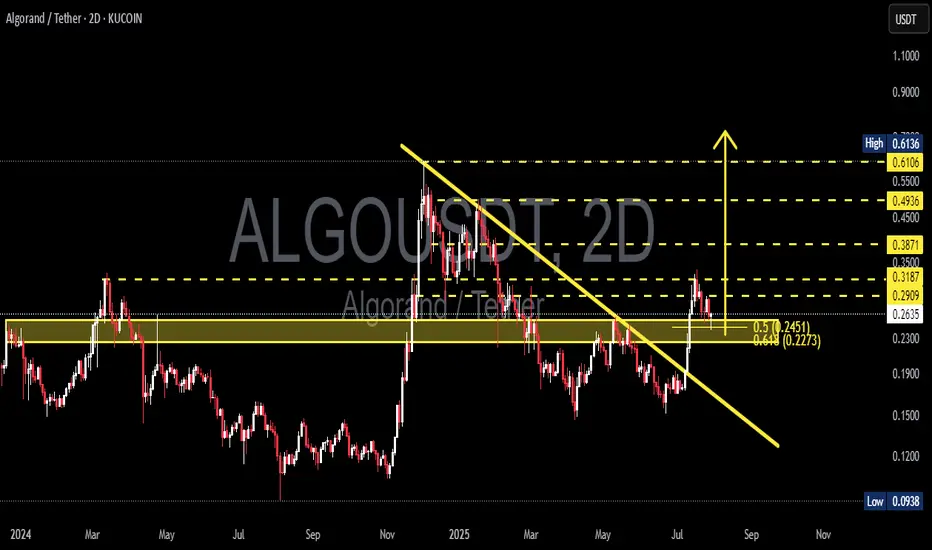
ALGOUSDT Break Downtrend – Reversal in Progress or Just a Retest📊 Technical Analysis Overview:
The Algorand (ALGO) / Tether (USDT) pair has shown a notable technical development by successfully breaking above a medium-term descending trendline that has acted as resistance since early 2025.
---
🔍 Pattern & Structure:
A clean breakout above the descending trendline (yellow sloped line) indicates a potential shift in trend from bearish to bullish.
Price is currently undergoing a retest of the breakout zone, aligning with the Fibonacci retracement levels 0.5 ($0.2451) and 0.618 ($0.2273).
The yellow horizontal zone ($0.25–$0.29) has been a significant support/resistance flip zone, showing strong historical reaction throughout 2024 and early 2025.
A higher high and higher low structure is starting to form — an early signal of a potential bullish reversal.
---
📈 Bullish Scenario:
If the price holds the support zone between $0.2451 and $0.2273, we could see a continuation of the upward move toward the following resistance levels:
$0.2909 (current minor resistance)
$0.3187
$0.3500
$0.3871
Mid-term targets: $0.4936 and $0.6106
A daily or 2D candle close above $0.3187 with strong volume would confirm a bullish continuation.
---
📉 Bearish Scenario:
On the other hand, failure to hold above the $0.2451–$0.2273 support zone could lead to a renewed bearish move with potential targets at:
$0.1900 (weekly historical support)
$0.1500
Extreme support: $0.0938 (2024 cycle low)
A break below $0.2273 would invalidate the breakout and may signal a bull trap.
---
📌 Summary:
ALGO is at a key inflection point. The current pullback could be a healthy correction after a breakout or a failed retest. Watch for price action and volume reaction near $0.2451–$0.2273 to confirm the next move.
#ALGO #Algorand #ALGOUSDT #CryptoAnalysis #TechnicalAnalysis #Breakout #BullishReversal #Fibonacci #SupportResistance #Altcoins #CryptoSetup #PriceAction
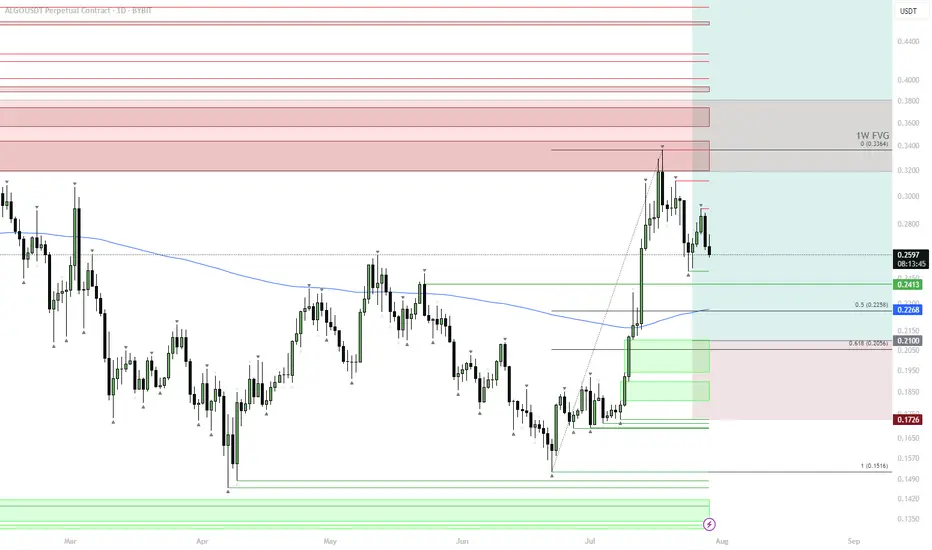
ALGO | #1D — Building the Spot Position LowerALGO has completed its first local move and is now retracing toward key support levels. The price remains under the 200DMA and is heading into the first cluster of demand zones.
Step-by-Step Price Scenario:
Initial Support: Watch the 0.2413–0.2268 zone — this is the first area to scale in spot buys.
Main Accumulation: If price drops deeper, the main spot buy window is $0.22–0.20 (0.5–0.618 retracement of the recent rally and the main demand block).
Invalidation: Breakdown below $0.1726 would invalidate the spot strategy and suggest deeper downside.
Bullish Confirmation: A strong reaction from either of these support levels, followed by reclaiming the 200DMA, would set up the next move toward $0.33–$0.35.
Why this plan:
Buying spot on pullbacks into HTF demand with clear invalidation below keeps risk defined, and the current market structure allows for compounding if the trend resumes.
ALGO – Finally Getting the Retrace
Back at EURONEXT:ALGO —missed the lows, but finally seeing the retrace I’ve been waiting for.
Should’ve entered alongside CRYPTOCAP:HBAR , but this is the next best spot.
If this level doesn’t hold, we’re likely heading back below 20c, and many alts could retrace their entire impulse moves.
Starting to bid here—let’s see if it holds. BINANCE:ALGOUSDT
ALGO Fighting in Support ZoneALGO sitting in support zone its not strong support zone with many price rejection in this price range from December 2022
But if this line break maybe we can heading to the greatest and strongest support zone around 0.09 like in June 2023 and ABCDE pattern completed then consolidate a while before next jumping
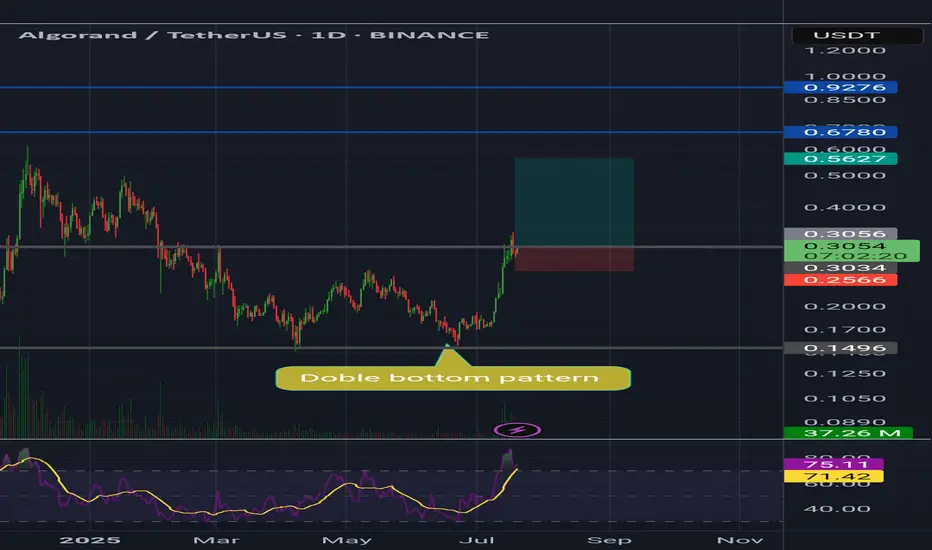
Algorand Algo usdt Daily analysis
Time frame daily
Risk rewards ratio >5.2 👈👌
Target =0.56 $
Double bottom pattern is created and algo pumped to the first target on 0.305
Daily candle closed over the target and 3 days was there for save energy of pump.
I guess next target is 0.6 $ and we have no resistance in the way .
Have a wonderful benefit my 🧡 friends
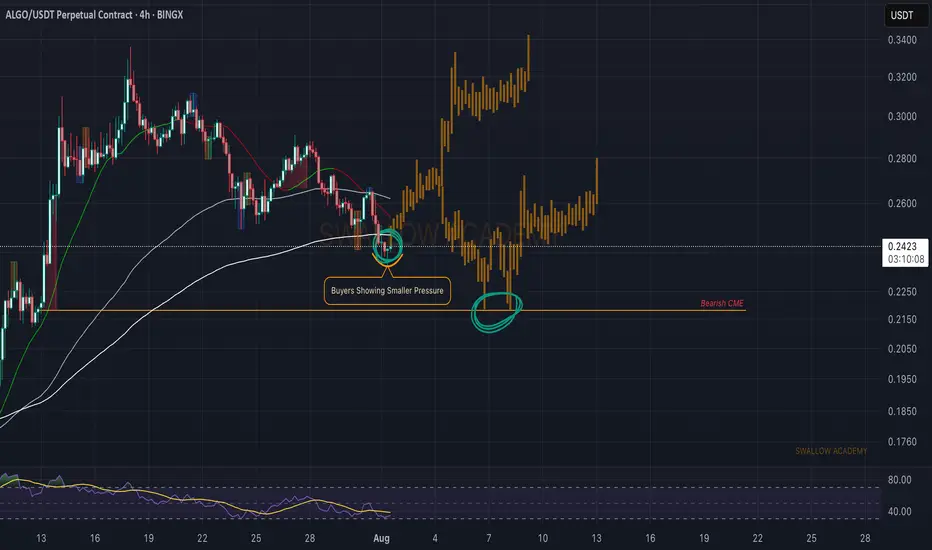
Algorand (ALGO): Seeing Signs of RecoveryAlgorand has made a market structure break (MSB) on smaller timeframes, which is indicating a potential trend switch here.
Now in the current timeframe we are looking for a break of that 200 EMA, as once we see the buyers take full control over it, we will look for buyside movement so eyes on it!
If for any reason we see further movement to lower zones, and we break local low on small timeframes, we are going to aim for that bearish CME, but for now, we are bullish.
Swallow Academy
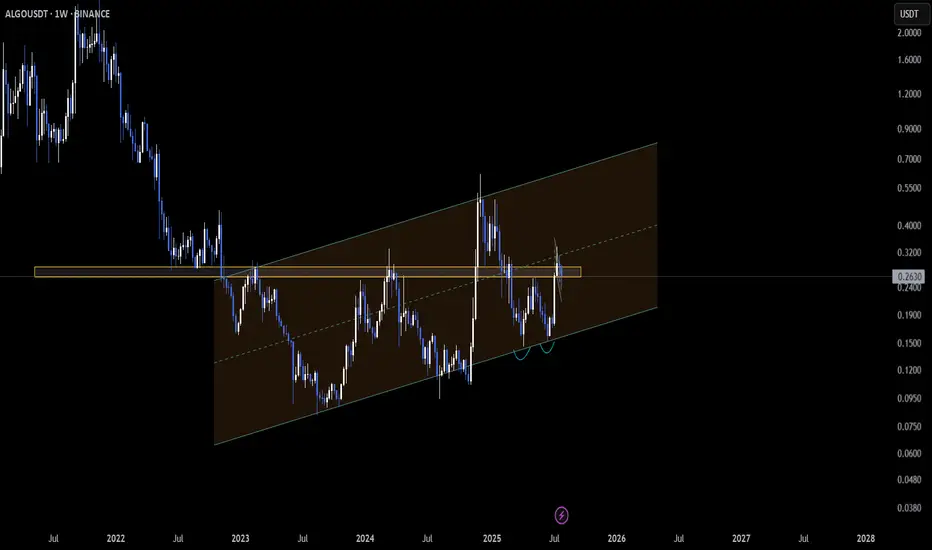
ALGO Multi-Timeframe Squeeze Near Critical Support🚨 EURONEXT:ALGO is compressing across the charts, and it's reaching a major inflection point.
📉 2H: Navigating inside a descending channel, with lower highs pressing down
📆 Daily: Price is hovering at a historically strong support zone
📅 Weekly: Still holding within a broader ascending channel
Buyers are defending key ground, but pressure is mounting. A bounce here could spark a quick reversal 🔼 — failure to hold might accelerate downside momentum 🔽
These multi-timeframe squeezes don’t stay quiet for long.
👀 Which way are you leaning — bounce incoming or support breakdown?
Not financial advice.
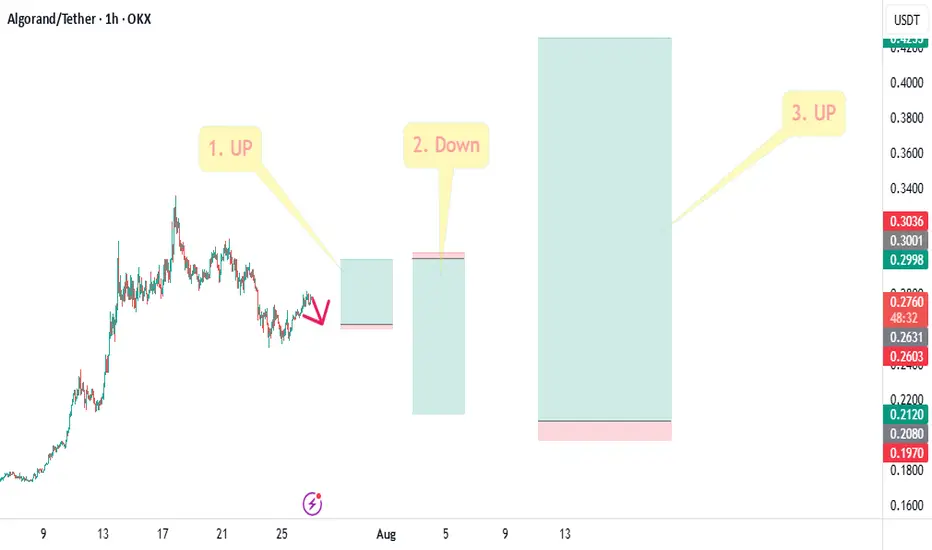
#ALGO Moves of 3 trades in a single chart.#ALGO Moves of 3 trades in a single chart.
In this, the first trade represents a long position on a short-term time frame. Then, a short position can be opened for the retracement. After that, the final third move could be an upside move of more than 100%.
Join Us For All Updates.
@Namaste@
Algorand Coming Near You Soon!Repeat after me: A simple chart a day is all you need for great TA!
Need I say more?
Included volume data and RSI if you needed more confluence. LL on RSI confirming what's in PA.
This isn't financial advice y'all
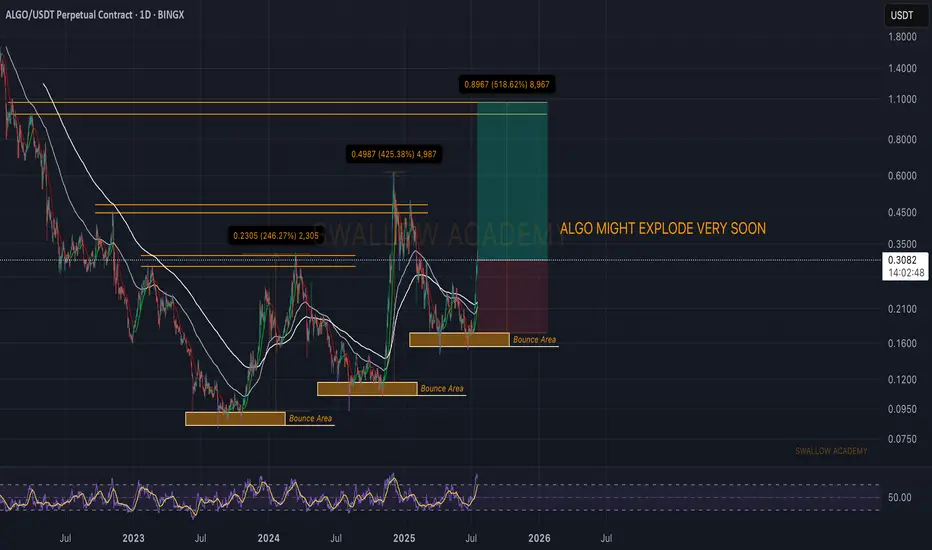
Algorand (ALGO): Potential +250% of Movement To HappenAlgorand is on fire, just like the rest of the market. We noticed a similar pattern, where we have 3-stage movement on this ALGO.
Accumulation—bullish move—bearish move—repeat.
So that's what we are looking for. As we are in a mid-bullish move, we want to see further movement to upper zones, of at least +250% so keep your eyes wide open!
Swallow Academy
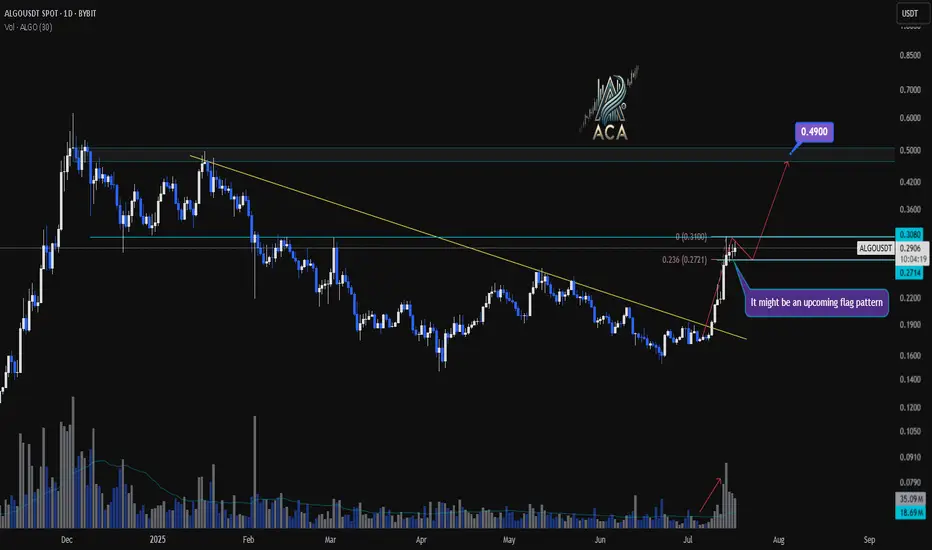
ALGOUSDT Daily Chart Analysis | Continuational patternsALGOUSDT Daily Chart Analysis | Momentum Picks Up on Higher Timeframe
🔍 Let’s break down the latest ALGO/USDT daily chart, highlighting a shift in market structure and key bullish signals.
⏳ Daily Overview
A decisive breakout above the long-standing descending trendline has flipped the narrative for ALGOUSDT. Increased volume during the breakout points to robust bullish momentum, suggesting buyers are regaining control at this multi-month inflection point.
🔔 Flag Pattern & Chart Structure
- Bullish flag pattern is emerging after the recent breakout, as price consolidates in a tight range—a classic continuation formation.
- Former trendline resistance is now acting as support, confirming a notable shift on the higher timeframe.
📐 Fibonacci & Target Levels
- The 0.236 Fibonacci retracement at $0.2771 is providing immediate support, with price consolidating above this anchor level.
- Upside targets:
- First resistance at $0.3080, which aligns with horizontal supply and previous pivot highs.
- If the flag pattern resolves upward, the next Fibonacci extension points to $0.4900, marking a significant confluence and potential for further gains.
📊 Key Highlights
- Strong daily candle and surging volume confirm momentum shift.
- Watch the developing flag pattern for breakout confirmation.
- Major trendline break on the daily signals structural reversal.
- $0.3080 is the immediate target; $0.4900 is the extended objective from the flag/Fibonacci alignment.
🚨 Conclusion
ALGOUSDT is setting up a compelling bullish scenario—keep a close eye on price behavior at the flag and $0.3080 level. A breakout may trigger the next impulsive move toward $0.4900.
ALGO/USDT – Bull Flag Formation hi traders
Algorand (ALGO/USDT) is showing a strong bullish continuation pattern following an impulsive price move upward.
🔍 Technical Overview:
Current Price: $0.2828 USDT
Pattern: Bull Flag
A sharp upward move (flagpole) is followed by a period of consolidation within a downward-sloping channel, forming the flag.
This is a classic bull flag pattern, often indicating a pause before continuation in the original trend direction.
Volume Profile:
Volume surged during the flagpole advance.
It has since tapered off during the consolidation, which supports the textbook flag setup.
📈 Bullish Breakout Expectation:
Once the price breaks above the upper resistance trendline of the flag, a strong continuation move is likely.
The projected target is approximately $0.3677, representing a ~29.9% upside from the breakout level.
This target is measured by applying the height of the flagpole to the breakout point.
Wait for volume confirmation to avoid false breakouts.
*Important:
Failure to break the flag’s upper boundary could lead to further consolidation or a retracement.

ALGORAND - LONG TERM BUY OPPORTUNITY, BEST ENTRY PRICE, 600%+ALGORAND (ALGO) is one of the layer 1 blockchain platform's that is compatible with ISO 20022. ISO 20022 is a global standard for financial messaging that aims to standardize electronic data exchange between financial institutions. Some speculate whether this is applicable or not long term, however the narrative still exists, so along with other ISO 20022 cryptos such as XRP, this can mean a nice place to park some capital in crypto. Conservatively, Algorand can touch $1.00 long term and then potentially $2.00 especially if any announcements, collaborations or other catalyst arise. Algorand is working towards quantum resistance, and that's also a selling point for the blockchain. Gary Gensler once praised Algorand and take that with what you must, but that doesn't hurt when former SEC Chairman shills a crypto project.

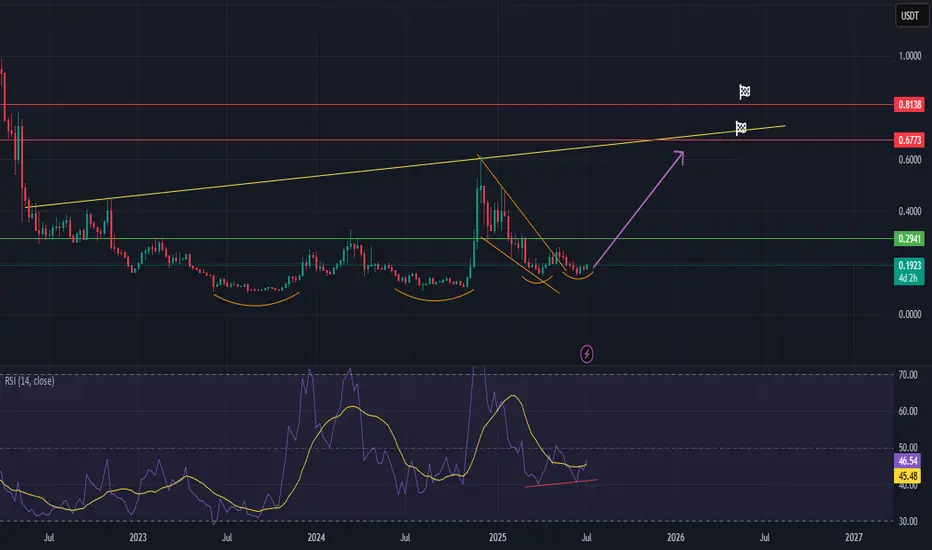
ALGOUSDT - One of the Best Altcoin Setups Right This chart of ALGO/USDT presents one of the cleanest and most promising bottom formations in the entire altcoin market.
🔍 Technical Highlights
Clear Rounded Bottoms: ALGO has formed multiple rounded bottoms over a long accumulation period, signaling strong base building and exhaustion of sellers.
Descending Wedge Breakout: A breakout from the falling wedge pattern has occurred, further validating the bullish reversal.
RSI Divergence: On the RSI, we see a bullish divergence, suggesting momentum is shifting to the upside.
📈 Market Outlook
ALGO looks ready to begin a parabolic move, breaking out from months of consolidation.
This setup combines long-term support, bullish structure, and momentum reversal.
Based on this structure and previous behavior, we expect a powerful move over the next 1–2 months.
🎯 Targets
First target: $0.6773 — long-term trendline resistance.
Final target: $0.8138 — previous key resistance zone and measured move potential.
🛡️ Conclusion
This is a high-potential setup that stands out in the current altcoin landscape. The structure, volume compression, and technical signals strongly suggest ALGO is preparing for a major breakout. If the move plays out as expected, we could see the price reach both targets within the next 60 days.
One to watch very closely!
ALGOUSDT Approaching Breakout!BINANCE:ALGOUSDT is showing a potential trend reversal after bouncing from a strong historical demand zone around $0.15. Price action is testing the descending trendline for a breakout, which could trigger a bullish continuation move. Similar to the previous breakout in late 2024, this setup hints at a possible repeat rally. A weekly close above the trendline would confirm strength, opening targets at $0.32 and $0.70+.
COINBASE:ALGOUSD
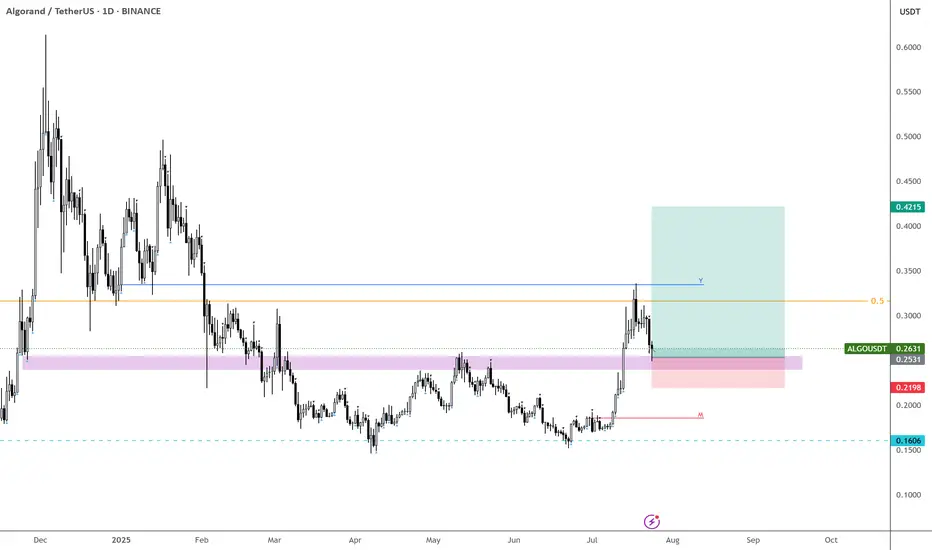
Algo |Trade Setup📌 After the breakout from the last high at $0.26, a bullish sequence (green) has now been activated.
📊 These setups typically occur no more than twice per year on any given altcoin, so I’ll be aggressively buying each level at the B-C retracement area.
Trademanagement:
- I'm placing long orders at each level. ((If the price continues climbing, I’ll adjust the trend reversal level (green) accordingly and update my limit orders.)
- Once the trade reaches a 2 R/R, I’ll move the stop-loss to break-even.
- From a 3 R/R onward, I’ll start locking in profits.
✅ I welcome every correction from here on —
but I won’t enter any new positions at these top levels.
Stay safe & lets make money
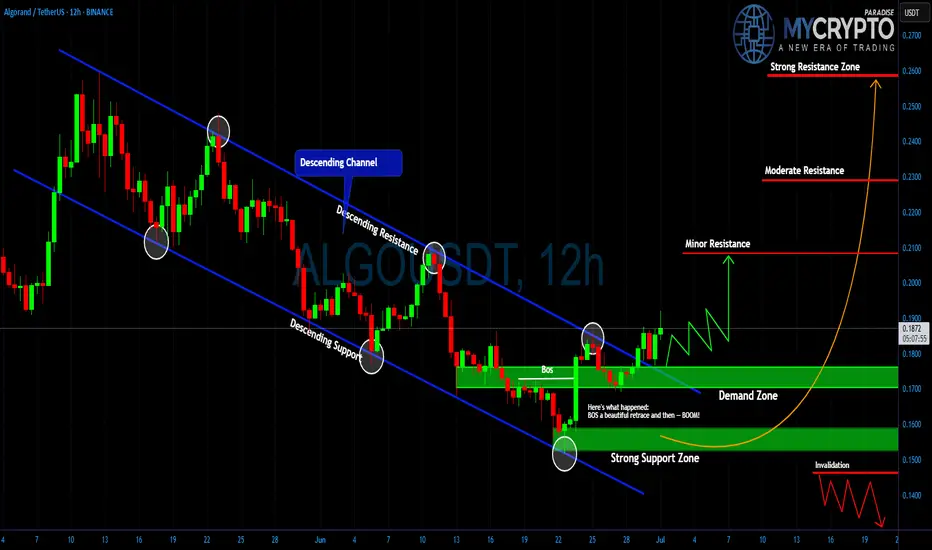
ALGO: Surprise Rally Ahead?Yello Paradisers, did you spot that breakout from the descending channel in time or are you still waiting for confirmation that already happened?
💎#ALGO/USDT has officially broken out of its multi-week descending channel after a textbook Break of Structure (BoS). Price action gave us a beautiful retrace into the demand zone, and from there boom momentum began shifting. This move is now showing early signs of bullish continuation, but as always, the majority will only realize it once the big move is already done.
💎#ALGO had been trading within a clearly defined descending channel, with price reacting precisely between the descending resistance and descending support lines. The breakout occurred after a strong candle pierced the descending resistance, and more importantly, we got a BoS followed by a clean retest of the demand zone around $0.165–$0.175. That reaction was sharp and decisive, indicating strong interest from buyers stepping in.
💎As of now, it is trading near $0.186 and forming higher lows, which supports the idea of an ongoing trend reversal. The structure has changed, and bulls are slowly regaining control. If price sustains above $0.190, the doors open for further upside. The first key level that could slow momentum is minor resistance near $0.210. If that level breaks with volume, moderate resistance around $0.230 becomes the next critical zone. Above that, the major target sits at $0.260, a strong resistance area where a lot of liquidity could be triggered.
💎On the flip side, the strong support zone between $0.145 and $0.155 remains our invalidation area. If price drops below this range, the bullish setup collapses, and we reassess the entire structure. But unless that happens, the bias remains cautiously bullish.
Trade Smart. Stay Patient. Be Consistent.
MyCryptoParadise
iFeel the success🌴
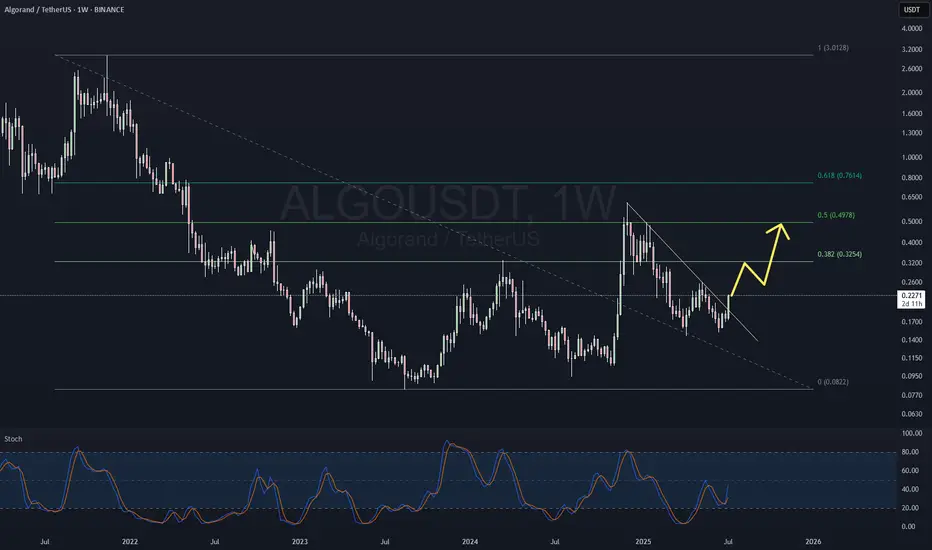
ALGORAND at $0.50?Considering the Fibonacci levels from the November 2021 decline to the August 2023 low, the current movement suggests a test of the last high, which coincides with the 0.5 Fibo level.
This suggests that ALGORAND is likely to test resistance at $0.50 before seeking higher moves to $0.75 (0.618 Fibo). If it overcomes this level, the sky's the limit, and resistance should only be found above $2.00.
ALGOUSDT – Spot Swing Trade RecommendationALGOUSDT – Spot Swing Trade Recommendation
Reason: ALGO has formed clear bottoms on Weekly (W) and Monthly (M) charts, signaling the start of a long-term bullish cycle on the Monthly timeframe.
Entry: Around current price ~$0.22.
Strategy: Accumulate gradually—buy below $0.22; avoid adding positions above this price.
Take Profit:
Based on W and M peak signals, or
Fixed price target above $0.80.
Note: Weekly bottom just formed; expect momentum to pick up in 2-3 weeks.
