potential to buyOn many coins that have hit the previous weeks low 3 times in a row, and In all those coins, 5 of them have made another 3 days of breakout to the low of the week, looking to buy when a there is a session turnover to the upside. The second trade to finish the week. Hopefully tomorrow will be give a

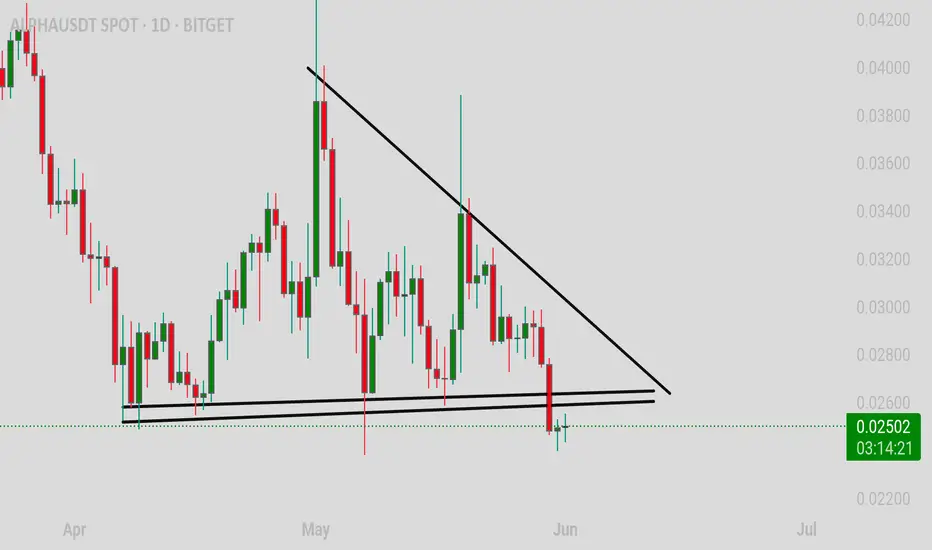
ALPHAUSDT breakdown alertALPHAUSDT breakdown alert
ALPHAUSDT has broken down from a descending triangle pattern, which is typically a bearish continuation setup. The price failed to hold above the lower support trendline, indicating increased selling pressure and a possible continuation of the downtrend.
If the breakdown
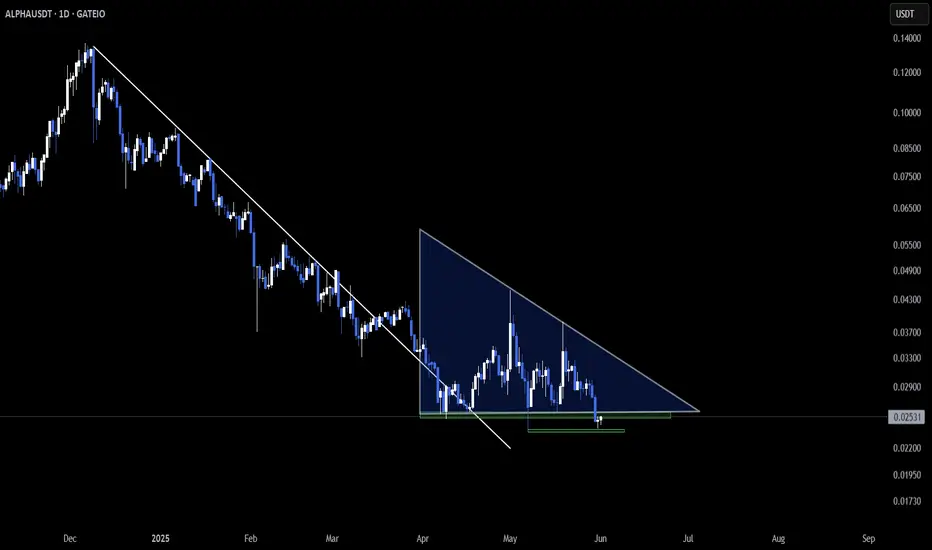
ALPHA – Descending Channel Breakdown & Key Support Watch⚠️ NSE:ALPHA is slipping below its daily descending channel 📉.
🔍 Weekly chart highlights horizontal support nearby — crucial zone to monitor for either a bounce or deeper weakness.
👁 Stay sharp — market moves are heating up!
ALPHAUSDT 1D Analyss ALPHA ~ 1D Analysis
#ALPHA Buy after successfully breaking through this resistance line with a short-term target of at least 15%++.
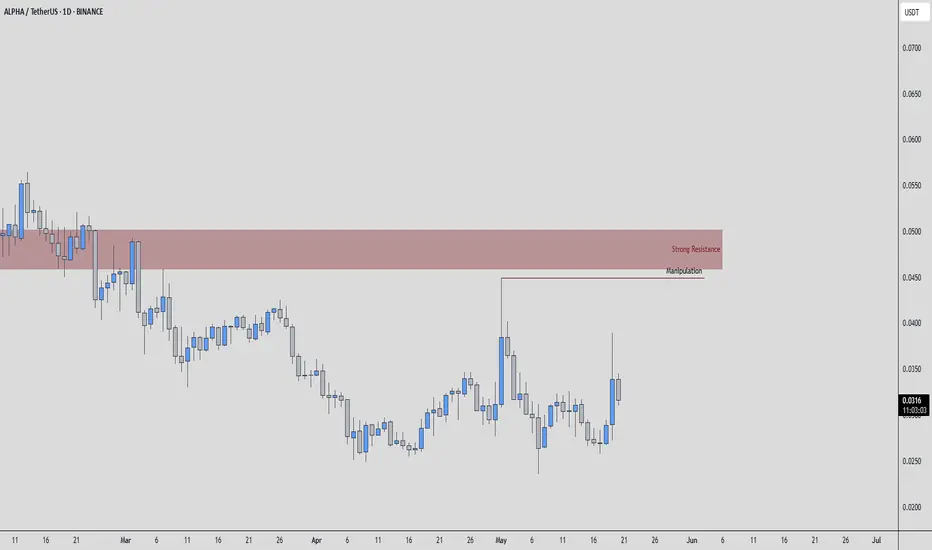
ALPHAUSDT | Sellers in Control—Key Resistance Levels DefinedALPHAUSDT shows a brief uptick, but the underlying strength remains with sellers. Buyers have yet to demonstrate sustained conviction, and this suggests any rally may be engineered rather than genuine.
🔴 Manipulation Target: Red Line
A slight advance today appears aimed at the area marked by the re
Stella (Alpha) Starts to Recover From True-BottomLet's start with the linear chart.
ALPHAUSDT is trading at bottom prices and here we can appreciate two sessions recently with really high volume. When the bottom is getting close, we tend to see whale accumulation happening.
The second high volume session came in 28-April.
The session that produ

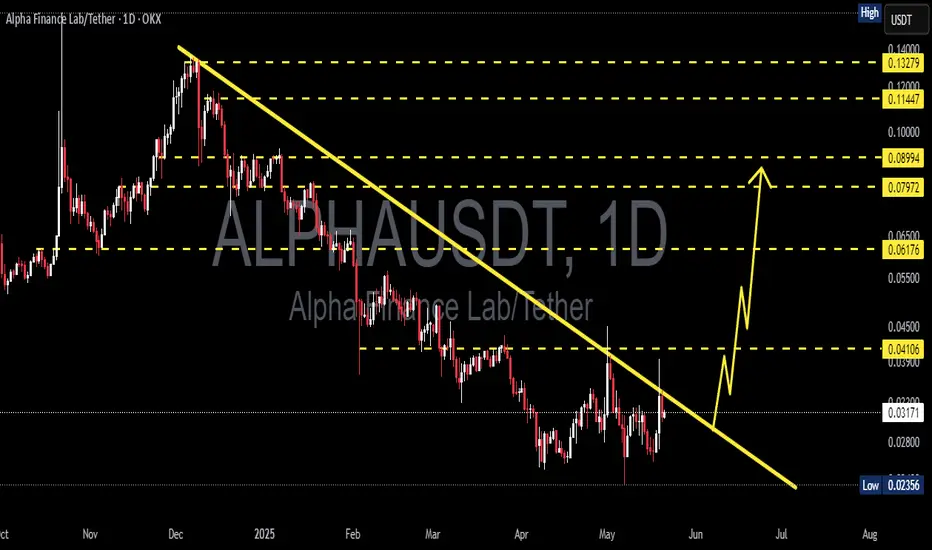
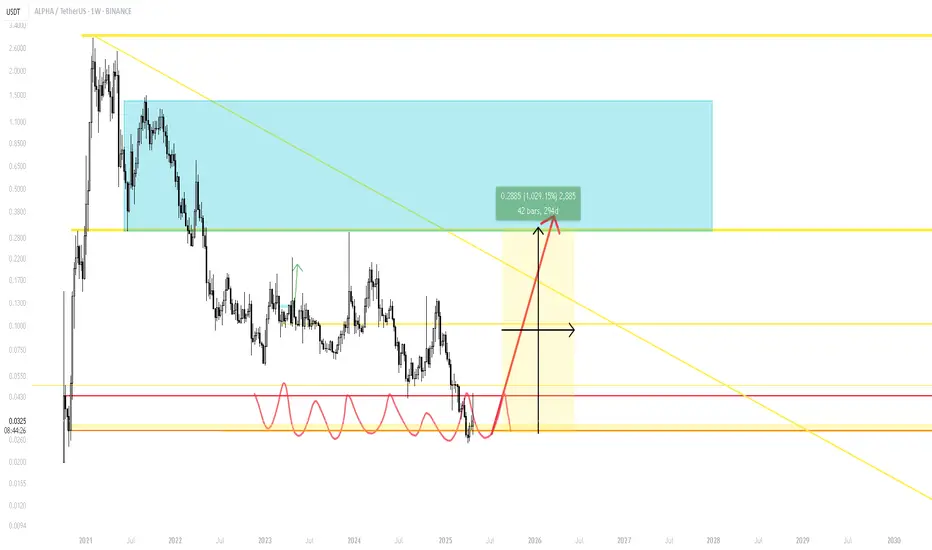
ALPHAUSDT 1D#ALPHA is breaking out above the descending channel on the daily chart. A successful retest of the channel and a breakout above the daily MA100 could trigger a 2x bullish rally. In that case, the targets are:
🎯 $0.0411
🎯 $0.0514
🎯 $0.0677
🎯 $0.0809
⚠️ Use a tight stop-loss.

ALPHA/USDT – Falling Wedge Breakout | Bullish Reversal in Play BINANCE:ALPHAUSDT has been trading within a classic falling wedge, a bullish reversal pattern, for several months. The wedge has been clearly defined by a series of lower highs and lower lows, gradually tightening into a breakout point.
The wedge’s measured move projects a potential 139% upside,

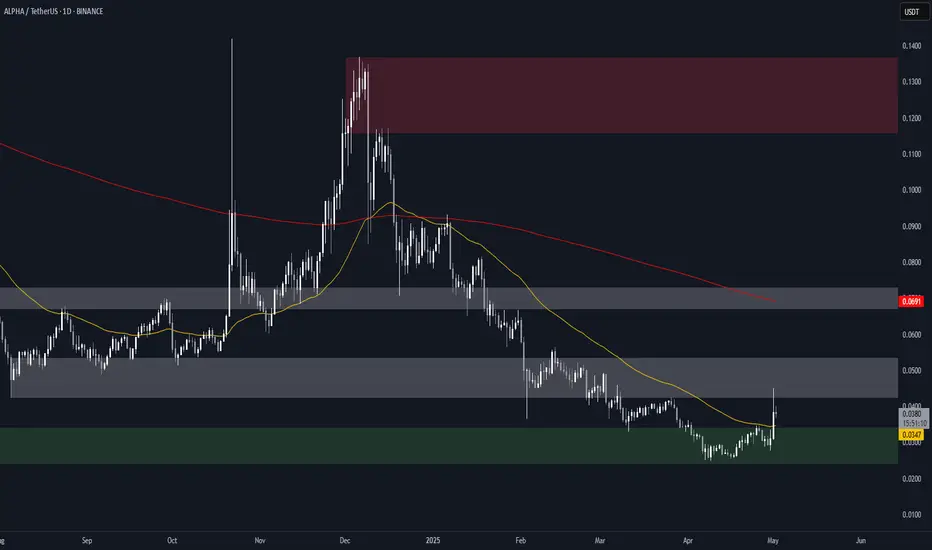
ALPHA Structure Analysis - 50-day EMA breakoutYesterday, BINANCE:ALPHAUSDT cleanly broke and closed above the 50-day EMA, which it hadn't been able to reclaim since December 2024. It also retested the previous $0.042-$0.052 demand zone, which acted as resistance.
Check the weekly chart below for more context:
Key Levels
• $0.024-$0.034
See all ideas
Summarizing what the indicators are suggesting.
Oscillators
Neutral
SellBuy
Strong sellStrong buy
Strong sellSellNeutralBuyStrong buy
Oscillators
Neutral
SellBuy
Strong sellStrong buy
Strong sellSellNeutralBuyStrong buy
Summary
Neutral
SellBuy
Strong sellStrong buy
Strong sellSellNeutralBuyStrong buy
Summary
Neutral
SellBuy
Strong sellStrong buy
Strong sellSellNeutralBuyStrong buy
Summary
Neutral
SellBuy
Strong sellStrong buy
Strong sellSellNeutralBuyStrong buy
Moving Averages
Neutral
SellBuy
Strong sellStrong buy
Strong sellSellNeutralBuyStrong buy
Moving Averages
Neutral
SellBuy
Strong sellStrong buy
Strong sellSellNeutralBuyStrong buy
Displays a symbol's price movements over previous years to identify recurring trends.