ALPHAUSDT.P trade ideas
ALPHAUSDT ANALYSIS UPDATE - Dear traders,
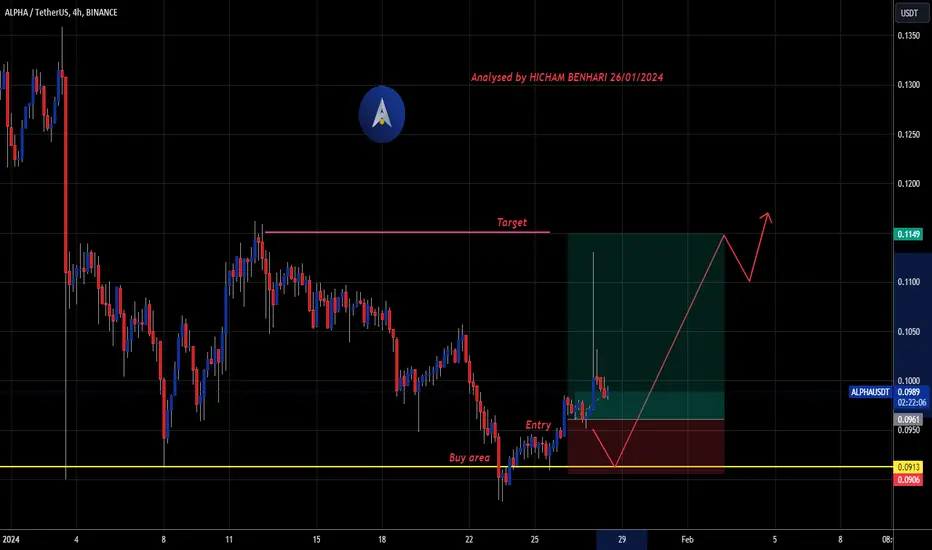
I would like to update you on the recent developments regarding our analysis of AlphaUSDT. Currently, the price is within the support zone that we have been monitoring closely over the past few days. This support zone has held, indicating a potential opportunity for a long position.
Technical Analysis:
Current Price: 0.918
Based on the current analysis, it appears that a long position could be considered. However, it is crucial to remain vigilant and confirm this decision by closely monitoring price action and technical indicators.
Key Levels:
Short-Term Resistance: in the chart
Profit Target: in the chart
Stop-Loss: in the chart
Remember that the market is always subject to fluctuations, and it is essential to manage risks appropriately. Ensure you conduct your own research and, if necessary, consult with a financial advisor.
Stay informed and happy trading!
Best regards,

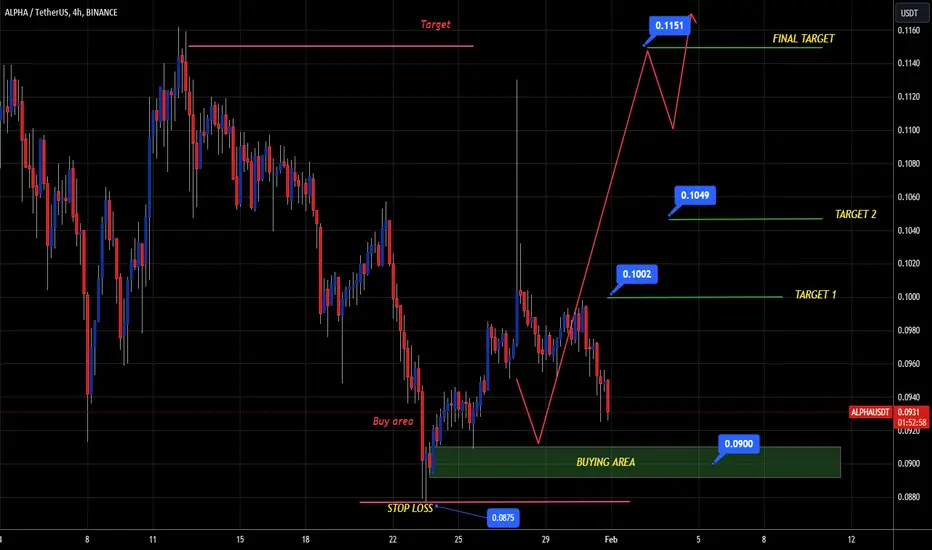
Analysis of ALPHA/USDT Trading 4hPotential Entry Point: 0.09 USDT
Justification:
Upon observing the chart, there appears to be a high likelihood of an upward rebound when the price reaches the zone between 0.0890 and 0.0912 USDT. This zone seems to act as historical support, indicating increased trader interest at these price levels. The consolidation within this range suggests a potential accumulation of positions.
Trade Targets:
First Target: 0.1
Second Target: 0.104
Third Target: 0.1151
Reasoning:
The zone between 0.0890 and 0.0912 USDT presents a strategic opportunity for an upward trade. However, it's crucial to remain patient and disciplined in trade execution, considering potential resistance levels as the price progresses. Proper risk management is essential to minimize potential losses.
Conclusion:
In summary, this analysis suggests an optimistic outlook for the ALPHA/USDT pair, with a defined entry point and clear targets. Nonetheless, traders should exercise caution and adjust their strategies based on evolving market conditions.
ALPHA / TetherUS There is a new opportunity to enter this trade Title: Opportunity for AlphaUSDT Price Increase After Correction
Introduction:
The introduction should provide a general overview of the current market situation and the correction experienced by AlphaUSDT. Emphasize the significance of the ongoing correction and the potential investment opportunity that may arise from it.
Technical Analysis:
Support Level Analysis:
Identify significant support levels reached by AlphaUSDT during the correction. Explain why these levels are important and how they have historically influenced price behavior.
Technical Indicators:
Use technical indicators such as moving averages, Bollinger Bands, and the Relative Strength Index (RSI) to assess the current market health. Demonstrate how these indicators may suggest an imminent reversal.
Fundamental Analysis:
Underlying Factors:
Explore fundamental factors that could influence the recovery of AlphaUSDT's price. This might include positive news, partnerships, technological developments, etc.
Market Sentiment:
Consider the market sentiment towards AlphaUSDT. Positive or negative news, along with investor reactions, can play a crucial role in determining future trends.
Possible Scenarios:
Present multiple possible scenarios for the future price movement of AlphaUSDT based on technical and fundamental analysis. Include bullish, bearish, and neutral scenarios.
Conclusion:
Summarize the key points of your analysis and explain why you believe there is an opportunity for an increase in AlphaUSDT's price after the current correction. Include warnings about the risks associated with any investment.
Remember that any market analysis involves risks, and it is essential to conduct thorough research and seek professional advice before making investment decisions.
Analysis of ALPHA/USDT Pair 4HThe ALPHA/USDT trading pair is currently within a crucial support zone, which could influence price movements in the upcoming trading sessions. This support zone can be identified by examining historical price levels where the ALPHA cryptocurrency has shown a strong upward reaction.
Considering the close correlation between different cryptocurrencies and Bitcoin (BTC), it's important to note that BTC often plays a significant role in determining overall market trends. In the current context, if BTC maintains a positive trend, this could create a favorable environment for altcoins like ALPHA.
Assuming that the positive trend in BTC continues, one might expect this momentum to be reflected in the ALPHA/USDT pair as well. Investors could show increased interest in riskier assets such as ALPHA , thereby promoting a price increase.
However, it's crucial to remain cautious and closely monitor market developments as cryptocurrencies are known for their volatility. Traders should be attentive to potential resistance levels and market reversal signals.
In conclusion, with ALPHA/USDT currently in a support zone and under the assumption that BTC maintains its positive trend, there could be opportunities for an upward movement in this trading pair. Nonetheless, proper risk management remains essential to navigate the volatile cryptocurrency market.

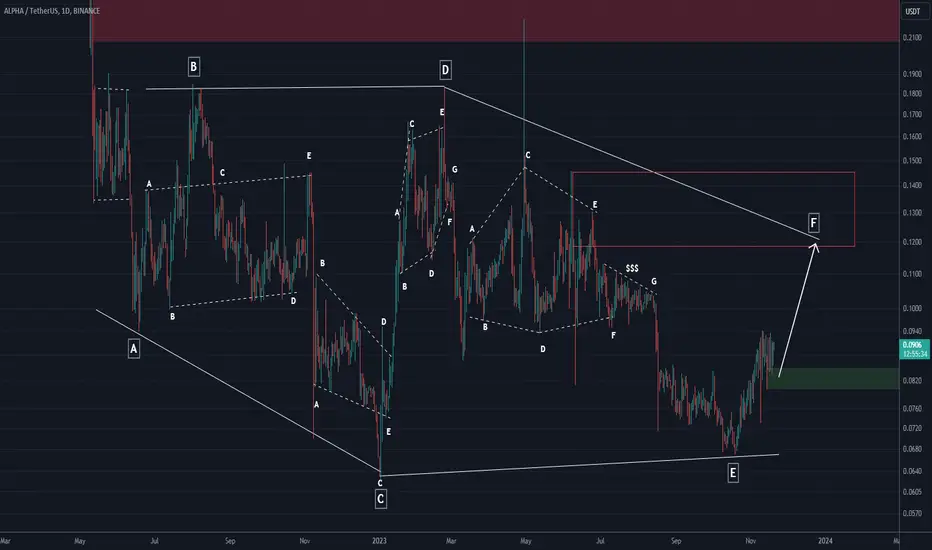
Alpha can be bullishIt seems that this currency is inside a diametric diamond that is now going to complete the F wave. It can climb by keeping the green area.
For risk management, please don't forget stop loss and capital management
Comment if you have any questions
Thank You
#ALPHA/USDT#ALPHA
The price has been moving in a descending triangle since May 2022
The price gained support at 35
The price is now at the upper border of the channel at 0.070
About to break the downtrend
The price is expected to break the downtrend
At the first price of 0.0900
First goal 0.0160
Second target 0.2170
Which represents 300% of the current price
With an oversold presence on the MACD
The price will be paid after breaking the moving average 100
✅Thank you, for more ideas, hit 🚀 Like ❤️ and Follow🤝 🛎!

#ALPHA/USDT#ALPHA
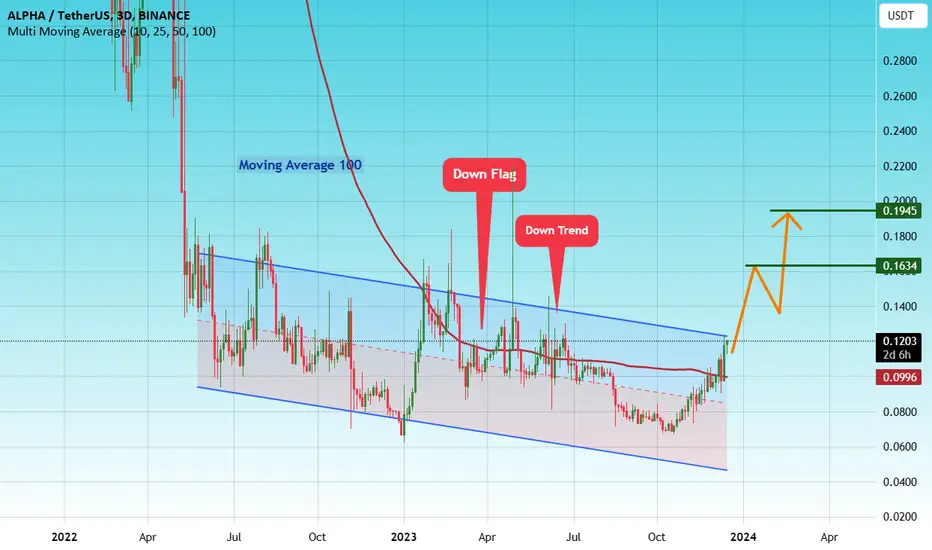
We have had a down flag since April 2202
We have strong upward momentum that will help us breakout
We currently have a break in the downtrend
We have a clear breakout of the Moving Average 100
Current price is 0.1205
First target 0.1634
Second goal 0.1945
Which represents 190% of the current price
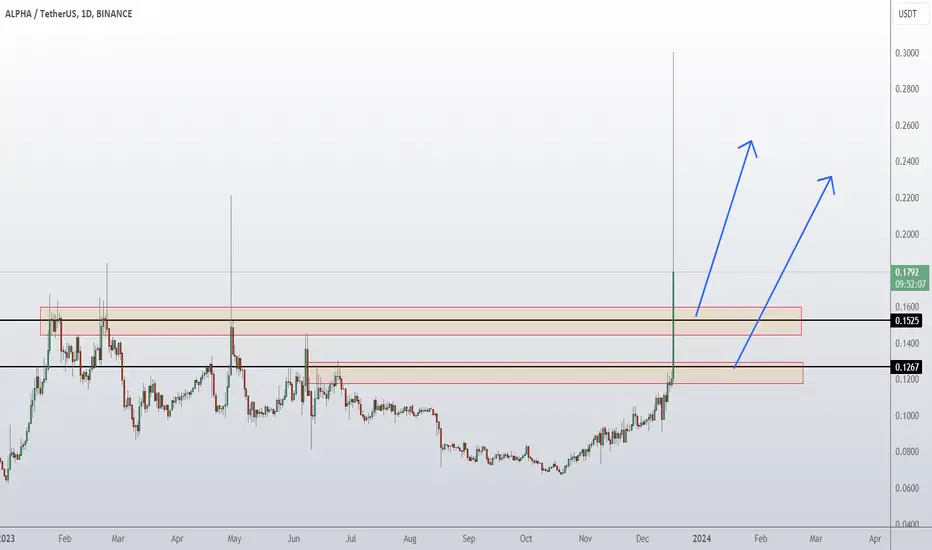
ALPHA COIN PRICE PREDICTION✅🔥 Price on the daily chart might come at these support area and we might get a potential bounce🔥
Potential bounce areas for Buying 0.1550 and 0.1293
👉 Follow me for more real time opportunities.
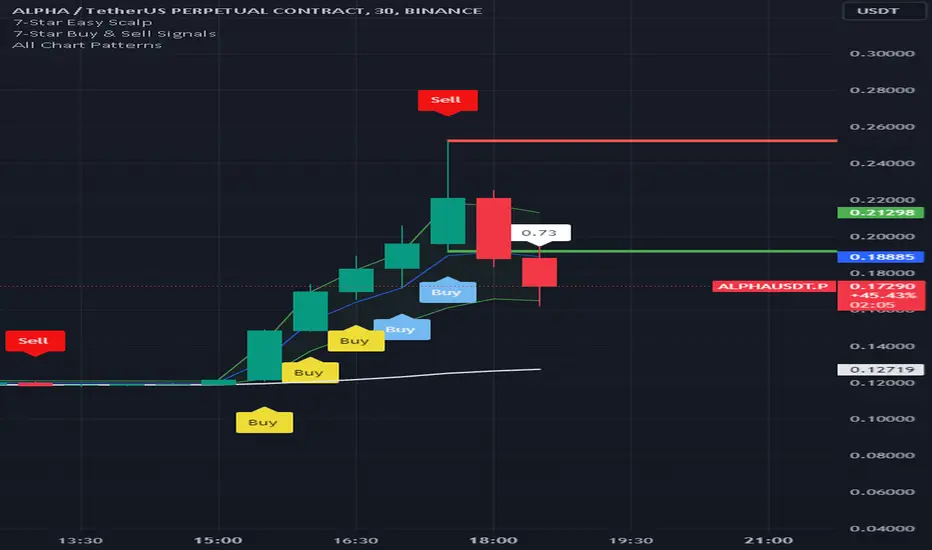
Alpha PullbackAfter good buy and sell prints. It's time for a pullback. the price just touched that lower green line and target will be the middle blue line. DYOR
ALPHAUSDT - JUST BUY 200%Thanks to my student who pointed out this coin, very similar chart to coins that have already pumped 200-300% like gafi slim

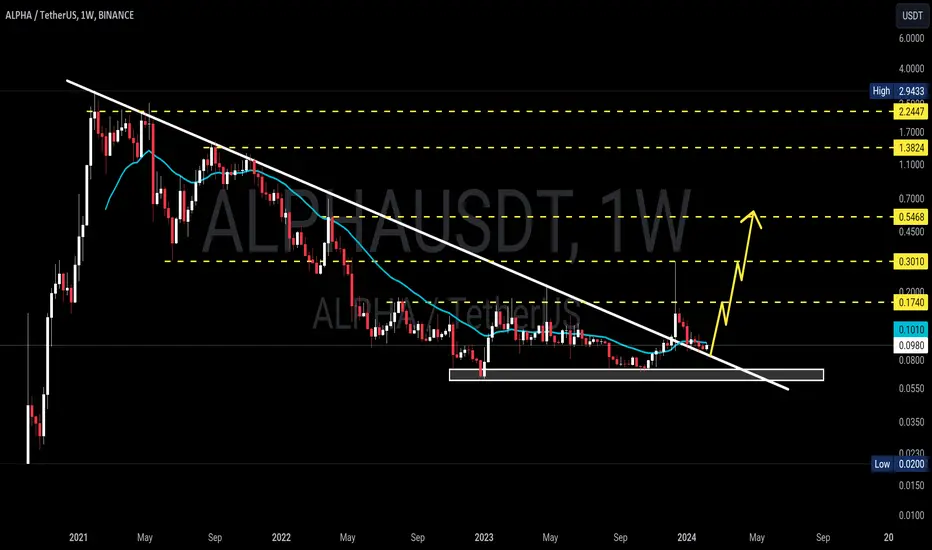
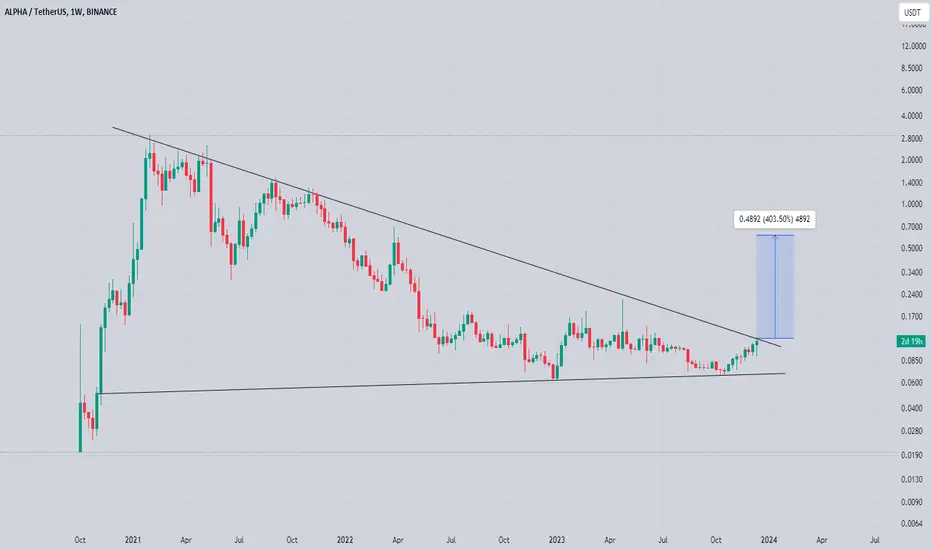
alpha on verge of massive breakout seems like bottomed out and on verge of massive breakout in weekly timeframe
formed symmetrical triangle in weekly tf and currently testing descending trendline and expecting breakout soon
incase of successful breakout expecting 3 to 4x bullish rally in midterm keep eyes on alpha for confirmed breakout
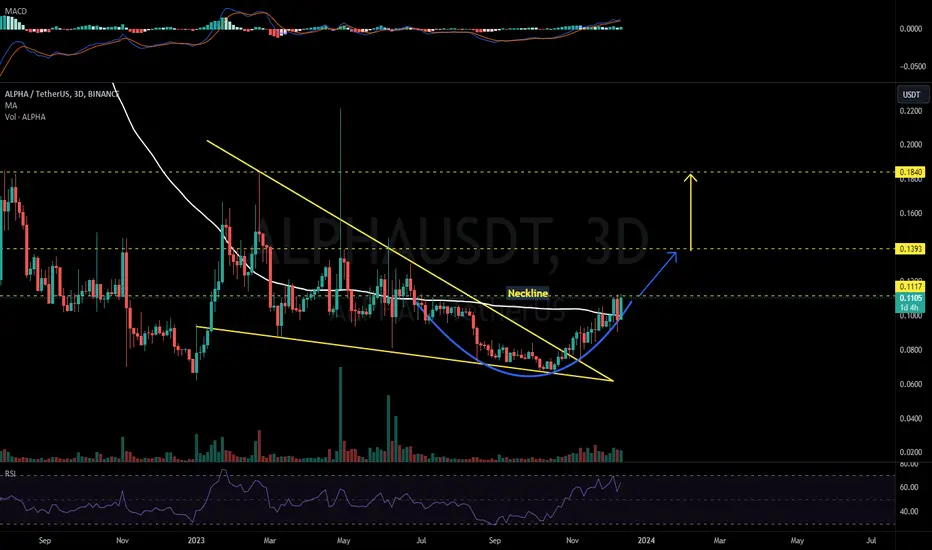
ALPHAUSDT 3D#ALPHA broke out the falling wedge and moving above the MA100 on 3-days chart. Currently facing with the neckline of the rounding bottom. Wait for breakout and then enter. Targets are on chart.
$ALPHAIt's on the brink of breaking out from a descending channel. If the breakout happens, there's potential for a 450-600% bullish rally in the midterm.

ALPHAUSDTALPHAUSDT IS in bearish trend potentiall printing LH and LL.
No sign of trend reversal here.
We wait and watch for the breakout of lat LL.

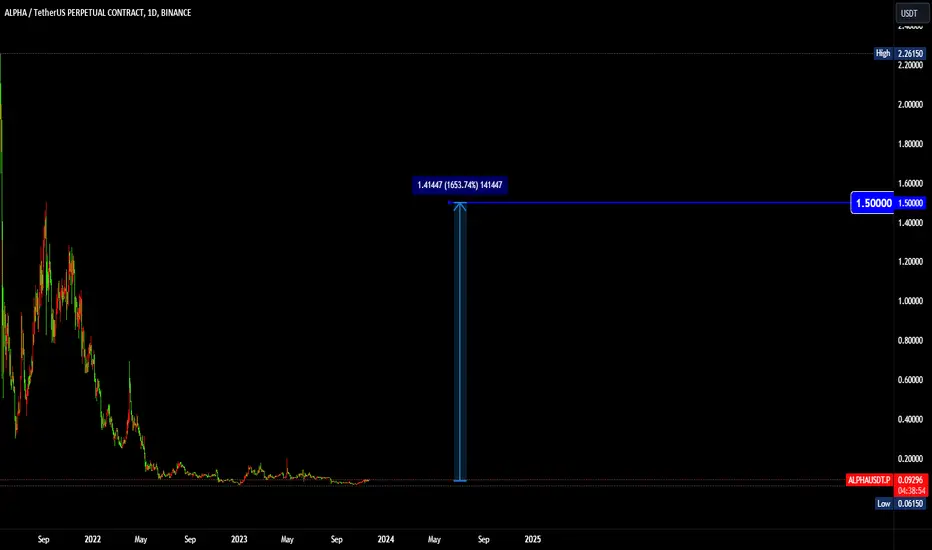
ALPHAUSDT"As we enter the bullish season, the initial target to aim for is
target : 1.5 🎯.
This is based on a combination of technical analysis indicators and market trends.
However, it's important to approach trading with caution and adapt to changing market
conditions.
Keep an eye on key support and resistance levels, as well as any significant news or events that may impact the market.
Remember to use proper risk management techniques and consider setting profit targets along the way.
Happy trading!"
ALPHA target 0.21D time frame
-
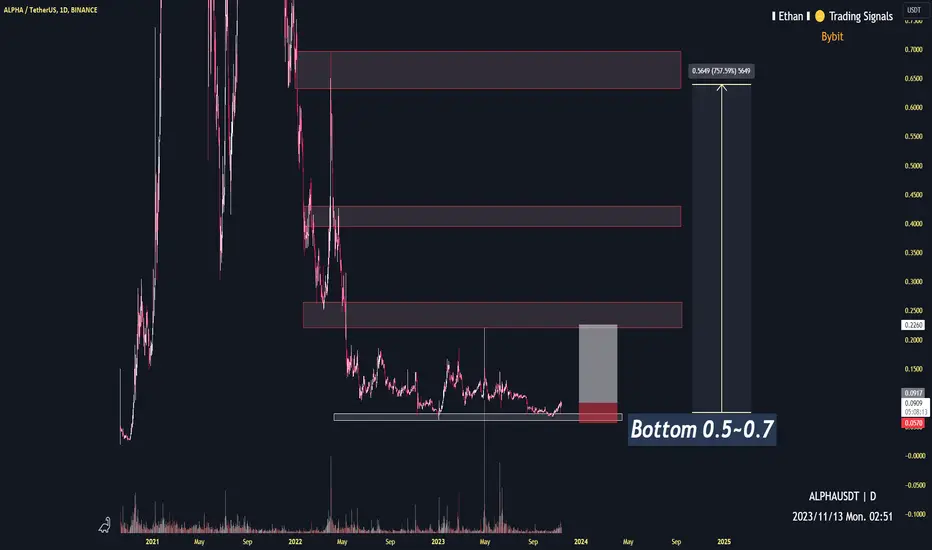
ALPHA is creating a bottom structure ranging from 0.5~0.7, and there are 3 obvious resistance zones on the chart. Considering the potential trend of Bitcoin and Ethereum, the first resistance (0.2) is the possible PRZ before bull coming. However, if bull market start running, we can expect 0.6 in next year.
TP: 0.2~0.26 / 0.4~0.43 / 0.6~0.7
SL: 0.057
ALPHAUSDT - Buy Setup!!ALPHAUSDT (1D Chart) Technical analysis
ALPHAUSDT (1D Chart) Currently trading at $0.085
Buy level: Above $0.084
Stop loss: Below $0.073
TP1: $0.09
TP2: $0.1
TP3: $0.12
TP4: $0.145
Max Leverage 3x
Always keep Stop loss
Follow Our Tradingview Account for More Technical Analysis Updates, | Like, Share and Comment Your thoughts

🚨 Trade Alert: ALPHA/USDT (3-5x)🚨 New Trade Alert 🚨
✅ ALPHA/USDT (3-5x)
📉 LONG Entry Zone: 0.081 - 0.08769
⛔️ SL: 0.07728
🔒 Breakeven Move: When it moves close to TP2
🎯 Take Profit:
Short Term: 0.089 - 0.091 - 0.093 - 0.096 - 0.101
Mid Term: 0.107 - 0.114 - 0.121 - 0.135 - 0.145
📝 Ensure you set entry orders to balance the trade's entry and aim to secure 30% of profits within the first two targets. Once profits are gained, adjust the stop orders to match the entry points or break-even levels.
⚠️ Disclaimer: Historical earnings cannot assure future outcomes. Is there a potential for risk? Certainly. The entire financial market is susceptible to uncertainties; any underlying factor or abrupt shift in market sentiment could overturn the current market trends and lead to losses. Refrain from undertaking undue risks that might jeopardize your financial stability. You are under no obligation to engage in this trade; kindly avoid the trade if you disagree with the trade analysis.
GIS TRADING®
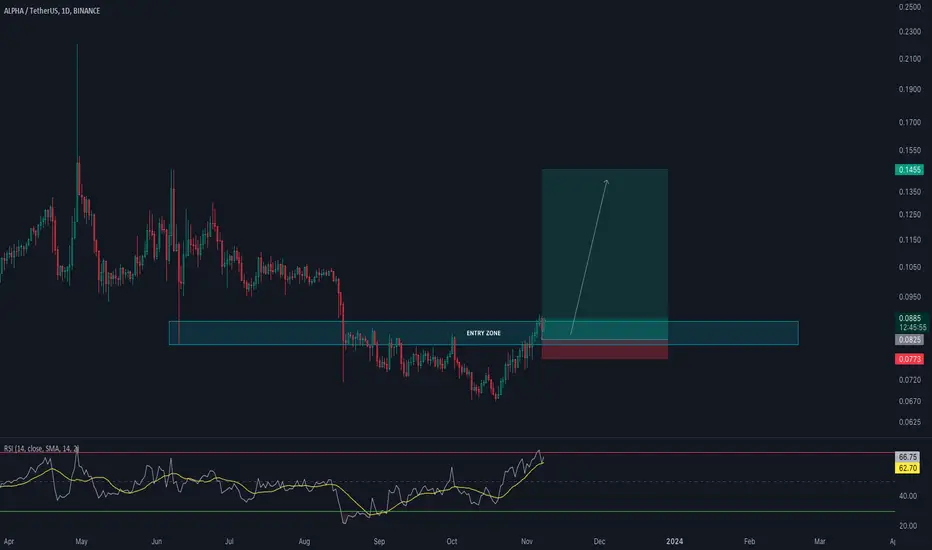
Chart map for $ALPHA.USDT 🐺🫡Chart map for Alpha, combination of double bottom, head and shoulder reversal 🫡🐺💎

ALPHA - can't wait anymore!Dear my friends,
After I check the Alpha price on the weekly frame. The result was a breakout and a retest.
Two pinbars at the bottom have formed. Order entry conditions are too good.
Start diving into the date frame. Price is finding the resistance area at 0.88 to retest. This is an important price zone to overcome.
Passing this price zone is very important to continue to the next 2 resistance zones.
But when observing the Ichimoku cloud, the price is approaching the cloud spiral area and the opportunity to break the downtrend is coming very close.
I think it's time to enter an order.
If the weekly closing price is below the support level, I will exit the order.
Best Regards,
ALPHA/USDT Break the Symmettrical Triangle, Bullish Momentum??Yello Paradisers, Break Alert!
💎Alpha has broken the symmetrical triangle pattern on the 4H timeframe, and is currently in the retesting phase on the resistance-turned-support trendline of the symmetrical triangle. To avoid a false breakout, we need confirmation at a higher timeframe, as the 4H timeframe has already validated the breakout.
💎 There is potential for the price to continue its upward movement and test the Bearish OB or supply area, which is crucial for Alpha. If Alpha successfully breaks the supply, it could easily continue to target profits 2. However, if it fails to do so, Alpha might revert back down.
💎 If Alpha maintains its position above the key support in the daily timeframe, this scenario remains valid. However, if it loses this support, the scenario would be invalidated, and a re-evaluation of the market conditions would be necessary.

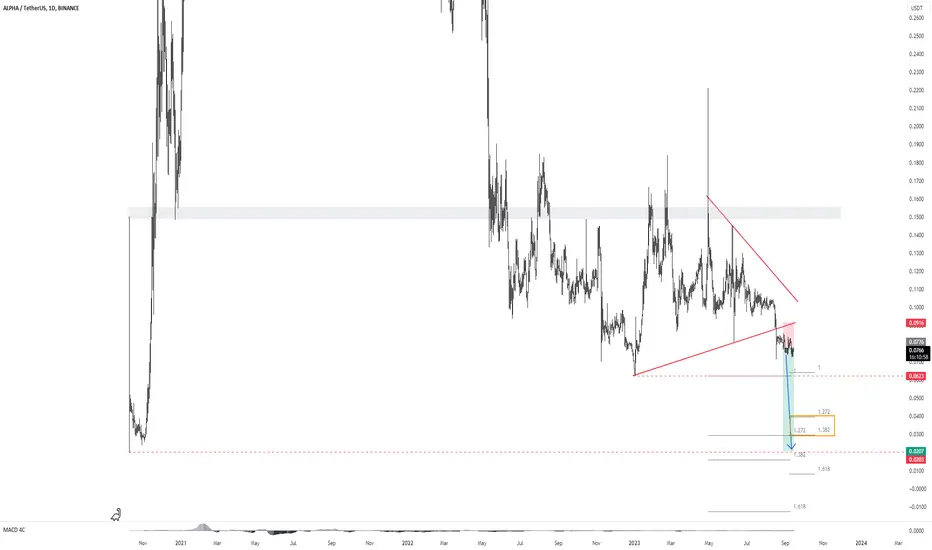
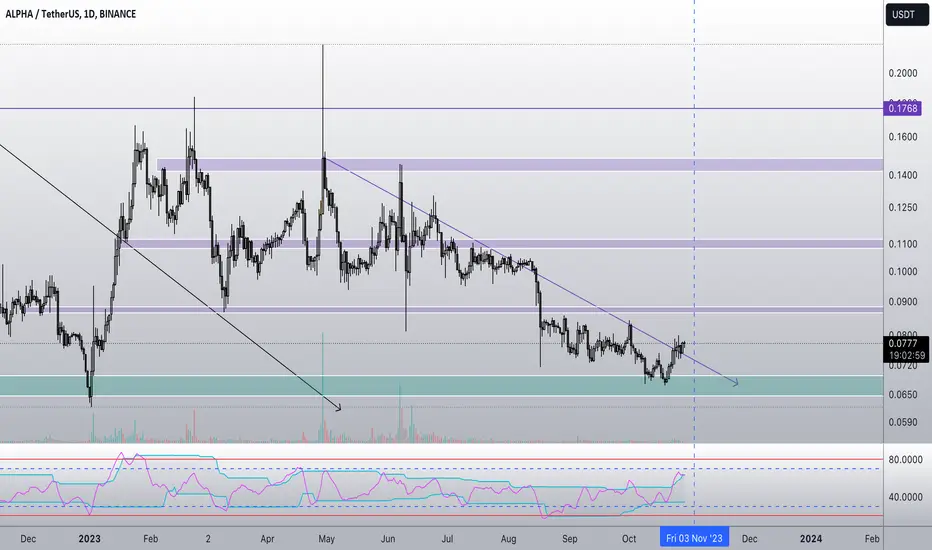
Hello previous All-time-low price of 0.02 centsI have been following this bearish triangle on ALPHA for a while and have entered a short position at the breakout.
My current view for this shitcoin is that the minimum target we should see is 0.0623, and if the bearish momentum is strong enough, we can sufficiently see it go to 4 - 3 - 2 cents range.