CORN Failed Bearish Symmetrical Triangle is BullishCorn experienced a failed bearish symmetrical triangle breakout to the downside. It is now rallying towards bullish head and shoulders breakout
Key stats
About Teucrium Corn Fund ETV
Home page
Inception date
Jun 9, 2010
Structure
Commodities Pool
Replication method
Synthetic
Dividend treatment
Capitalizes
Distribution tax treatment
No distributions
Income tax type
60/40
Max ST capital gains rate
27.84%
Max LT capital gains rate
27.84%
Primary advisor
Teucrium Trading LLC
Distributor
Foreside Fund Services LLC
CORN, as the ticker suggests, is a commodities pool that seeks optimal exposure to the corn futures market. The fund does not aim to provide front-month futures exposure like its benchmark, but instead pursues its objective by holding the second- and third- contracts out, along with the contract expiring the following December. The fund's strategy can work in its favor should corn futures market fall into steep contango. The fund's structure means a K-1 at tax time and a blended tax rate.
Related funds
Classification
What's in the fund
Exposure type
Futures
Cash
Corporate
Bonds, Cash & Other100.00%
Futures48.12%
Cash39.49%
Corporate12.39%
Mutual fund0.00%
Top 10 holdings


PBOF CORNMy PBOF chart is an attempt to identify, and be decisive, after a potential bottom has formed through with a good sequential 9 or 13 and triple exhaustion signal. Oscillator divergence and volume are clues to a potential bottom. Regardless they are are hard to bu into real time. But if it appears a

EU faces pressure to defuse mounting anger as farmers protest aGiven the mounting anger and protests by farmers across Europe, there appears to be a significant challenge stemming from contradictory and potentially detrimental agricultural policies. The grievances include increased costs for agricultural diesel, additional fees for water consumption, complex re

$CORN Bearish to bullish Reversal The narrative around AMEX:CORN is shifting from a bearish to a bullish outlook. The reversal in sentiment suggests that the asset could be entering a new upward trend, departing from its previous bearish trajectory. Investors may want to recalibrate their strategies to capitalize on this evolving

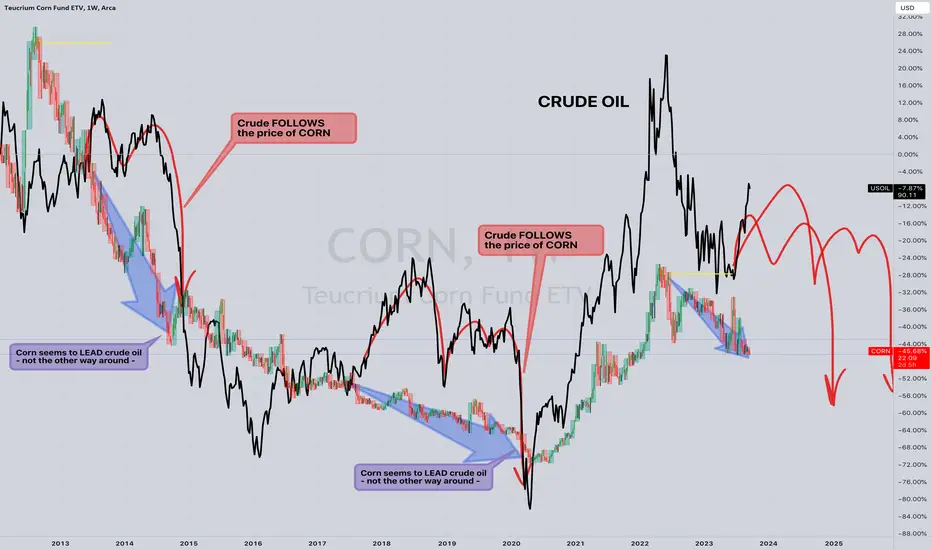
CORN vs CRUDE Here's a quick view of CORN vs CRUDE which has been moving together for the past ten years with some variation.
With CRUDE pushing highs here (Price Inflation fears rampant) and CORN pushing new lows (Food Deflation - no fears about falling corn prices in the news warning about falling inflation),
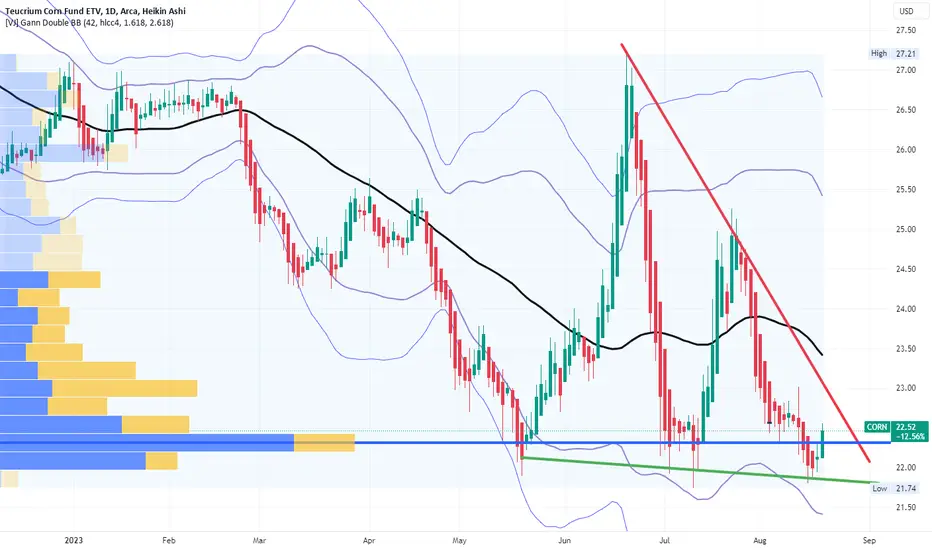
CORN wedge / triangle coiling for breakout LONGCORN on the daily chart since late June has fallen to the present level with a
flat or slowly falling support line. I see this as a falling wedge or a flat bottom triangle
slowly setting up a breakout whose upside could be 30% or more. Price had a nice
green engulfing bar to finish a down week i
CORN rises off a pivot LONGCORN, the ETF tracking spot corn and corn futures has ended its down trend on
the 15 minute chart. The pivot is not a surprise given the issues related to wheat
in the Black Sea shipping with the Ukraine war escalating onto the sea and the
grain export deal falling apart. The Price Momentum Oscil

Corn ETV Corn ETV
explainations of an ETV is simply a corn ETF(Trust) or something around the lines of a common bond; I would say; money is money; too me; so I will invest....

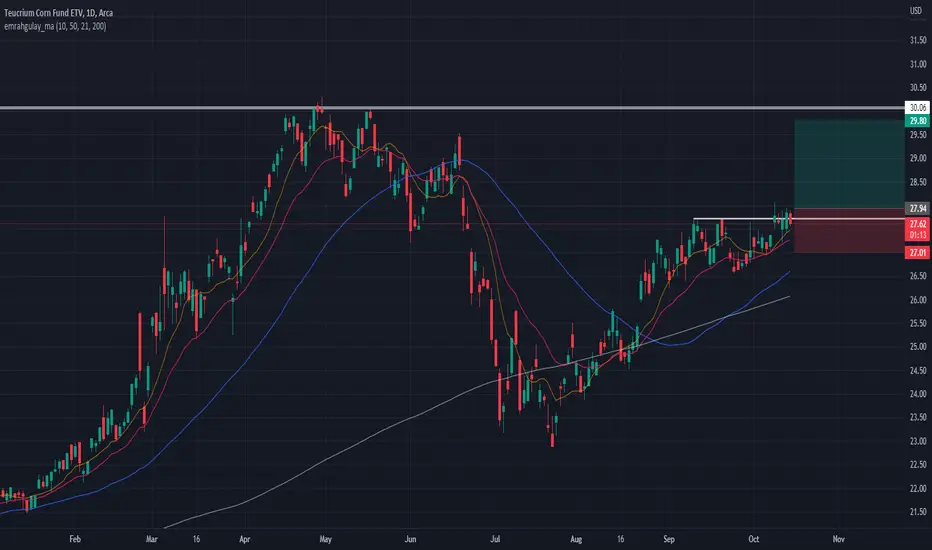
Corn ETF with inside bar signal $CORNThis ETF is the only good looking chart that I found.
With today's inside bar, a good risk/reward play would be:
Pivot buy at $28
Stop loss at $27
Target sell at $29.80
Lets see what happens.
See all ideas
Summarizing what the indicators are suggesting.
Oscillators
Neutral
SellBuy
Strong sellStrong buy
Strong sellSellNeutralBuyStrong buy
Oscillators
Neutral
SellBuy
Strong sellStrong buy
Strong sellSellNeutralBuyStrong buy
Summary
Neutral
SellBuy
Strong sellStrong buy
Strong sellSellNeutralBuyStrong buy
Summary
Neutral
SellBuy
Strong sellStrong buy
Strong sellSellNeutralBuyStrong buy
Summary
Neutral
SellBuy
Strong sellStrong buy
Strong sellSellNeutralBuyStrong buy
Moving Averages
Neutral
SellBuy
Strong sellStrong buy
Strong sellSellNeutralBuyStrong buy
Moving Averages
Neutral
SellBuy
Strong sellStrong buy
Strong sellSellNeutralBuyStrong buy
Displays a symbol's price movements over previous years to identify recurring trends.
Frequently Asked Questions
An exchange-traded fund (ETF) is a collection of assets (stocks, bonds, commodities, etc.) that track an underlying index and can be bought on an exchange like individual stocks.
CORN trades at 17.17 USD today, its price has fallen −0.54% in the past 24 hours. Track more dynamics on CORN price chart.
CORN net asset value is 17.21 today — it's fallen 2.27% over the past month. NAV represents the total value of the fund's assets less liabilities and serves as a gauge of the fund's performance.
CORN assets under management is 43.63 M USD. AUM is an important metric as it reflects the fund's size and can serve as a gauge of how successful the fund is in attracting investors, which, in its turn, can influence decision-making.
CORN price has fallen by −2.00% over the last month, and its yearly performance shows a −2.44% decrease. See more dynamics on CORN price chart.
NAV returns, another gauge of an ETF dynamics, have fallen by −2.27% over the last month, showed a −8.46% decrease in three-month performance and has decreased by −2.55% in a year.
NAV returns, another gauge of an ETF dynamics, have fallen by −2.27% over the last month, showed a −8.46% decrease in three-month performance and has decreased by −2.55% in a year.
CORN fund flows account for −14.16 M USD (1 year). Many traders use this metric to get insight into investors' sentiment and evaluate whether it's time to buy or sell the fund.
Since ETFs work like an individual stock, they can be bought and sold on exchanges (e.g. NASDAQ, NYSE, EURONEXT). As it happens with stocks, you need to select a brokerage to access trading. Explore our list of available brokers to find the one to help execute your strategies. Don't forget to do your research before getting to trading. Explore ETFs metrics in our ETF screener to find a reliable opportunity.
CORN invests in cash. See more details in our Analysis section.
CORN expense ratio is 2.71%. It's an important metric for helping traders understand the fund's operating costs relative to assets and how expensive it would be to hold the fund.
No, CORN isn't leveraged, meaning it doesn't use borrowings or financial derivatives to magnify the performance of the underlying assets or index it follows.
In some ways, ETFs are safe investments, but in a broader sense, they're not safer than any other asset, so it's crucial to analyze a fund before investing. But if your research gives a vague answer, you can always refer to technical analysis.
Today, CORN technical analysis shows the sell rating and its 1-week rating is strong sell. Since market conditions are prone to changes, it's worth looking a bit further into the future — according to the 1-month rating CORN shows the sell signal. See more of CORN technicals for a more comprehensive analysis.
Today, CORN technical analysis shows the sell rating and its 1-week rating is strong sell. Since market conditions are prone to changes, it's worth looking a bit further into the future — according to the 1-month rating CORN shows the sell signal. See more of CORN technicals for a more comprehensive analysis.
No, CORN doesn't pay dividends to its holders.
CORN trades at a premium (0.23%).
Premium/discount to NAV expresses the difference between the ETF’s price and its NAV value. A positive percentage indicates a premium, meaning the ETF trades at a higher price than the calculated NAV. Conversely, a negative percentage indicates a discount, suggesting the ETF trades at a lower price than NAV.
Premium/discount to NAV expresses the difference between the ETF’s price and its NAV value. A positive percentage indicates a premium, meaning the ETF trades at a higher price than the calculated NAV. Conversely, a negative percentage indicates a discount, suggesting the ETF trades at a lower price than NAV.
CORN shares are issued by Teucrium Trading LLC
CORN follows the Teucrium Corn Fund Benchmark. ETFs usually track some benchmark seeking to replicate its performance and guide asset selection and objectives.
The fund started trading on Jun 9, 2010.
The fund's management style is passive, meaning it's aiming to replicate the performance of the underlying index by holding assets in the same proportions as the index. The goal is to match the index's returns.