DIA trade ideas
A simple look at Dow Jones - correction coming?Puts did well this past week, and I am looking at a swing position on DIA to hold for more downside. In my earlier post (linked) I explain why I prefer DIA over SPY options if I want to trade a general market move.
If markets bounce then 357-358 and 360-361 are excellent put entry zones, based on daily chart. Today is an inside bar and markets have stalled for now. I am buying a few puts now if DIA moves below the daily 200ma instead of bouncing up.

Options day trade example. Swing trade entry.When the $DJI was up 200pts this afternoon, I was skeptical it could stay that high so I started looking at DIA. I also have a bearish bias right now on the markets. I prefer options on DIA vs SPY because SPY options are wilder and more volatile. People using gamma and delta strategies make it harder for "simple" long option traders like me. I only trade this index when I have a strong setup.
DIA was around 365 and I saw this as a resistance area. I bought weekly 364 puts for a day trade and as I started creating this chart the index dropped fast. I have exited most of my puts and will close the rest today.
In general, you should have a consistent set of indicators/signs that you use with success. Then you can spot a good setup quickly. The charts show you what I saw. I am leaning bearish on the daily chart, and RSI supports my idea (reversal under 65 after dip below 33.33).
Daily stochastic gave a warning sign (red arrow), so after the strong reversal rally I am looking for price to move below the channel, back to 355. If you use 365 for a swing trade entry and the index continues up to the top of the channel, the stop losses would be between 365.20 and 366, so this is a low-risk options trade.
For today's trade I used the 30m and 5m charts. Many traders (me too) get stuck watching price action and forget to sell at identified targets. 362.80-362.50 was my range to exit puts, and I held some for more downside or to exit green before end of day.
*** As I post this, 363.50 is also a good swing put entry on 30m chart, but I would use a smaller position and hold through price swings.

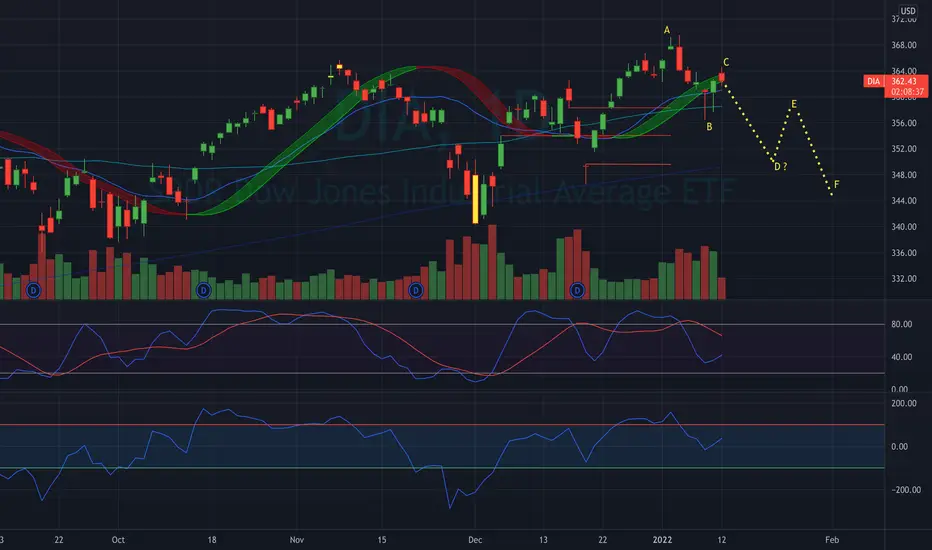
SHORT $DIA — BEARISH A,B,C,D PATTERN!
I'm expecting a move to the downside to complete this ABCD pattern in $DIA.
The gaps below the market will act as price magnets, and the same measurement from A to B from C would fill the bottom most gap.
I love this setup, and I'm buying puts on various names within the index and broader market to play it.
We could potentially see the pattern continue to the downside, but I am forecasting for a gap fill at minimum.
SHORT $DIA — BEARISH A,B,C,D PATTERN!I'm expecting a move to the downside to complete this ABCD pattern in $DIA.
The gaps below the market will act as price magnets, and the same measurement from A to B from C would fill the bottom most gap.
I love this setup, and I'm buying puts on various names within the index and broader market to play it.

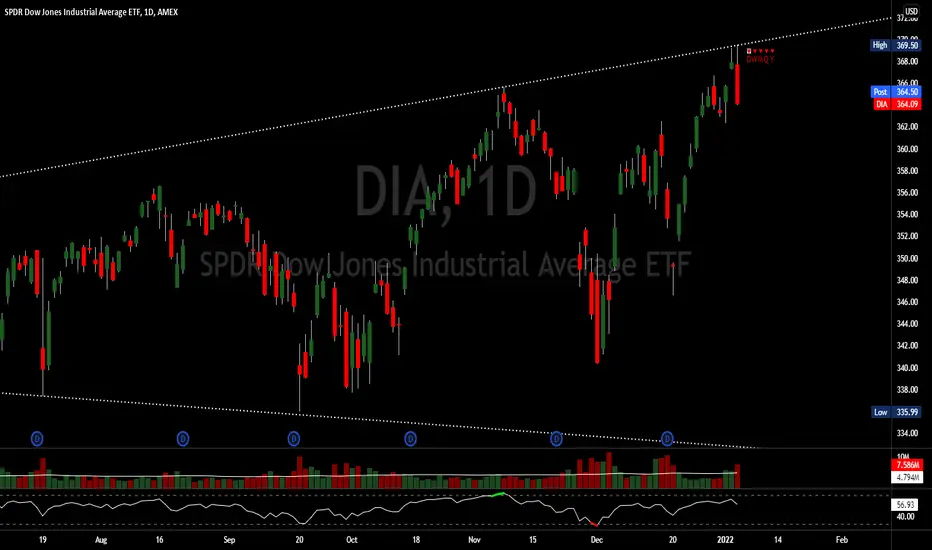
$DIA coming off top of daily broadening formationDIA, along with all indices, are looking like prime short candidates. Most are extended. Combined with fed news, COVID uncertainty, lack of US economic growth, and upcoming rate hikes, it appears this could be the start of some (temporary?) pain.

DIA DailyThe SPDR Dow Jones Industrial Average ETF Trust seeks to provide investment results that, before expenses, correspond generally to the price and yield performance of the Dow Jones Industrial Average. The Dow Jones Industrial Average is composed of 30 blue-chip U.S. stocks. The DJIA is the oldest continuous barometer of the U.S. stock market, and the most widely quoted indicator of U.S. stock market activity. The DJIA is a price weighted index of 30 component common stocks
$DIA year of the DOW?Rotation happening today, tech sector down big, DIA moving up. Will this be the story of the year, flight to Industrials from Tech?

Risk Model for the US Stock MarketThe S&P 500 closed 2021 as the top major stock market index. History suggests 2022 could be another strong year for investors. While it ended the day with a minor loss of 0.3%, the S&P 500 closed the year up just shy of 27%, the NASDAQ rallied 21% in 2021 - overall an outstanding performance of the larger indices.
Our risk model improved over the last 2 weeks in 2021, but key indicators still suggest an elevated risk for momentum swing traders. Some details:
- after the >5% rally in the second half of December, many of the distribution-days over the recent 25 trading period have lost their relevance. The DD-count shows positive.
- number of stocks making new 52w lows is still higher than number of stocks making new 52w highs - alarm signal!
- number of stocks trading below their 200d MA > number of stocks above their 200d MA - alarm signal!
- up/down volumes still below their 50d MA's and below 1 - alarm signal!
- the advance decline line significantly improved over the last two weeks and is now trending upwards. This could be a very promising signal as this is a leading indicator.
- bulls vs bears is a contrarian indicator which also improved over the last to weeks.
Overall, momentum swing traders can be somewhat optimistic going into 2022. For now, risk is still on an elevated level and swing traders should not yet get too aggressive. Take a few smaller pilot positions and if things start working in your own portfolio, start to increase exposure.

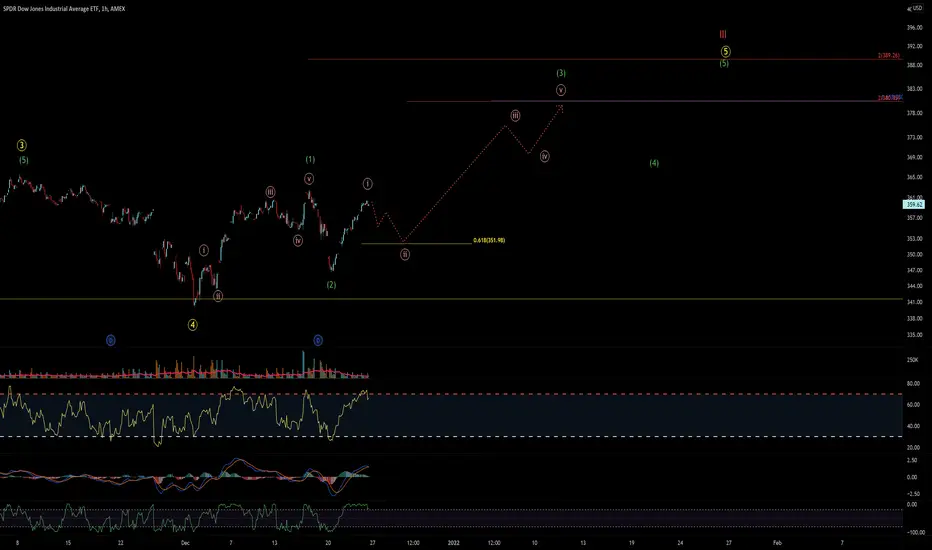
$DIA - hourly bull countShort term we are approaching a wave 1 peak (if I zoomed in very likely we are in 4 of 1 just like ES and NQ) - so we should see a buyable dip here shortly. After that dip buy I am seeing that we could pay a visit to the 380 area before we tag this cycle III top.
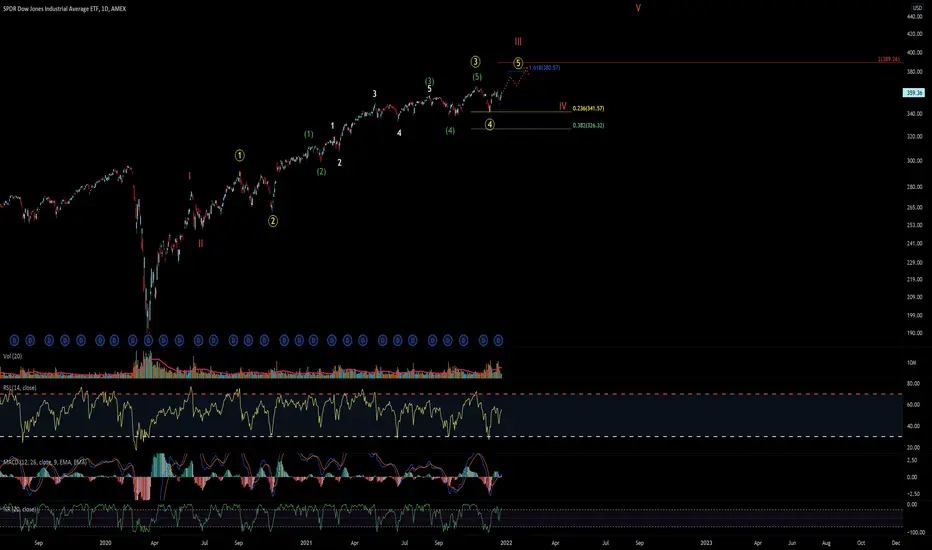
$DIA - DOW Daily Count Since covid lowDont really have a covid low DOW count out there I dont think so I whipped up what I am seeing. I think we are still working to finish off cycle wave III here - targeting 380+ overhead. Could be a couple different bear alts possible here - but I think this is most likely right now. Will put up an hourly look as well
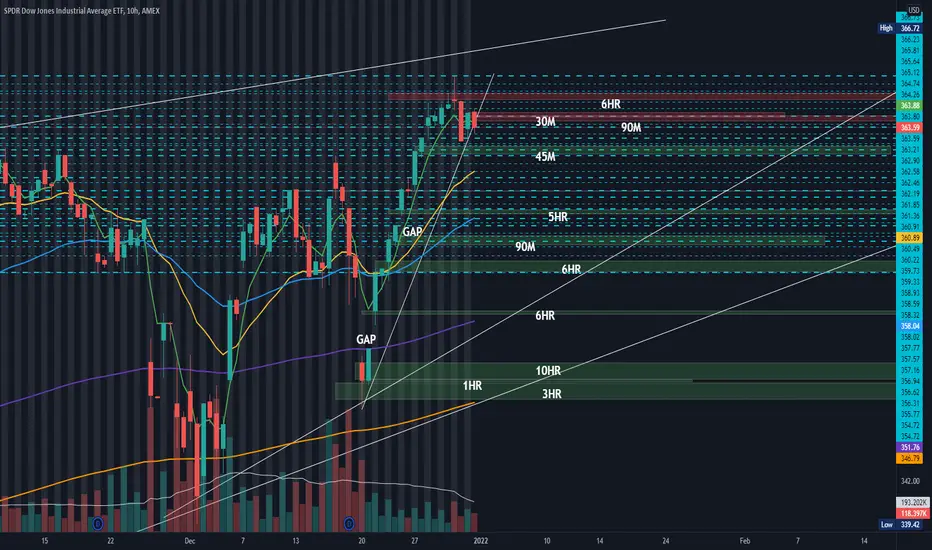
$DIA — Market Forecast 12/18/21We officially filled the gap on Friday, 12/17, because we had actually bounced off the moving average before we could fully fill it on Tuesday and Wednesday.
Gaps on equities will fill about 80% of the time, and then the markets tend to reverse 80% of the time after a gap fills.
We have gaps immediately above and below the market right now; I think that we'll see another drop with the continuation of this downside momentum before the possibility of a bounce in an attempt to fill that upside gap — I don’t think it will fill right away, but keep your eyes on it.
I have been very accurate with the market forecasts that I send to my clients every weekend, so here are my thoughts on a few of the indices...

Market index divergence last 3 daysThe past 3 days in particular have been quite divergent among the big four indexes. The past month the only spot I can see where this happened was on Nov 3rd, and it quickly ironed itself out within a day. This one is at 3 days and counting. Healthy markets shouldn't have sustained divergences like this. A day here or there, fine, but this one is worth monitoring. QQQ and SPY doing well, IWM and DIA getting spanked.

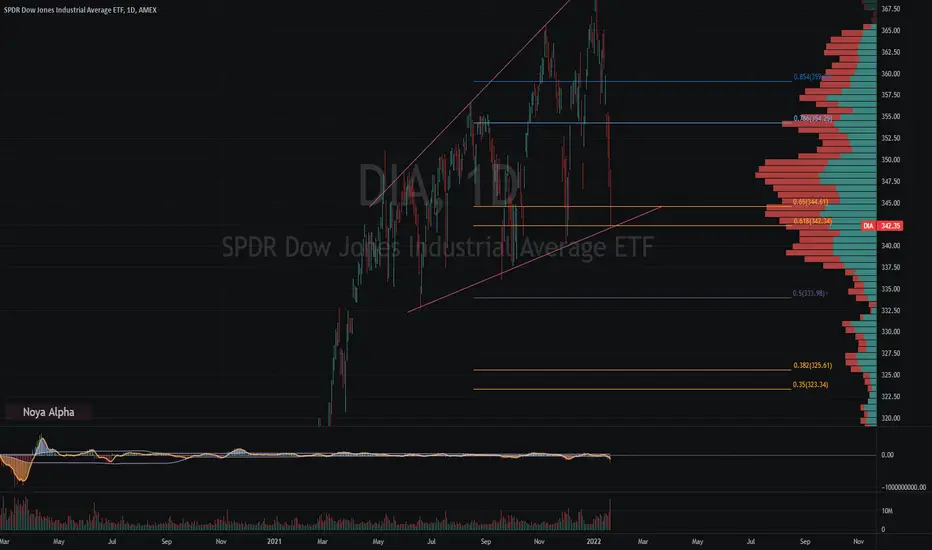
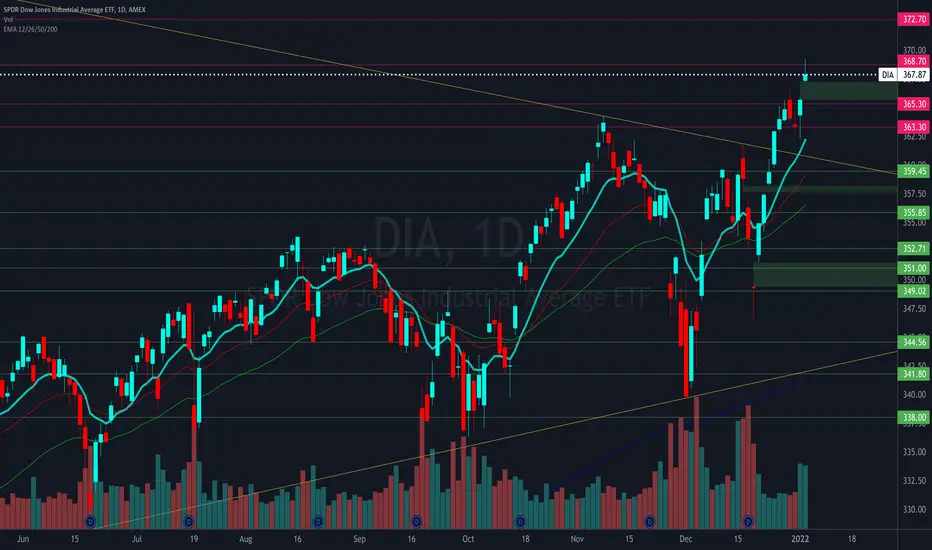
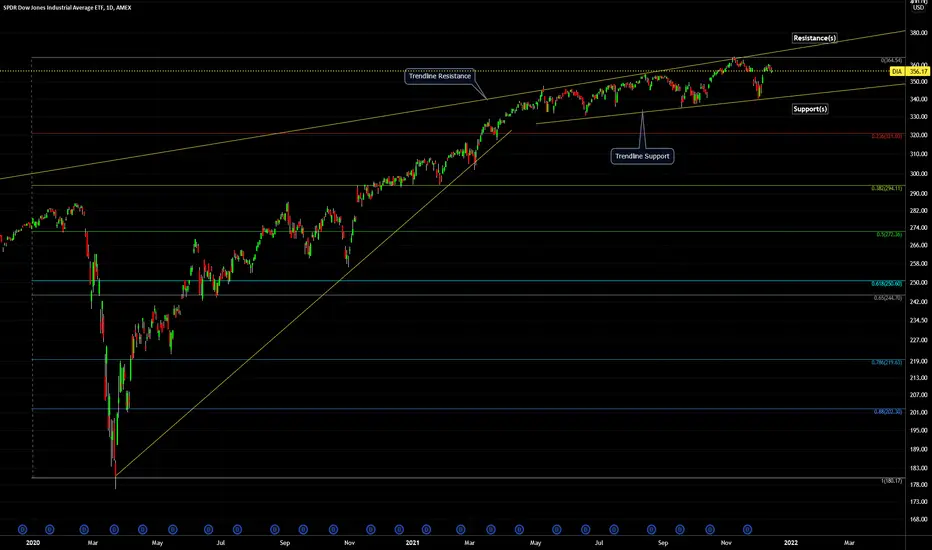
DIA (Dow Jones ETF) - Support, Resistance, Trendlines 2021 - DayDIA (Dow Jones Industrial Average ETF) - Support, Resistance, Trendlines - 2021 - Daily Chart:
-Resistance Price Levels (colored horizontal lines above current price)
-Support Price Levels (colored horizontal lines below current price)
-Trendline Resistance (diagonal yellow lines above current price)
-Trendline Support (diagonal yellow lines below current price)
note: chart is on log scale.

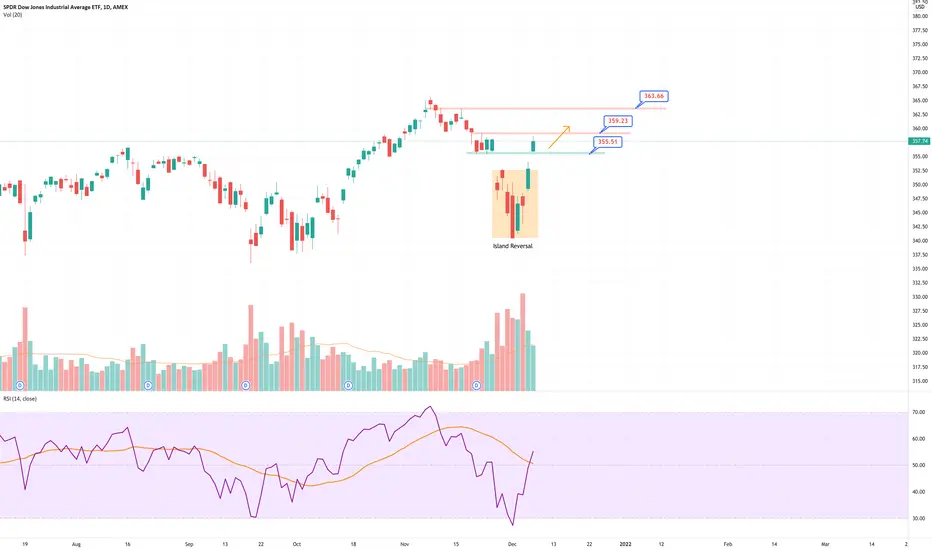
DIADIA just did an island reversal. Support at 355 and resistance at 359. A break above will take it to the ATH.
The DJIA is at Risk of Losing a KEY LevelThe DIA is at risk of losing a key level relative to QQQ performance. A decisive close below the red box could signal further underperformance.

Two trendline broken on the DIAWith the recent drop on the DIA, two uptrend lines are broken down and the only thing left to be broken is the horizontal support at around 336-338.
Once that is broken, the selling could accelerate further.

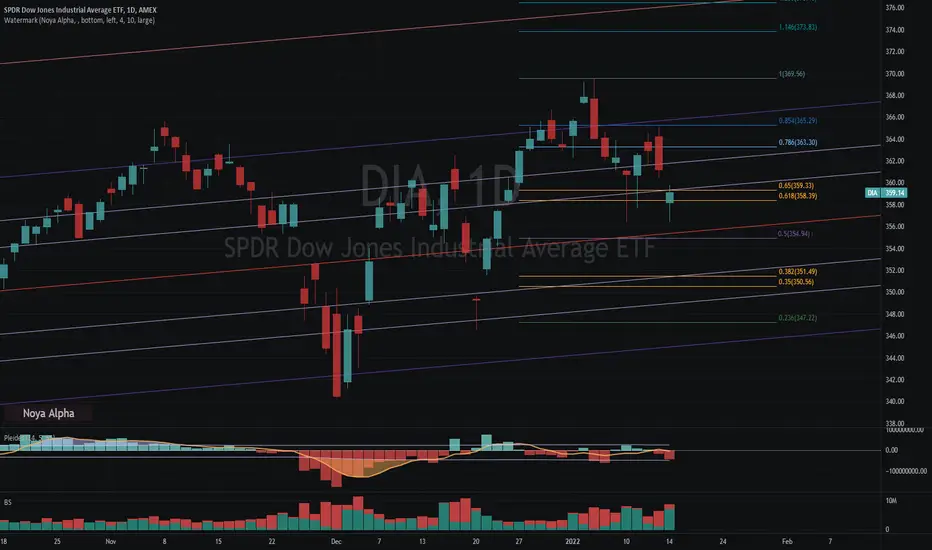
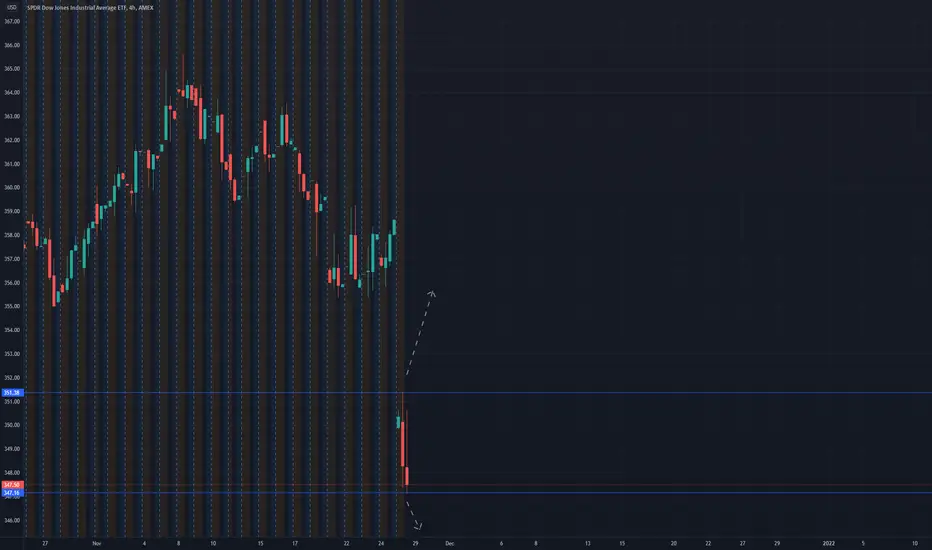
$DIA know ur levelsdont play inside days if any of the names you trade are in this,
simple game plan:
LONG BIAS on day if break above 351.50 and tests for support at/near/above that level
SHORT BIAS on day if break below 347 and test for resistance at/near/above that level
*hypothetical* correction vs black swan eventWith a run-of-the-mill correction, I believe the indices will check back to their 200-day moving averages, which for the QQQ, SPY, and DIA are 351.81 (-11.34%), 424.98 (-9.01%), and 344.41 (-5.27%) respectively.
So based on the technicals, the QQQ is the most overstretched, followed by the SPY and then the DIA. The QQQ is susceptible to higher interest rates making certain investors less attracted to the very risky assets. The TVC:US10 has been rising.
Dow Avg Div Yield: 2.23%
SPX Avg Div Yield: 2.00%.
As the 10-yr rises and surpasses 2%, the QQQ will see the worst of it, the SPY the second-worst, and the DIA the least bad.
In the case of a black swan event, god forbid China invades Taiwan, we could see something like this if they checked back to their 200-week moving averages.
QQQ to 239.11 (-39.02%)
SPY to 327.96 (-30.16%)
DIA to 280.97 (-22.71%)
In this instance it would be the same, the most richly-valued tech stocks would feel the brunt of it, the general market (represented by the S&P will take a heavy hit), and the top 30 blue-chip stocks (as decided by Dow Jones) will see something only slightly worse than a 15% correction.
*PURELY HYPOTHETICAL*
Full disclosure, I opened up small positions in SQQQ, SPXS, and SDOW.
