DRIP. Dynamic Trade on Both Falling OIL + Stock Prices DRIP Direxion's 3 X Short Oil and Natural Gas ETF
a long time favorite investment of mine,
is a dynamic way to play both falling oil and stock prices
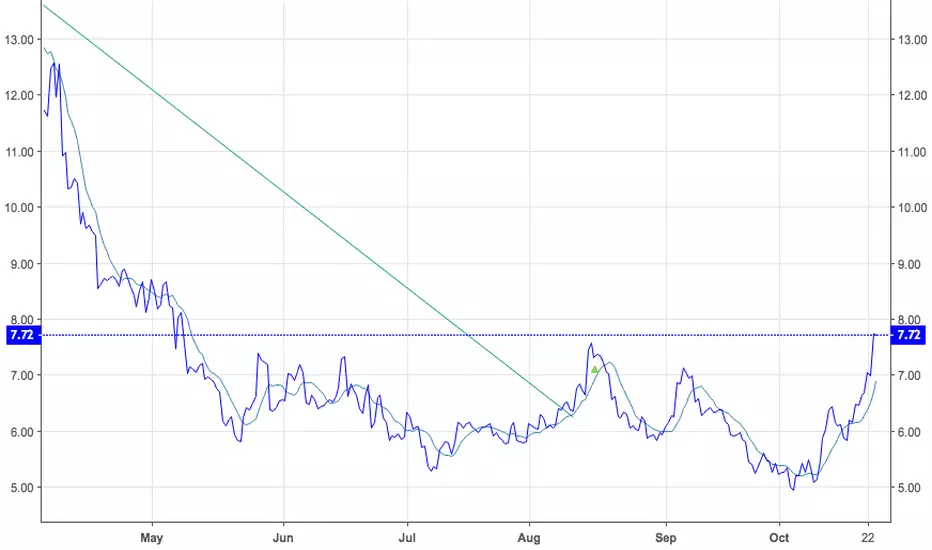
On 10/23/18, DRIP rose almost 11 %, in just one trading day !
4 Hour Chart on DRIP shows a multi month base between 5 and 8with a sharp move up in the last month.
This h ETF often LEADS ...price movements in crude + stocks,
and is traded by some of the best traders out there, so you can also use it to measure divergences.
Note: A breakout and close above 8.65 in DRIP would be a POWERFUL BUY SIGNAL
and would immediately project the ETF to a 30 % potential move up to 12.50 !
THE_UNWIND
10/24/18 745 AM New York
DRIP trade ideas
DRIP own IdeaI believe this stock will move like this because it have a consecutive pattern. Have a nice support right now and a bouncing point at 4.95. Candles creating higher highs and high lows (Bullish). Do your own DD and create your own plan of entry and exit.
Inverted hammer possible test of 6+DRIP is an inverse leveraged etf based on SPSIOP which formed a shooting star on the daily and weekly chart at prior resistance. Position anticipates a pull back on SPSIOP from rejected highs on weekly and daily to support above 6200. Averaged long entry is 5.38 stop loss at today's low of 5.24 higher opening next week in DUST will confirm pullback to support for SPSIOP
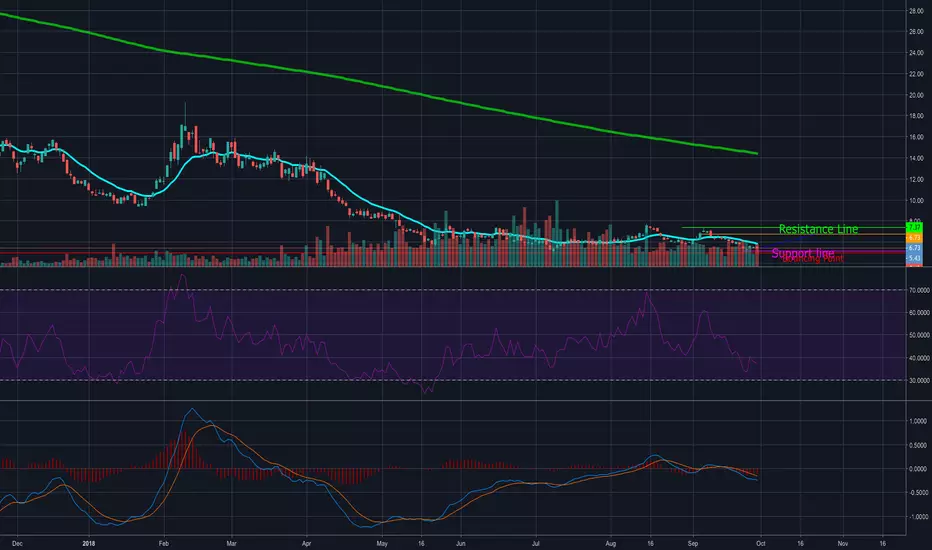
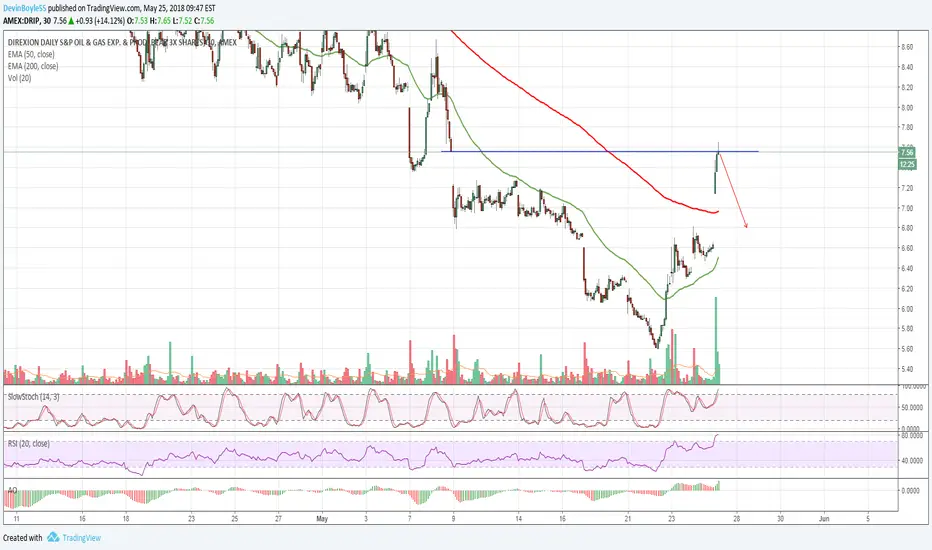
DRIP Triple Bear OIL ETF BUY ! BREAKS OUT LONG BASE DRIP Direxion's 3X BEAR ETF on S+P Oil and Gas Exploration Index
broke out of a multi week 4 Hour BASE PATTERN on 8/15, rising 14 % to Cl. 7.56
Price rise out of the Base in DRIP means that Crude Oil has, at the minimum.
put in a price high near $75 in near term futures this summer, and the path of least resistance now may be to the downside.
THE_UNWIND

Quick 5% gain on DRIP www.tradelikeagenius.comWe normally like to short the ultras but perfect setup for our signal and we took it. Now out 5.51, from 5.26 One day trade. Our signal looks at our Prop moneyflow signal

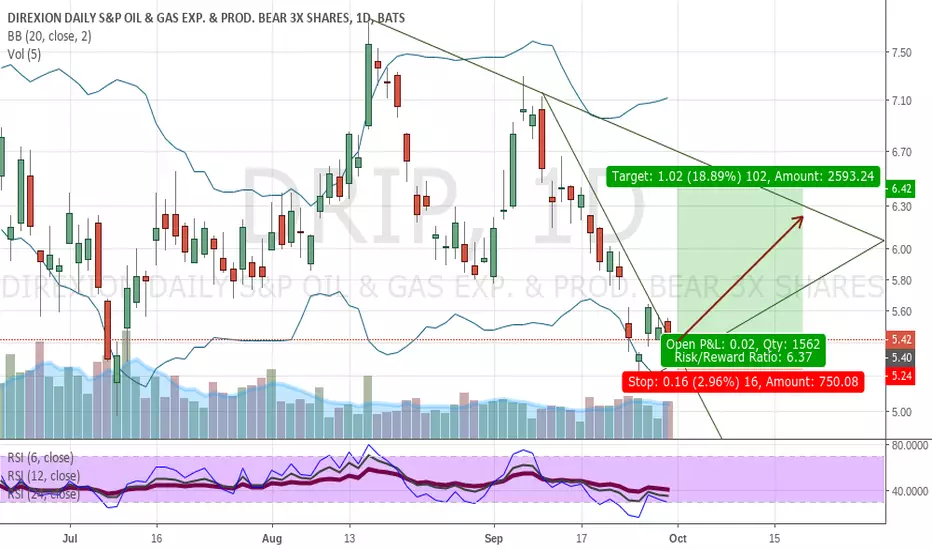
Triangle and declining volume. On the watchlist to break the triangle. I am leaning towards the contination of downtrend.
$DRIP Overbought at Resistance$DRIP Overbought at Resistance - 7.55 level looking like strong resistance and expecting it to hold.
Oil & Gas ShortThis morning had a sharp fall in Oil price. I expect Oil's ICL drop to continue here. I missed the short from early February.
Bought DRIP 14.7, hard stop 13.7.
Looking for Oil to make a lower low below $60, then we'll see.


SHORT of OIL along trend $DRIPOil has been falling for about two months and I found a good opportunity to buy into the trend on a slight reversal on the 13th

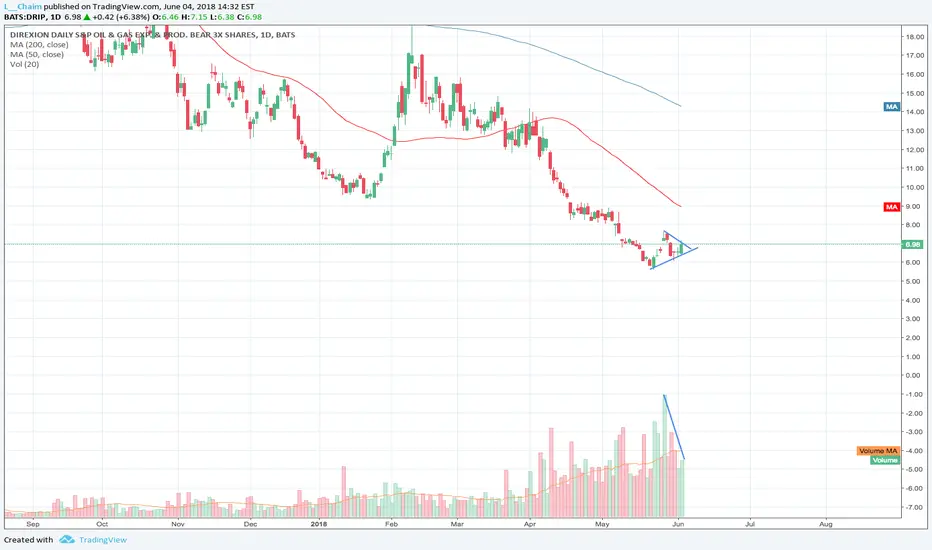
DRIP Head and ShouldersPossible head and shoulders
Broke out at the bottom, but came back into the trend line.


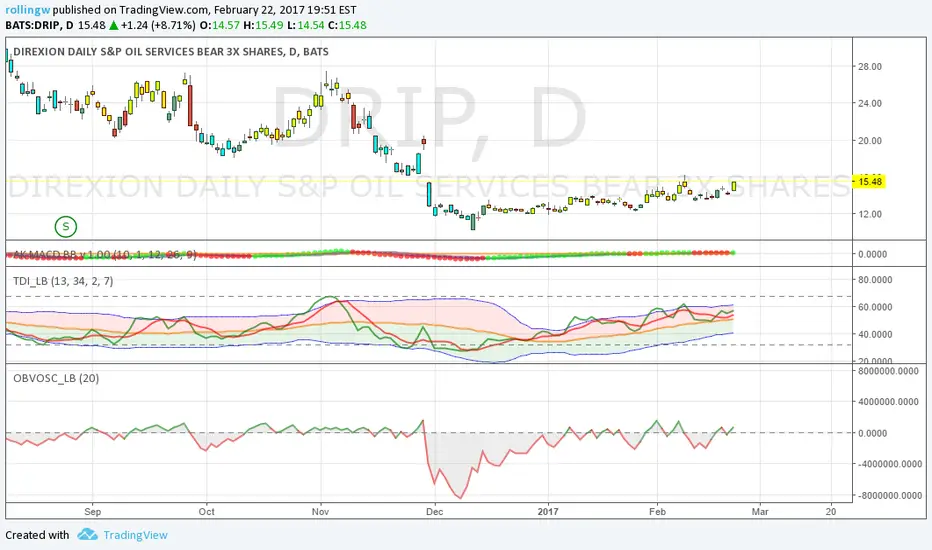
DRIP BEAR***This analysis is HEAVILY dependent on future macroeconomics and geopolitics and public statements, it could prove to be ENTIRELY wrong an hour from now based on what oil minister or nation X or Y says or does in an interview/meeting, etc.***
That being said, the technicals indicate to me that DRIP is going lower.
First, we have the head and shoulders (shown by the vertical red lines, the right shoulder is marked by a symmetrical triangle). This formation is incomplete, as we expect to see a very slight rebound in many of these cases - but volume MACD and RSI all support it.
Second, we can note the triangle coming off the right shoulder. While the majority (66-75%) of these will indicate continuation of a trend (in this case the trend was upward prior to the triangle) the remainder indicate reversals. We have clearly breached the triangle downward, which further supports the notion that DRIP will decline. Volume declines during the triangle and then spikes (massively) as the price breaches it. The breach occurs approximately where we would expect it to - 50-75% through.
That breach also declines through the support levels established at approx. 83 (highest pink horizontal line).
From this point on, the next strongest level of intermediate support is likely to be at about 46.86, where the fund traded from October through December.
Again, there may be a short term rebound before the head and shoulders is confirmed.
