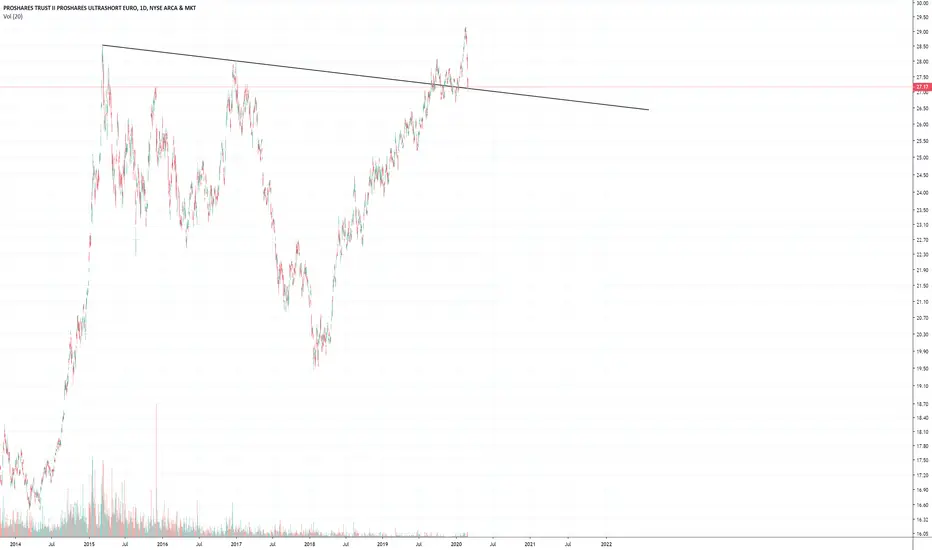
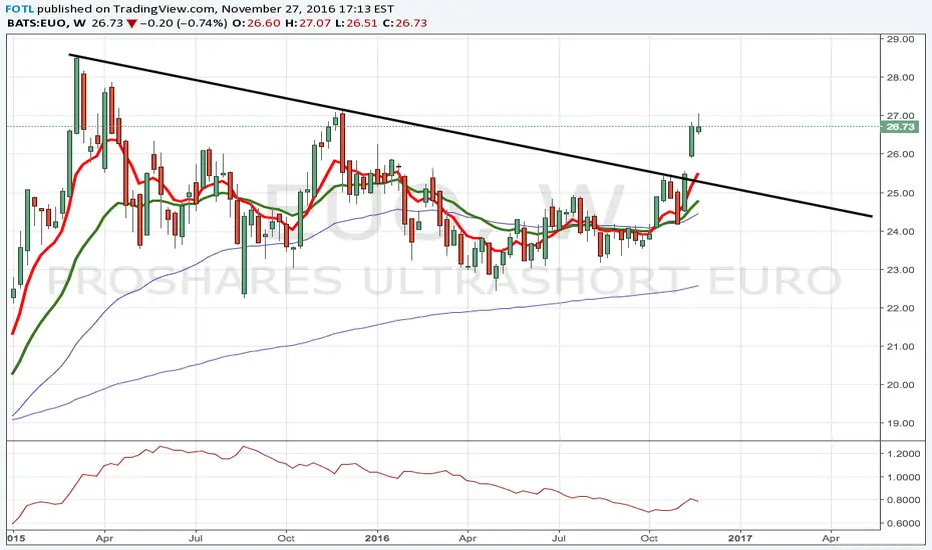
Long USD / Short EuroThe DXY has been super strong lately and lots of folks are wondering where the final target is.
One way to do this, is to view a leveraged currency ETF to try and identify patterns. The ETF leverage amplifies the movements you might otherwise of missed.
Classic Inverse Head & Shoulders on EUO. EU
Key stats
About ProShares UltraShort Euro
Home page
Inception date
Nov 25, 2008
Structure
Commodities Pool
Replication method
Synthetic
Dividend treatment
Distributes
Distribution tax treatment
No distributions
Income tax type
60/40
Max ST capital gains rate
27.84%
Max LT capital gains rate
27.84%
Primary advisor
ProShare Advisors LLC
Distributor
SEI Investments Distribution Co.
EUO provides inverse 2x daily exposure to the USD/EUR cross. Due to its daily rebalance, the effects of compounding and path dependency weigh in on the long-term returns of the fund, which means that investors holding the fund longer than a day may not attain -200% exposure. As a result, EUO may not be suitable for those looking for predictable, long-term returns. Also keep in mind that EUO references the EUR/USD cross rate as reported by Bloomberg at 4 pm ET.
Related funds
Classification
Symbol
Geography
Eurozone
What's in the fund
Exposure type
Cash
Bonds, Cash & Other100.00%
Cash100.00%
Top 10 holdings


Summarizing what the indicators are suggesting.
Oscillators
Neutral
SellBuy
Strong sellStrong buy
Strong sellSellNeutralBuyStrong buy
Oscillators
Neutral
SellBuy
Strong sellStrong buy
Strong sellSellNeutralBuyStrong buy
Summary
Neutral
SellBuy
Strong sellStrong buy
Strong sellSellNeutralBuyStrong buy
Summary
Neutral
SellBuy
Strong sellStrong buy
Strong sellSellNeutralBuyStrong buy
Summary
Neutral
SellBuy
Strong sellStrong buy
Strong sellSellNeutralBuyStrong buy
Moving Averages
Neutral
SellBuy
Strong sellStrong buy
Strong sellSellNeutralBuyStrong buy
Moving Averages
Neutral
SellBuy
Strong sellStrong buy
Strong sellSellNeutralBuyStrong buy
Displays a symbol's price movements over previous years to identify recurring trends.
Frequently Asked Questions
An exchange-traded fund (ETF) is a collection of assets (stocks, bonds, commodities, etc.) that track an underlying index and can be bought on an exchange like individual stocks.
EUO trades at 27.38 USD today, its price has fallen −0.08% in the past 24 hours. Track more dynamics on EUO price chart.
EUO net asset value is 27.40 today — it's fallen 5.34% over the past month. NAV represents the total value of the fund's assets less liabilities and serves as a gauge of the fund's performance.
EUO assets under management is 31.57 M USD. AUM is an important metric as it reflects the fund's size and can serve as a gauge of how successful the fund is in attracting investors, which, in its turn, can influence decision-making.
EUO price has fallen by −6.04% over the last month, and its yearly performance shows a −13.60% decrease. See more dynamics on EUO price chart.
NAV returns, another gauge of an ETF dynamics, have fallen by −5.34% over the last month, showed a −15.56% decrease in three-month performance and has decreased by −14.00% in a year.
NAV returns, another gauge of an ETF dynamics, have fallen by −5.34% over the last month, showed a −15.56% decrease in three-month performance and has decreased by −14.00% in a year.
EUO fund flows account for −1.98 M USD (1 year). Many traders use this metric to get insight into investors' sentiment and evaluate whether it's time to buy or sell the fund.
Since ETFs work like an individual stock, they can be bought and sold on exchanges (e.g. NASDAQ, NYSE, EURONEXT). As it happens with stocks, you need to select a brokerage to access trading. Explore our list of available brokers to find the one to help execute your strategies. Don't forget to do your research before getting to trading. Explore ETFs metrics in our ETF screener to find a reliable opportunity.
EUO invests in cash. See more details in our Analysis section.
EUO expense ratio is 0.95%. It's an important metric for helping traders understand the fund's operating costs relative to assets and how expensive it would be to hold the fund.
Yes, EUO is a leveraged ETF, meaning it uses borrowings or financial derivatives to magnify the performance of the underlying assets or index it follows.
In some ways, ETFs are safe investments, but in a broader sense, they're not safer than any other asset, so it's crucial to analyze a fund before investing. But if your research gives a vague answer, you can always refer to technical analysis.
Today, EUO technical analysis shows the sell rating and its 1-week rating is strong sell. Since market conditions are prone to changes, it's worth looking a bit further into the future — according to the 1-month rating EUO shows the sell signal. See more of EUO technicals for a more comprehensive analysis.
Today, EUO technical analysis shows the sell rating and its 1-week rating is strong sell. Since market conditions are prone to changes, it's worth looking a bit further into the future — according to the 1-month rating EUO shows the sell signal. See more of EUO technicals for a more comprehensive analysis.
No, EUO doesn't pay dividends to its holders.
EUO trades at a premium (0.02%).
Premium/discount to NAV expresses the difference between the ETF’s price and its NAV value. A positive percentage indicates a premium, meaning the ETF trades at a higher price than the calculated NAV. Conversely, a negative percentage indicates a discount, suggesting the ETF trades at a lower price than NAV.
Premium/discount to NAV expresses the difference between the ETF’s price and its NAV value. A positive percentage indicates a premium, meaning the ETF trades at a higher price than the calculated NAV. Conversely, a negative percentage indicates a discount, suggesting the ETF trades at a lower price than NAV.
EUO shares are issued by ProShare Advisors LLC
EUO follows the USD/EUR Exchange Rate. ETFs usually track some benchmark seeking to replicate its performance and guide asset selection and objectives.
The fund started trading on Nov 25, 2008.
The fund's management style is passive, meaning it's aiming to replicate the performance of the underlying index by holding assets in the same proportions as the index. The goal is to match the index's returns.