FNGU trade ideas

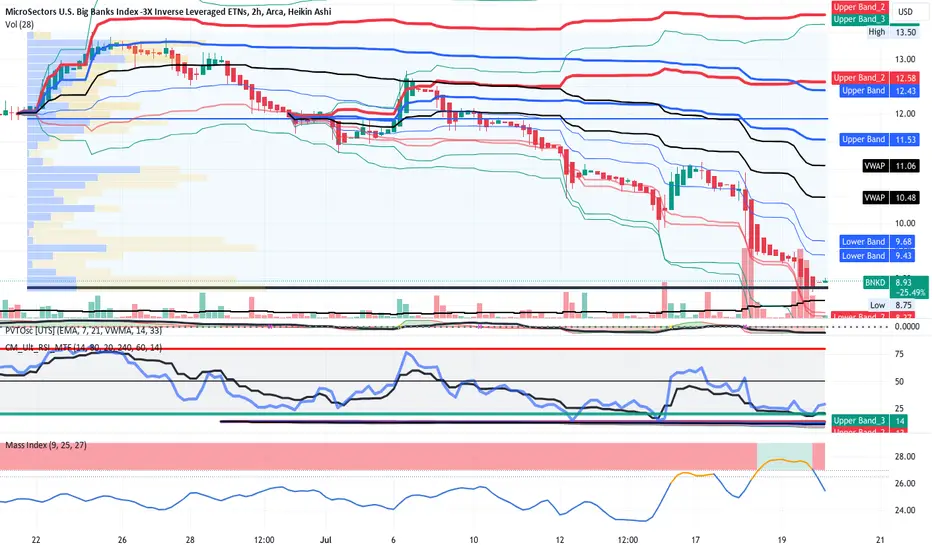
BNKU- Triple Leveraged Bank Sector LONGOn the hourly chart, BNKU fell from a head and shoulders in late July , crossed
under VWAP lines in a VWAP breakdown and pullback before an inverse head and shoulders
type reversal now underway. The zero-lag MACD is confirmatory. I will take a long
trade here. Projected stop loss and targets ( TP1-40% TP2 40% and T3 20%) are on the
chart. I see this as a very safe trade with an estimated 12% overall profit expected.
I am in a WFC trade and looking at ETFs DPST and KRE as well

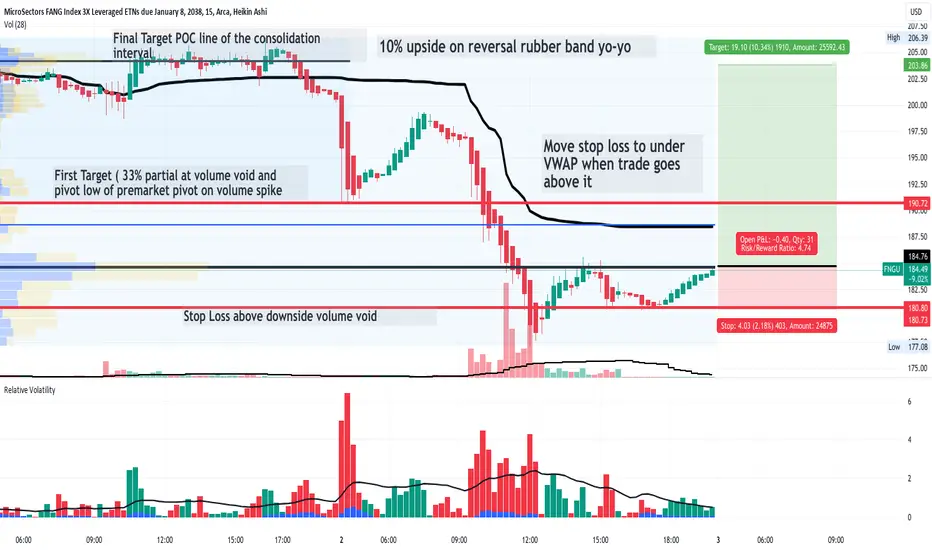
FNGU- the leaders of the pack will come back first LONGFNGU is triple leveraged ETF of the titans of the NASDAQ; I expect it to come back front
of volatility in the market quickly as its constituents are the leaders here. I hope to exploit this
for 10% before COB for the trading week in the next two days.. A volume profile and mean
anchored VWAP using metrics employed by institutions and those executing with blocks
of voume. Analysis and target levels are on the chart for pureposeful brevity. Trade on !
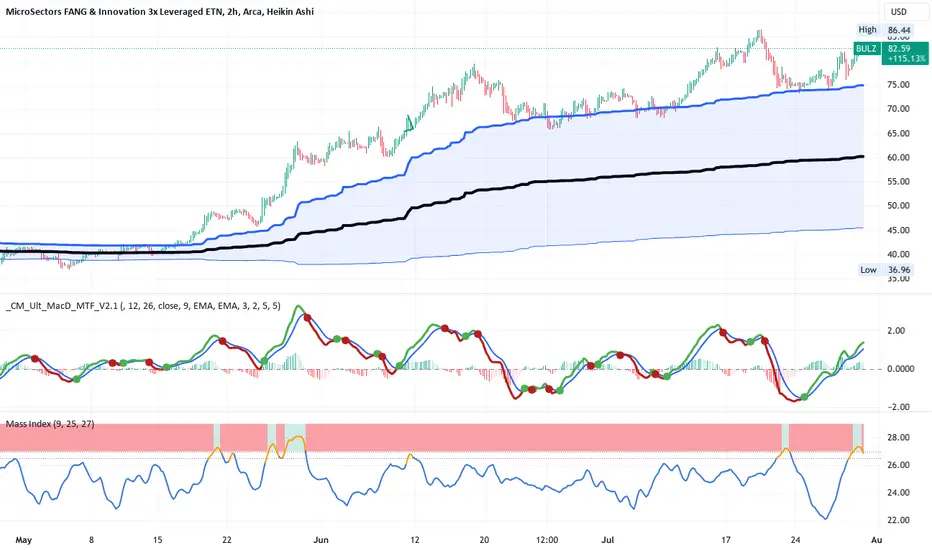
BULZ - Technology ETF ( AI revolution )LONGBULZ is a 3X leveraged version of the Cathie Wood ETFs. As shows on the
2H chart BULZ broke out of the fair value channel of the anchored VWAP bands
in bullish momentum Not a coincidence. In three months it has gained over 110%
or 35% per month compounded. The MACD indicator shows the lines peaking over
the histogram a cross of them is pending. The mass index indicator shows a signal
into the reversal zone and falling as if about to trigger. This is a VWAP breakout
at its best. It jumped 7 % in one day and now needs a pullback reset.
My trading plan is simple. I will watch for a pullback to the blue line one standard
deviation above the mean VWAP. I expect a bounce off that dynamic support. The trade
will be a long-duration one until the technology sector cools off. Any future pullbacks to
the blue VWAP will have an incremental add to the position. Any pops in price over the second
VWAP line above the mean ( a line not visible here) will be used to signal a sell of a portion
of the position. All in all, this will compound realized profits while underway.
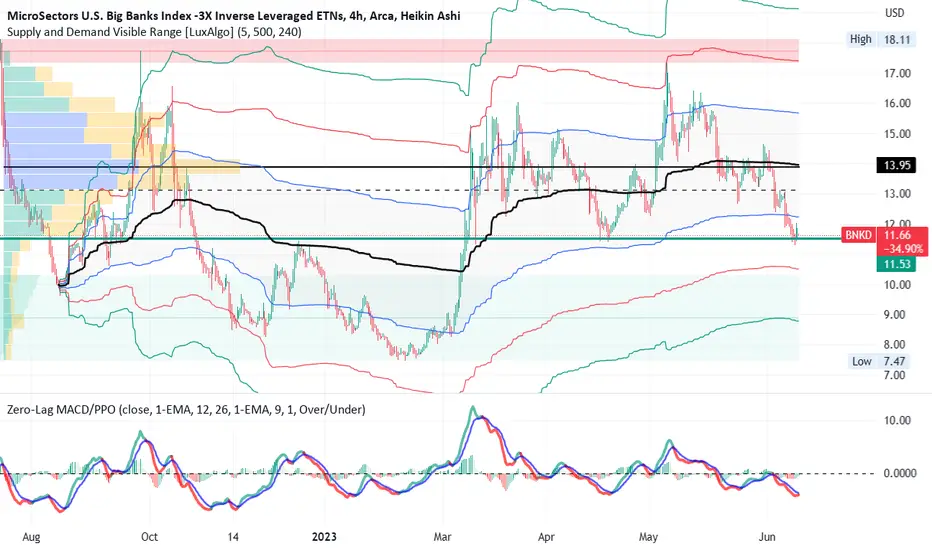
BNKD Is the banking crisis still simmering?Recently, a report posted on the Social Science Research Network found that 186 banks in the
United States are at risk of failure or collapse due to rising interest rates and a high proportion
of uninsured deposits.Jun 14, 2023
BNKD, the banking bearish and leveraged ETF has dropped in trend down in the past month
albeit with some upgoing corrections along the way. GS, JPM and MS are all uptrending as an
with DPST high jumping in the past day. On the 2H chart, BNKD is in deep oversold
undervalued territory at or below more than two standard deviations below the mean VWAP.
However:
(1) the mass index indicator popped into the reversal zone and then dropped below the trigger
level of 26.5. I see this as a mathematical prediction of a soon impending reversal.
(2) the dual time frame RSI shows the lower TF blue line bounced from the lows and the higher
TF is flat not showing further weakness. I consider this a subtle bullish divergence.
(3) Importantly the red line in the sand here is the POC line of the visible range volume profile.
Price is presently supported by that line showing buyers taking a defensive stand at that level.
Overall, I will take a long reversal trade here targeting the middle of the first upper deviation
band at 12.0 with a stop loss at 8.88. This is a high potential reward of 35% for a small risk
taken. The reward on an options trade would potentially be well over 100%. I will zoom into
a 15-30 minute time frame to select a pivot low to make a more precise entry.
OILU an ETF for OIL - Leveraged and LongOILU is a risky high volatility ETF on oil exploration and production. Where there are risk
and volatility there can also be plentiful profits. On the 4H chart,OILU can be seen breaking
up through long-term anchored VWAP bands in a trend that began in mid-May. Price is
now approaching the mean VWAP lines. The POC line validates those VWAP lines coming in
at nearly an identical price level. On the MACD, negative amplitudes have gradually decreased
in a fashion consistent with bullish divergence. The RSI indicator shows the MTF RSIs to be
in mid-range suitable for taking an entry without evidence of oversold or overbought
parameters. Fundamentally, a variety of factors including
OPEC the re-emergence of the Chinese economy, Russia's war fear of a recession causing a
decrease in demand for oil all have contributed to a mixed picture. The chart is suggesting
a long trade to me and so I will take up the suggestion. I will set a stop loss at the recent
pivot low of $32 while targeting the highest VWAP band at $47. I will raise the stop loss
to break-even when price hits $38 while respecting the ATR and volatility. I see this as
a safe trade with a potential upside of about 33%

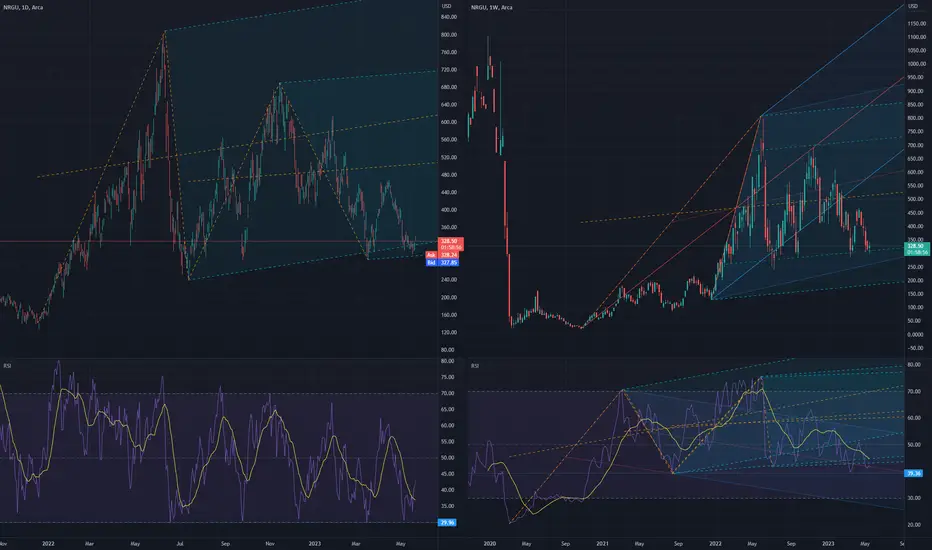
NRGD - bullishNRGD price reached a support level and its RSI reached a support ptichfork line. Expecting it to go up tomorrow.

bullish NRGU (OIL) based on pitchfork analysisNRGU reached support pitchfork lines both on daily and weekly and is likely to bounce up.
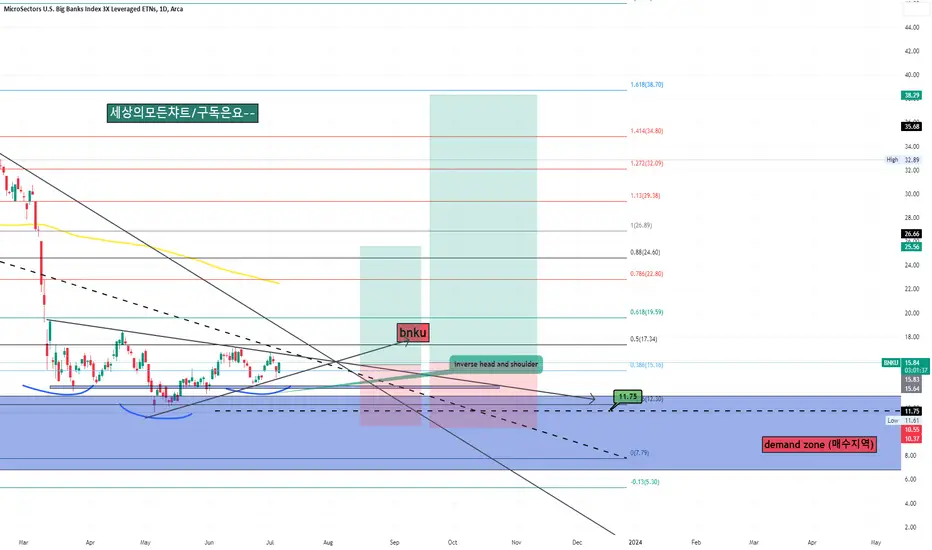
BNKU long entry setup
1.TA with trend line
2. 2 scenario is different tp
3. good apportunity to long
4. inverse head and shoulder is still vailid ( good support )
5 and good luckyyyyy to u
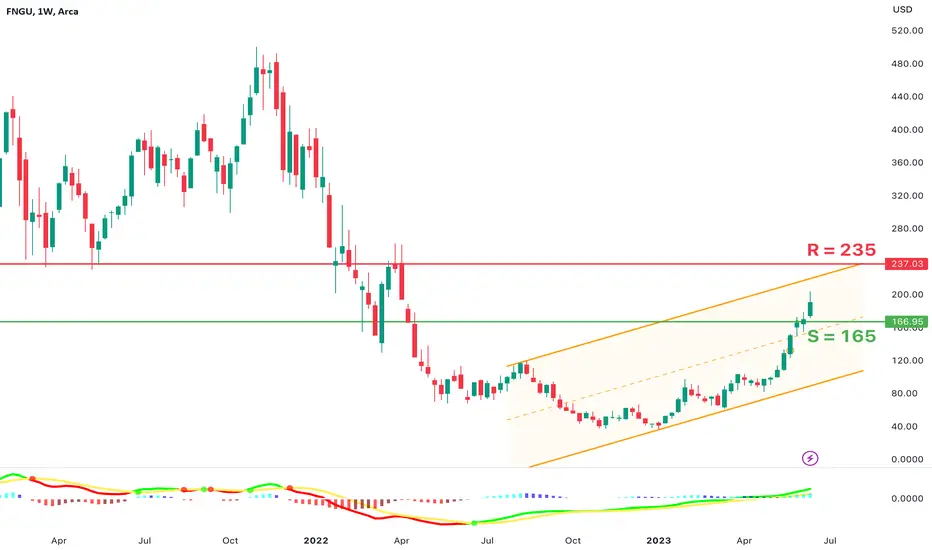
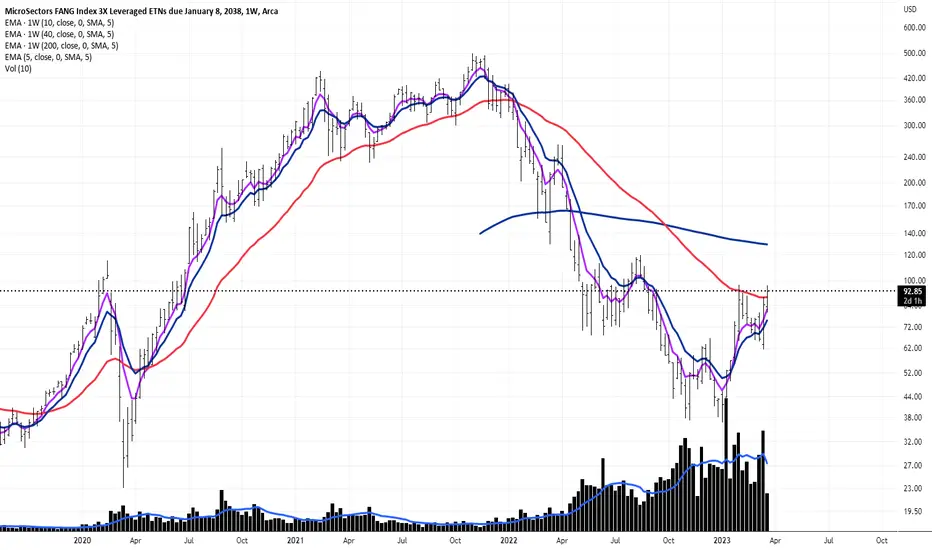
$FNGU - Weekly (Going Strong!)This is my all time favorite ETF, AMEX:FNGU with is 3x of some of the ten strongest companies in the U.S. We are in a beautiful upward trend and even though a pull back may be coming (we see 8 consecutive green weeks), I still think AMEX:FNGU is an excellent deal. R at 235 and S at 165.
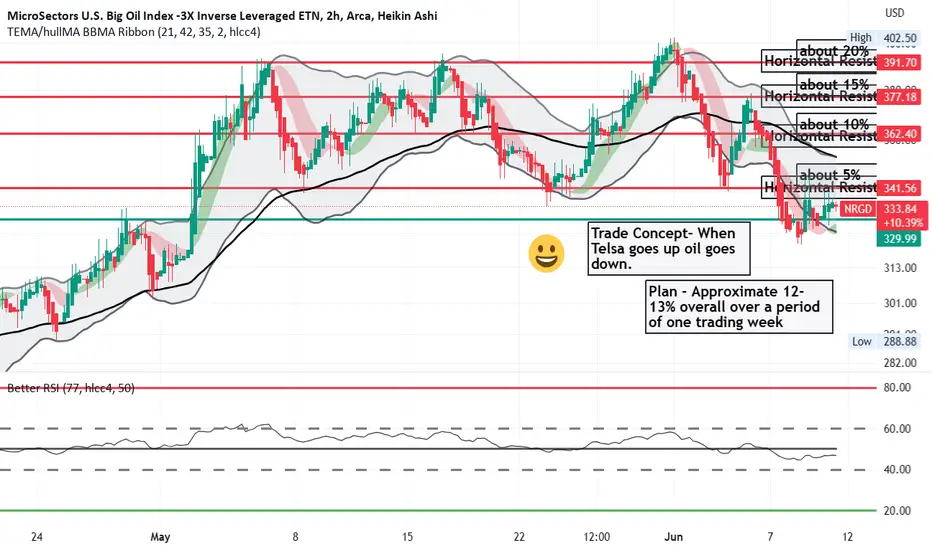
NRGD a 3X Leveraged ETF that shorts oilNRGD goes up when oil goes down; this ETF tracks the oil futures ; it is leveraged and managed.
Here on the one-hour chart with an Bollinger Bands and EMA bands indicator added, it can be
seen that price had been trending down in two waves beginning June 1st , Upon dropping
outside the BB lower line, price reversed upward to reach the upper BB line and reversed again.
Finally, price dropped outside the BB lower line and reversed this past Thursday. The RSI
oscillator has recently trended between 65 and 40, suggesting healthy price action without
and oversold or overbought conditions. As it is now trending up again. I see it as suitable for a l
long trade. I have plotted horizontal resistance lines in order to plan a tiered exit from a trade
of 4 shares where I will partially close the position by selling a share each time price reaches
one of those lines. At the same time, I will move the stop loss up to midway between its l
location and that line. I will repeat this until all shares are sold. I am expecting a 12% profit
overall for a week-long trade. This will be a free trade without risk after the first move of the
stop loss to above the entry point. If the RSI remains below 80, I may let the last share run
until I am alerted that price has hit the BB upper line by an alert or alternatively set up
a trailing stop loss of 2%.
Is it time to short the big banks with BNKD again?As shown on the 4H chart BNKD, a triple leveraged ETF inverse to big bank stocks has had
ups and downs reflecting the chaos in the banking system with some failures and federal support
or takeovers. Online banks are thriving while some smaller regional banks are challenged with
a portfolio of bonds and treasuries bearing low yields. Price is presently at the same level
as the high of December 22 and low of April 23. This level is acting as support also allowing for
a narrow stop loss for a long trade. Price is below the high volume area of the long term
volume profile which equates to the fair value area. Accordingly, BNKD is oversold and
discounted below fair value into the undervalued range. It is below the mean anchored VWAP
line and in the area of one standard deviation below that line. The zero-lag MACD shows an
early impending cross of the lines under the histogram another suggestion of a reversal
I will take a long trade with the stop loss directly below the horizontal support line by
$ 0.25 while the first target just below the confluence of the POC line and the mean VWAP
@ $.13.90 while the final target is $ 15.60 near the top of the high volume area. I see this
as a safe long trade with a high R:R and profit potential.
$FNGU Weekly - Hits Our Price Target (and some) Yeah!Love when we draw charts and candles move beautifully in that direction. We spotted the Cup and Handle Formation in early May and set a price target of 156. I didn't think it would come this soon but glad that it did, with AMEX:FNGU hitting a high of 163 premarket yesterday (Tuesday May 30) before pulling back. Still a strong stock overall but think you can wait to get in at a better deal if you like.

BULZ- a 3X leveraged FANG ETF High Tight Bull FlagBULZ on the one hour chart is showing a high tight bull flag which typically heralds a bullish
continuation. The tight consolidation channel formed today at the POC line of the volume
profile. The zero-lag MACD shows the lines under the histogram and about to cross. The
histogram itself has dropped to a zero amplitude. The trigger for the bullish continuation is
price rises out of the regression channel and above the POC line. BULZ is a triple leveraged
ETF holding the FANG stocks including META, GOOG, AAPL, NVDA and all the others. BULZ
could spend another day consolidated and then run the remainder of the week. The 17% run
thus far could be repeated in the days to come mightful however of the leveraging.
I see this pullback as a great entry into a stock pattern that typically results in a resurgence
of bullish momentum. I have pasted onto the chart a little bit of a description of the
high tight bull flag patterns and their utility in trading when found.

$FNGU - WeeklyPotential Cup and Handle formation in AMEX:FNGU Weekly charts, with price target at 156.

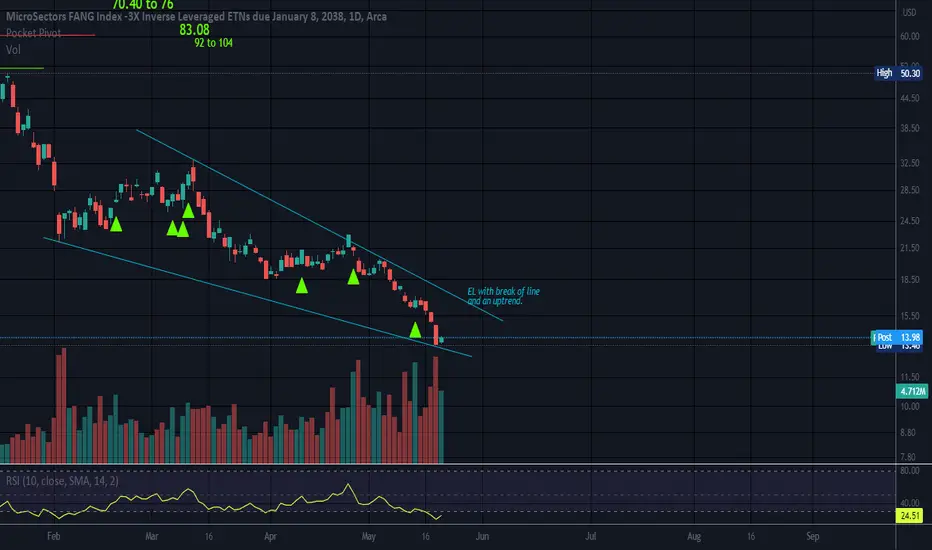
Bottom FishingAt an all time low. Leveraged x3 so can be very volatile. This ETF SHORTS the FANG stocks. Not an ETF to fool around with or stay too long as it consists of some very strong momentum stocks. Top ten holdings below.
Falling Wedge noted. Both lines slope down and converge at the apex.
Falling wedges are usually found at the bottom or after a severe pullback.
They are bullish if the top line is broken with a confirmed upward trend. Some would use 2 closes as confirmation but we are all different and so is each security.
No recommendation.
“The function of economic forecasting is to make astrology look respectable.”
John Kenneth Galbraith
Top 10 Holdings
Meta Platforms Inc Class A
12.53%
Tesla Inc
11.71%
NVIDIA Corp
10.66%
Advanced Micro Devices Inc
10.03%
Netflix Inc
9.65%
Apple Inc
9.39%
Amazon.com Inc
9.35%
Snowflake Inc Ordinary Shares - Class A
9.10%
Microsoft Corp
8.84%
Alphabet Inc Class A
The note seeks to track -3x of the daily performance of the NYSE FANG+ Index, total return. The index comprises of public equity markets of the United States. It takes short positions and uses derivatives to include the stocks of companies operating in the technology and consumer discretionary sectors. The index comprises of growth stocks of companies across diversified market capitalizations. The ETN will mature on January 8, 2038. MicroSectors FANG+ Index -3X Inverse Leveraged ETNs due January 8, 2038 was formed on January 22, 2018 and is domiciled in the United States.
The investment seeks return linked to a three times inverse leveraged participation in the daily performance of the NYSE Fang+™ Index, total return (the “index”). The notes are intended to be daily trading tools for sophisticated investors to manage daily trading risks as part of an overall diversified portfolio. The index is an equal-dollar weighted index designed to represent a segment of the technology and consumer discretionary sectors consisting of highly-traded growth stocks of technology and tech-enabled companies. Benchmark: NYSE FANG+ TR USD
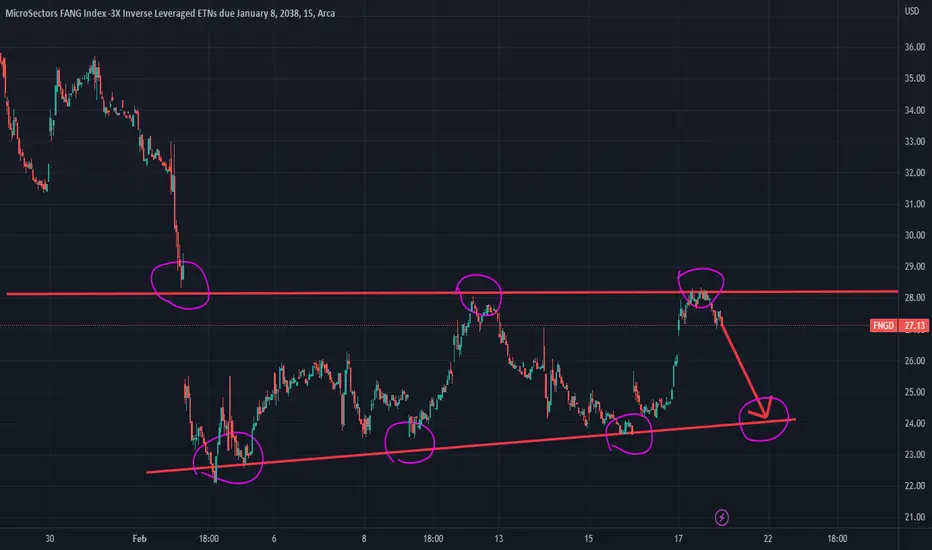
FNGD possible 47.5Possible. Could happen, good opp to take trade.
I will sell after 4 weeks or 8 depending breadth
soxs too
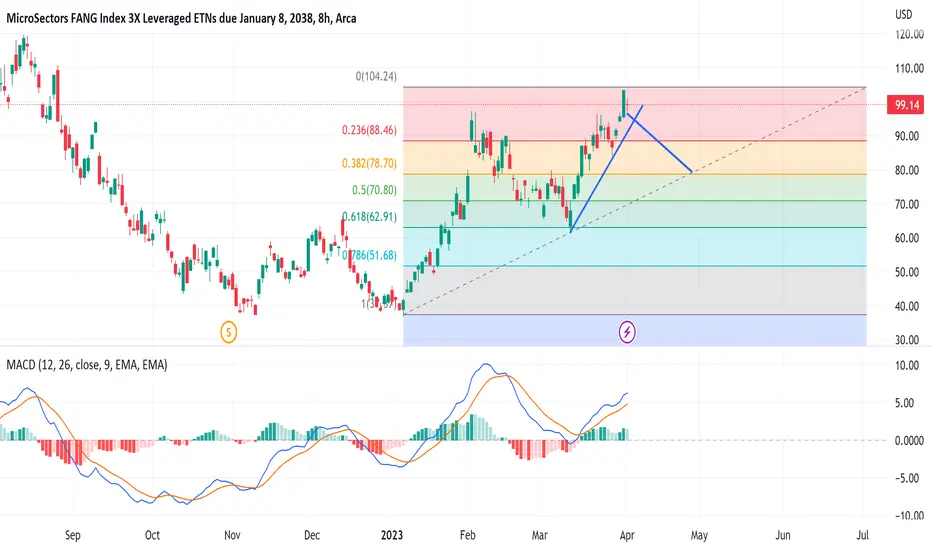
FNGU Retracement for first half of AprilGreat run up so far, looks like there should be a healthy pullback this week. Look out for the $94-95 Level for support. Stop Loss around $93, if FNGU gets below that it could retrace all the way to $80 which is another good buy zone. I'm long on this stock and not looking to invest in its inverse (FNGD) unless FNGU drops below $93
Not financial advice
buy heregood setup, exhaustion candle, bottom of range, could actually double. LABD did 50% from this type of setup, so shorts are working
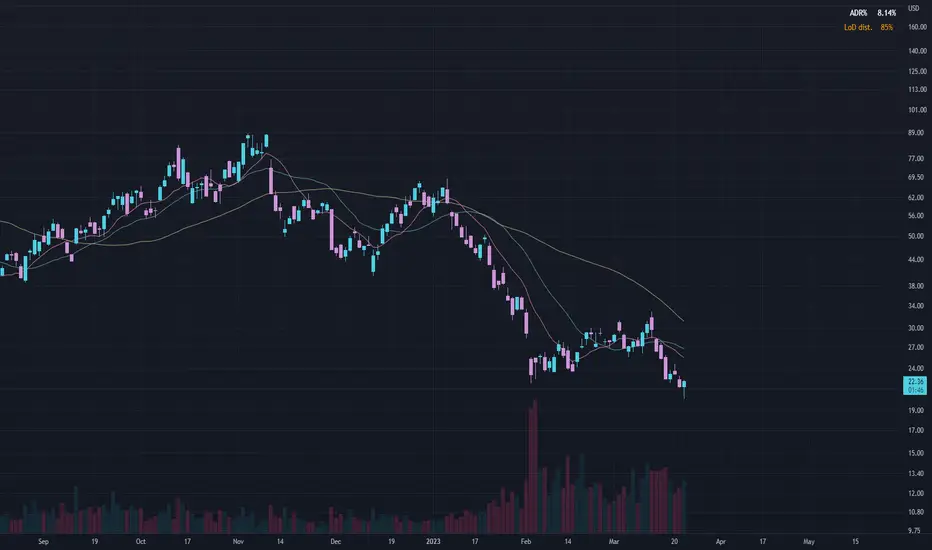
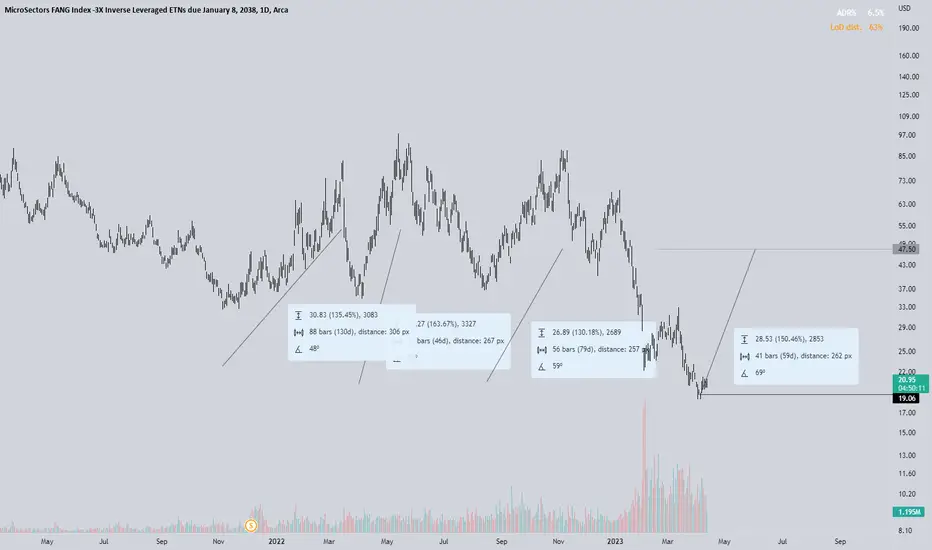
FNGU a possible play on long-term reversal in tech sectorTechnical: The fund looks to be bottoming following the collapse of 2022. The weekly chart is strong with volume coming with upside move.
Fundamental:
The Bank of Montreal MicroSectors FANG Index 3X Leveraged ETN (FNGU) is an exchange-traded note that seeks to provide 3 times the daily leveraged return of the NYSE FANG+ Index, which consists of 10 highly traded technology and internet-related stocks. There are several reasons to be bullish on FNGU as an investment opportunity.
The technology sector is a rapidly growing industry that has shown resilience and stability, even during economic downturns. The NYSE FANG+ Index, which FNGU seeks to replicate, is composed of 10 highly traded technology and internet-related stocks, including Facebook, Amazon, Apple, Netflix, and Alphabet (Google). These companies have a strong track record of growth and innovation, and are expected to continue to perform well in the future.
FNGU provides investors with an opportunity to gain leveraged exposure to the NYSE FANG+ Index. This means that investors can potentially benefit from amplified gains in the event that the underlying index performs well. While leverage also amplifies potential losses, the use of a 3X leveraged ETN can provide investors with a potentially significant return on investment. It is structured as an exchange-traded note (ETN), which provides investors with several advantages over traditional investment vehicles. For example, ETNs can be bought and sold on an exchange like a stock, which makes them highly liquid and easy to trade. Furthermore, ETNs are typically more tax-efficient than other investment vehicles, as they are not subject to capital gains taxes until they are sold. The fund has a relatively low expense ratio compared to other leveraged ETFs and ETNs. This means that investors can potentially benefit from higher returns, as a lower expense ratio can result in a higher net return on investment.
Finally, FNGU provides investors with a unique and potentially lucrative investment opportunity in the rapidly growing technology sector. While leveraged products come with increased risk, FNGU's focus on highly traded technology and internet-related stocks, its leveraged exposure, and its low expense ratio make it a bullish investment opportunity for investors looking to gain exposure to the technology sector. However, it is important to note that leveraged products such as FNGU are intended for experienced investors who can handle the increased risk and volatility.
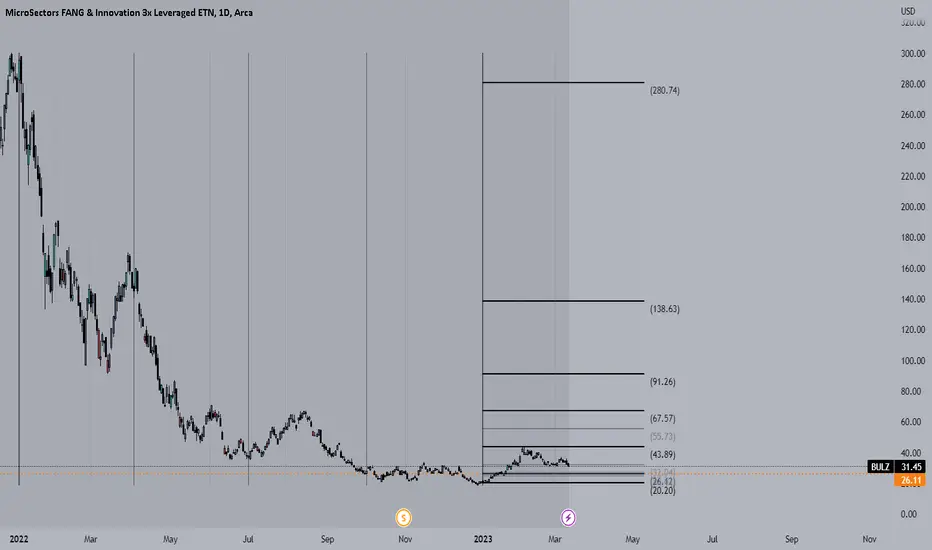
BULZ LongAm planning to buy BULZ shares, the opening range of the quarter (january) looks bullish, we are in discount almost (25.0) and the extension might be 100 and then 200 (targets). Planning to hold for a while the catalyst is the decrease in rates that is likely to make price to increase.
Just an idea do not risk more than your phycological capital allows you to risk.
FNGD IMPLIES TECH IS BULLISHThere is one gap, and one weak trend holding up this pump. TBH, in about 90% of cases I've seen, this weak trend won't hold up, and should favor the downside. This means that tech should be bullish in the upcoming week. With the current market, we can't really know how long that will last, but I assume now that the SIBV news has broke, along with the student debt news, I'd imagine we could see a small pump to technology incoming.
If that weak trend were to hold up allowing indicators to bottom out again, then a potential push to close that gap is possible.

follow the trend or not what do think ?seems like we going back down again , follow the trend or not what do think ?