GDX trade ideas
$GDX $NUGT $JNUG Short play - Is this where you want to go long?I rarely post two charts in a day but this one seemed pretty good. Self explanatory chart, Classic support turned resistance. I also see divergence between the price of gold and the gold miners, with gold not moving at resistance and GDX pushing up. I think that signals GDX is over extended. I can update it later to put more detail if needed. Short/sell at the Red rectangle, cover at the green ones.
Keep in mind this is 2016-2018, seems pretty solid. If you agree/disagree leave a comment.
Update: Forgot to add there's a trendline we're hitting if you connect Jan 23 2018, July 10 2018, and now. That's lot of resistance signals in one place.
GDX - Breaking out of Wedge and CloudLong on GLD and SLV, global market blood bath continues unabated and now USA joining in...

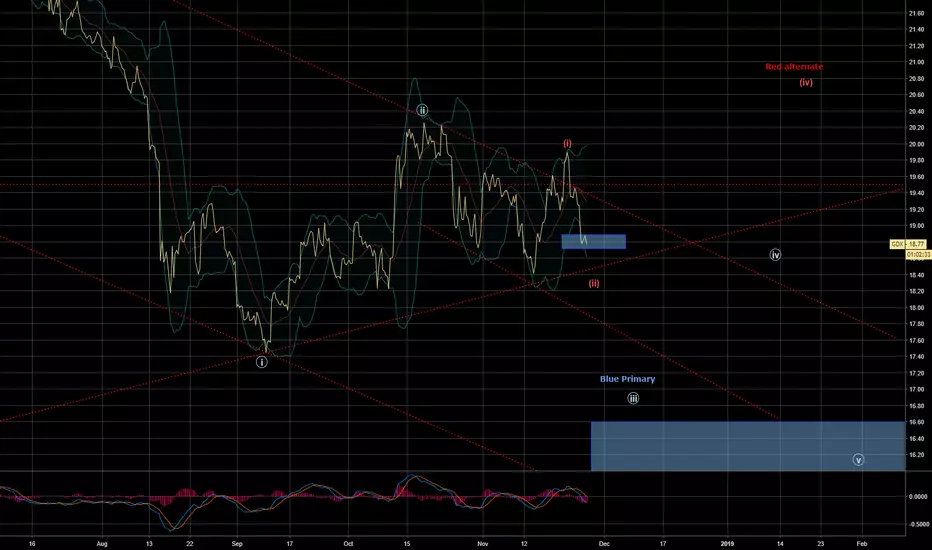
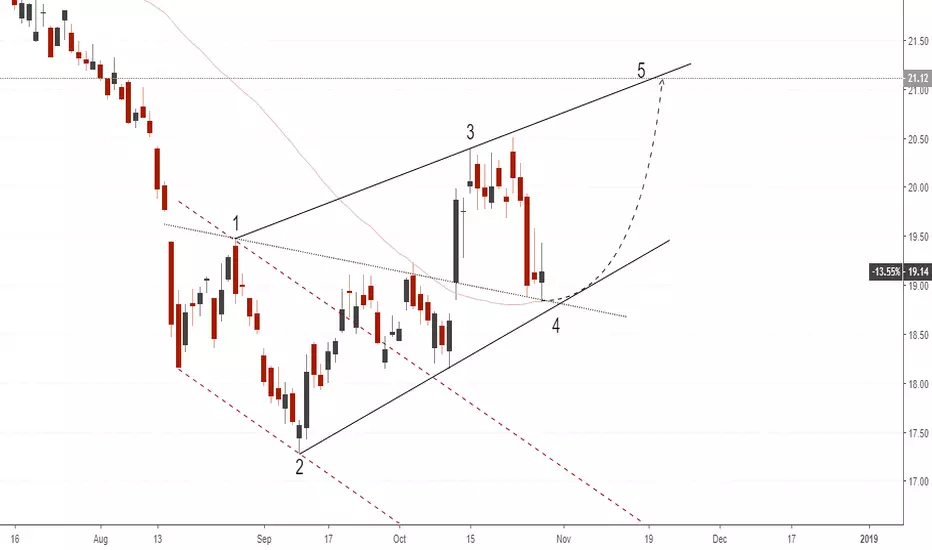
GDX Inflection PointFor those who trade in gold and silver resource stocks, looks like we are at a major inflection point. The blue EW looks to be the most plausible path for GDX while the red is still a viable alternative. The small blue diagonal box will tell us a lot as this is the inflection point IMHO. A break above this and the trend line would indicate the bottom is in place for Primary wave 2. Below this box and we have OML. Just my opinion.
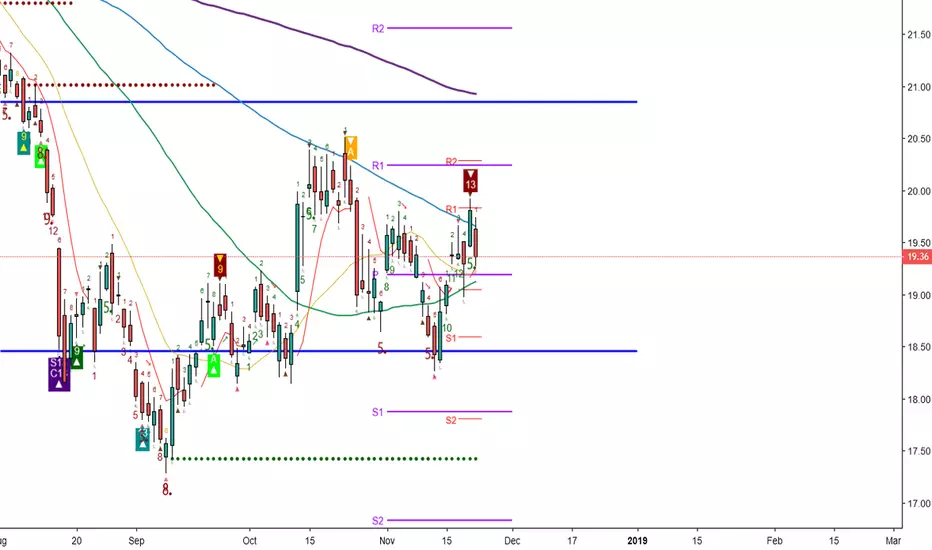
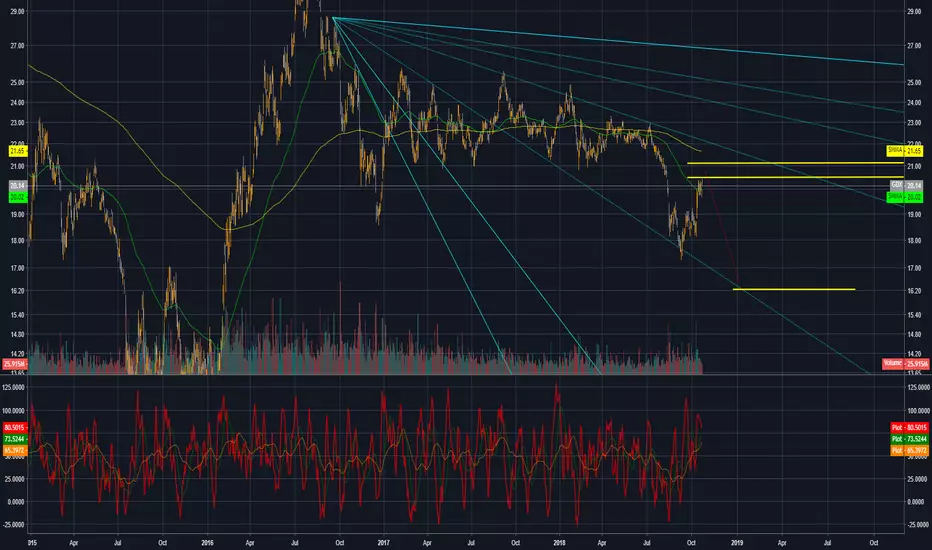
bearish GDX200 day trending down. Making lower high at 100 day, on a red sequential 13 and very bearish 3-candle formation
Short.
Target 17.67
stop loss 20
Stay safe!

Short into FOMCPOTENTIAL drop in gold prices after midterms and FOMC tomorrow based on bullishness in the broader indexes and drop in vix. Short GDX via a long position in DUST stop loss at todays high of 19.66 as bearish momentum needs to be confirmed today to hold position tomorrow.

wedgethis wedge can be a great chance to open long positions as soon the price breaks the upper level of the wedge, the take profit will be the top level of the wedge projected with a horizontal line.
wedgethis falling wedge can be a great opportunity to invest we can open long positions as soon as the price breaks the upper level, the take profit will be the top of the wedge projected with a horizontal line.
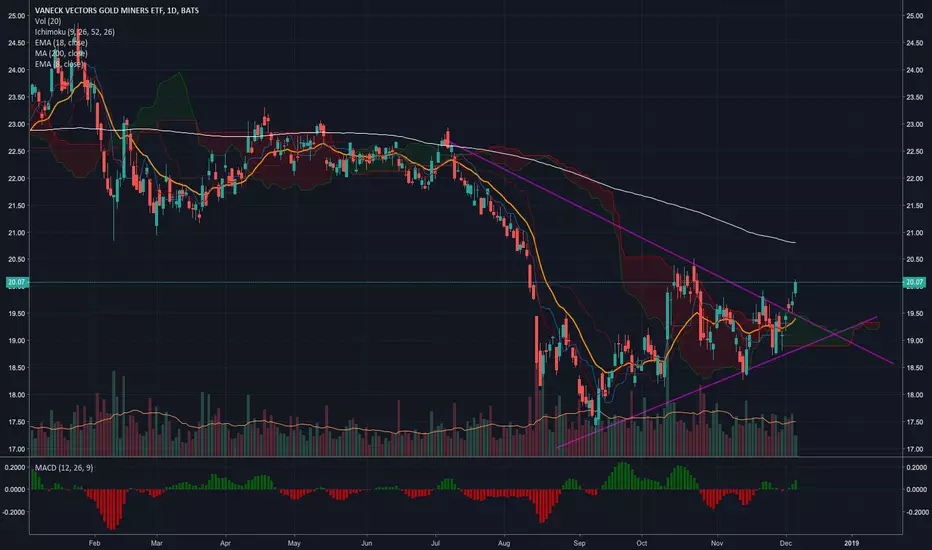
Make or brake for GDXIt is decision time for GDX. If it breaks the red line, the bear will continue, so higher highs (and ASAP!) are required to support the weak bullish case. Note the MACD bearish crossover.
Overall, it seems to support the bearish case for gold.


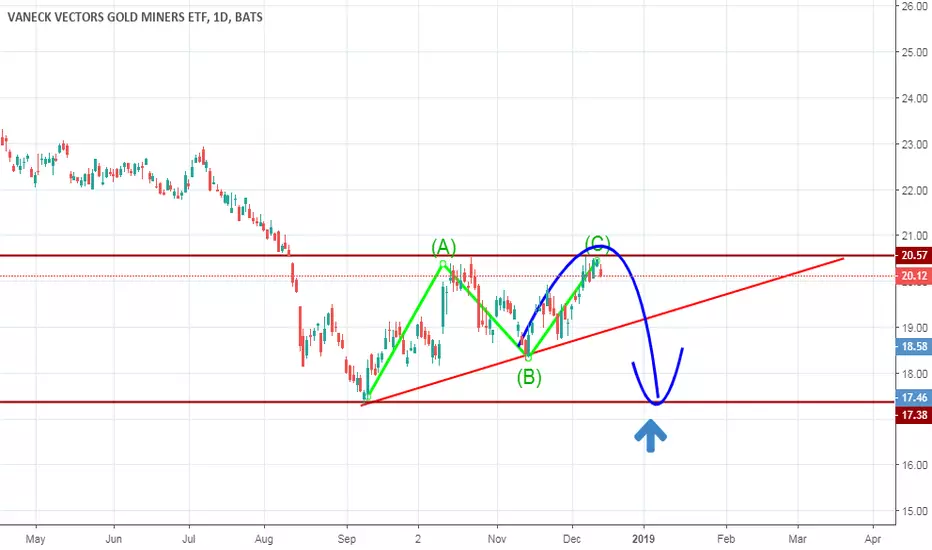
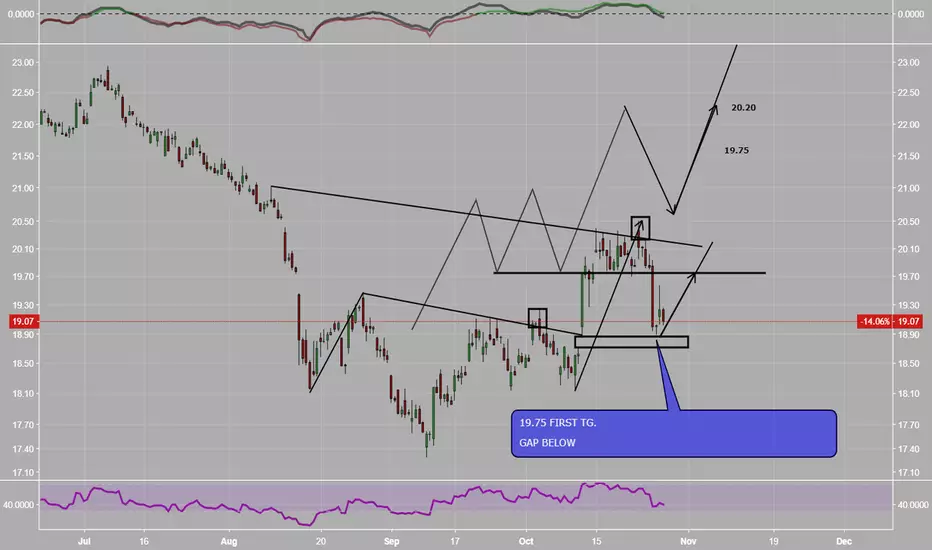
GDX- Breakdown at breakout Gdx broke down at the breakout area. We can see price retesting 19.75. Gold is looking to break out.
Do yourself a favor, don't short miners for the long runDo yourself a favor..buy low and sell high...Really simple long term plan here

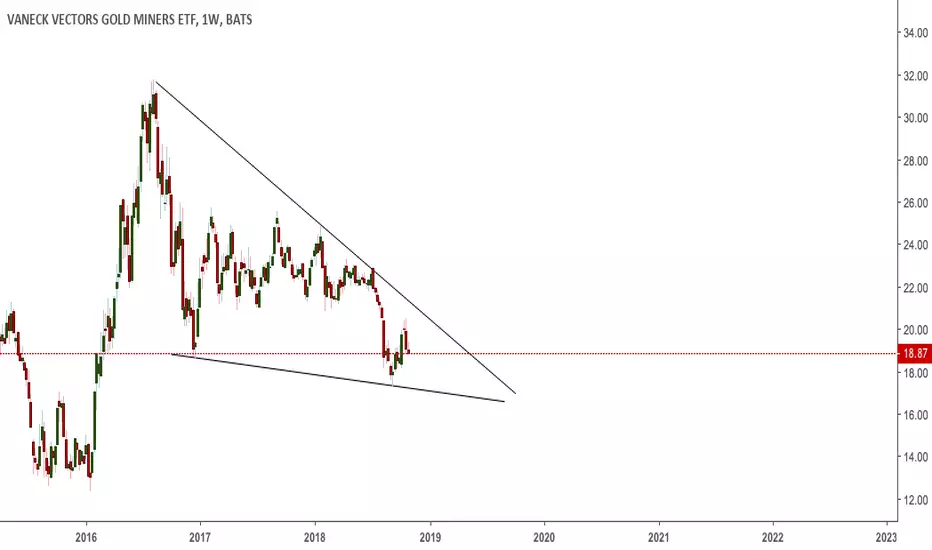
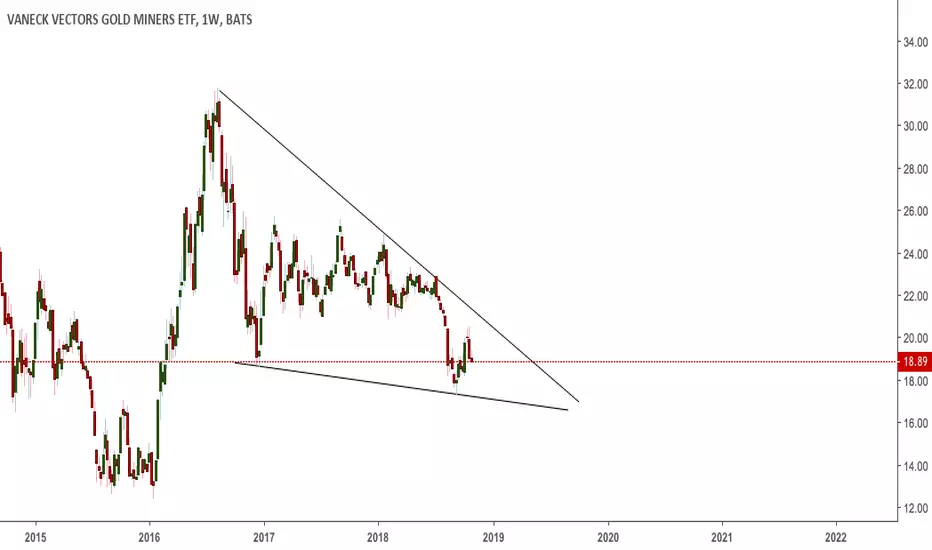
GDX RectangleWhether we break up or down, I expect a move of about $4.82. High-side target of $30, low-side of $16.


GDX quick move to upside.Planning to scale into trade til gap covered. Hoping to go up before hitting resistance above. Around 8 day hold.

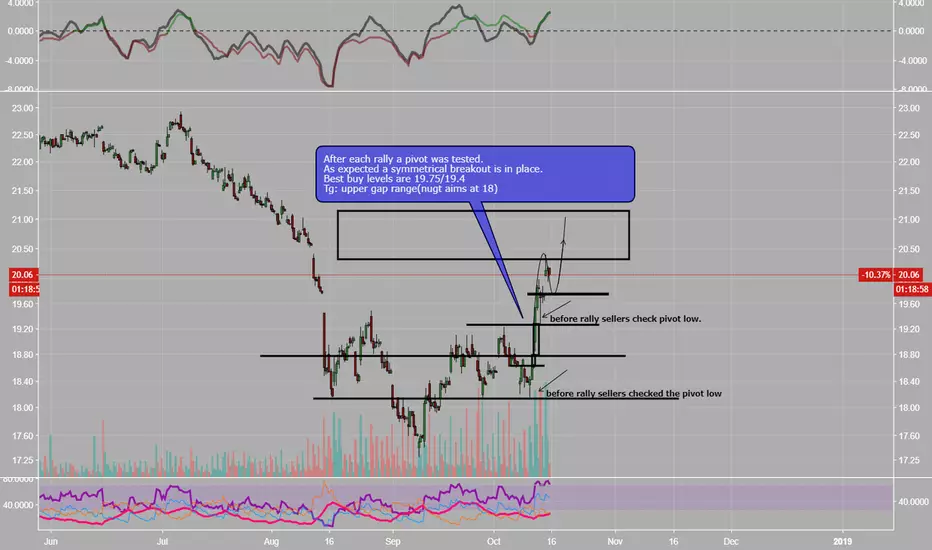
GDX- Is symmetry beautiful?PA near 19.75 is key in my thoughts. We might not ever get that low. Safe trade Big profits :-)
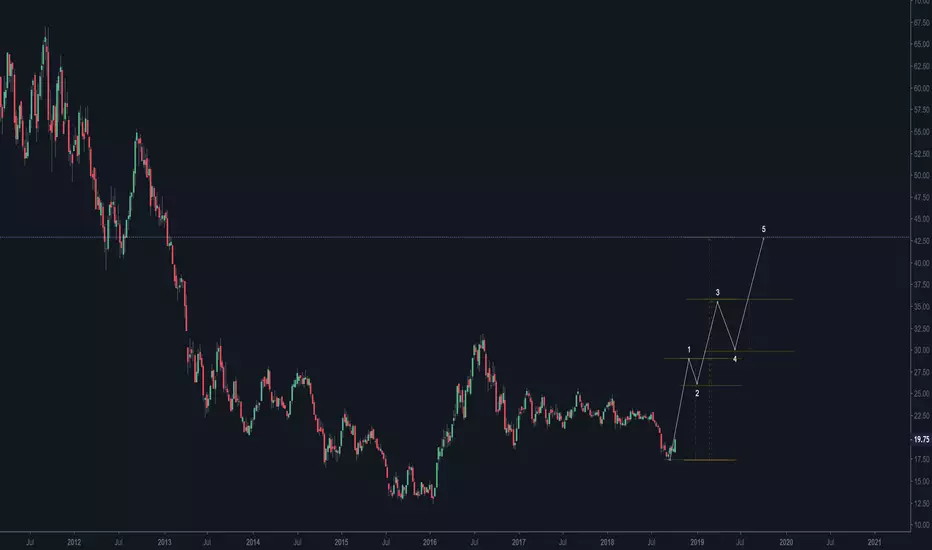
GDX VANECK VECTOR stands in front of a large rise...GDX VANECK VECTOR stands in front of a large rise. Your exchange rate can practically doubled. Therefore, gold miners' stocks are a good investment. The exchange rate increase can be achieved by building a triple wave structure. The first correction can start at 29 usd levels. Its size is 0.25 D1 ATR. Next, the second wave structure could be built with a target price of 35.89 usd. Then a 0.5 D1 ATR correction is expected and further rise. The third wave structure can reach 43 usd levels.