GGM Macro Alignment ETF | Chart & Forecast SummaryKey Indicators On Trade Set Up In General
1. Push Set Up
2. Range Set Up
3. Break & Retest Set Up
Notes On Session
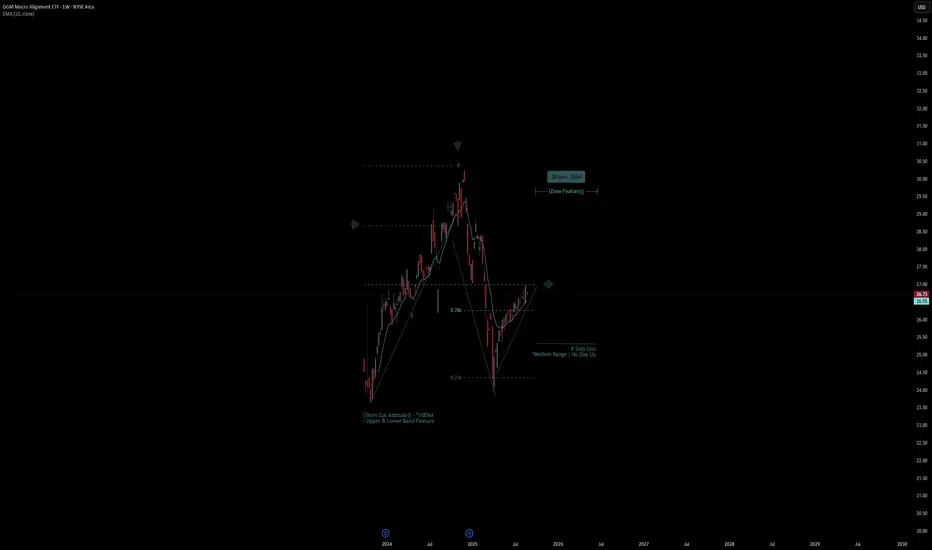
# GGM Macro Alignment ETF
- Double Formation
* Upper & Lower Band Feature - Long Entry - *10EMA | Subdivision 1
* Medium Range | No Size Up - *Retest Area | Completed Survey
* 40bars,
Key stats
About GGM Macro Alignment ETF
Home page
Inception date
Sep 26, 2023
Structure
Open-Ended Fund
Replication method
Physical
Dividend treatment
Distributes
Distribution tax treatment
Qualified dividends
Income tax type
Capital Gains
Max ST capital gains rate
39.60%
Max LT capital gains rate
20.00%
Primary advisor
Grant/GrossMendelsohn LLC
Distributor
Northern Lights Distributors LLC
ISIN
US66538F1571
GGM is the first ETF offered by GGM. The fund aims to outperform the S&P 500 by constructing an equally-weighted portfolio that continually adapts to the evolving economic conditions of the US market. Holdings include ETFs that represent the GICS sectors and sub-sectors, equities of any size, and both growth and value investment styles, in addition to fixed income. In selecting, the fund emphasizes those with low expenses, minimal tracking err, and ample liquidity. Using a quantitative, rule-based process, the fund assesses key economic variables like growth rates and inflation expectations. On a quarterly basis, the fund chooses three sector ETFs and two style ETFs based on its anticipated economic outlook for the next quarter. Specifically, it selects those with the highest rolling back-tested return percentages. Due to active trading, the fund may experience a high portfolio turnover rate. Note that fixed-income exposure is only present during defensive positions.
Related funds
Classification
What's in the fund
Exposure type
ETF
Stock breakdown by region
Top 10 holdings
Summarizing what the indicators are suggesting.
Oscillators
Neutral
SellBuy
Strong sellStrong buy
Strong sellSellNeutralBuyStrong buy
Oscillators
Neutral
SellBuy
Strong sellStrong buy
Strong sellSellNeutralBuyStrong buy
Summary
Neutral
SellBuy
Strong sellStrong buy
Strong sellSellNeutralBuyStrong buy
Summary
Neutral
SellBuy
Strong sellStrong buy
Strong sellSellNeutralBuyStrong buy
Summary
Neutral
SellBuy
Strong sellStrong buy
Strong sellSellNeutralBuyStrong buy
Moving Averages
Neutral
SellBuy
Strong sellStrong buy
Strong sellSellNeutralBuyStrong buy
Moving Averages
Neutral
SellBuy
Strong sellStrong buy
Strong sellSellNeutralBuyStrong buy
Displays a symbol's price movements over previous years to identify recurring trends.
Frequently Asked Questions
An exchange-traded fund (ETF) is a collection of assets (stocks, bonds, commodities, etc.) that track an underlying index and can be bought on an exchange like individual stocks.
GGM trades at 26.67 USD today, its price has risen 0.13% in the past 24 hours. Track more dynamics on GGM price chart.
GGM net asset value is 26.67 today — it's fallen 0.00% over the past month. NAV represents the total value of the fund's assets less liabilities and serves as a gauge of the fund's performance.
GGM assets under management is 17.90 M USD. AUM is an important metric as it reflects the fund's size and can serve as a gauge of how successful the fund is in attracting investors, which, in its turn, can influence decision-making.
GGM price has risen by 0.02% over the last month, and its yearly performance shows a −5.86% decrease. See more dynamics on GGM price chart.
NAV returns, another gauge of an ETF dynamics, have fallen by 0.00% over the last month, showed a 1.99% increase in three-month performance and has decreased by −4.11% in a year.
NAV returns, another gauge of an ETF dynamics, have fallen by 0.00% over the last month, showed a 1.99% increase in three-month performance and has decreased by −4.11% in a year.
GGM fund flows account for −2.10 M USD (1 year). Many traders use this metric to get insight into investors' sentiment and evaluate whether it's time to buy or sell the fund.
Since ETFs work like an individual stock, they can be bought and sold on exchanges (e.g. NASDAQ, NYSE, EURONEXT). As it happens with stocks, you need to select a brokerage to access trading. Explore our list of available brokers to find the one to help execute your strategies. Don't forget to do your research before getting to trading. Explore ETFs metrics in our ETF screener to find a reliable opportunity.
GGM invests in funds. See more details in our Analysis section.
GGM expense ratio is 0.91%. It's an important metric for helping traders understand the fund's operating costs relative to assets and how expensive it would be to hold the fund.
No, GGM isn't leveraged, meaning it doesn't use borrowings or financial derivatives to magnify the performance of the underlying assets or index it follows.
In some ways, ETFs are safe investments, but in a broader sense, they're not safer than any other asset, so it's crucial to analyze a fund before investing. But if your research gives a vague answer, you can always refer to technical analysis.
Today, GGM technical analysis shows the buy rating and its 1-week rating is neutral. Since market conditions are prone to changes, it's worth looking a bit further into the future — according to the 1-month rating GGM shows the sell signal. See more of GGM technicals for a more comprehensive analysis.
Today, GGM technical analysis shows the buy rating and its 1-week rating is neutral. Since market conditions are prone to changes, it's worth looking a bit further into the future — according to the 1-month rating GGM shows the sell signal. See more of GGM technicals for a more comprehensive analysis.
Yes, GGM pays dividends to its holders with the dividend yield of 1.42%.
GGM trades at a premium (0.13%).
Premium/discount to NAV expresses the difference between the ETF’s price and its NAV value. A positive percentage indicates a premium, meaning the ETF trades at a higher price than the calculated NAV. Conversely, a negative percentage indicates a discount, suggesting the ETF trades at a lower price than NAV.
Premium/discount to NAV expresses the difference between the ETF’s price and its NAV value. A positive percentage indicates a premium, meaning the ETF trades at a higher price than the calculated NAV. Conversely, a negative percentage indicates a discount, suggesting the ETF trades at a lower price than NAV.
GGM shares are issued by Grant/GrossMendelsohn LLC
GGM follows the No Underlying Index. ETFs usually track some benchmark seeking to replicate its performance and guide asset selection and objectives.
The fund started trading on Sep 26, 2023.
The fund's management style is active, aiming to outperform its benchmark index by actively selecting and adjusting assets. The goal is to achieve returns that exceed those of the index the fund tracks.